
Last updated: 8 October 2026. Every screenshot below was recorded on 5 October 2026 on an IQ Option Practice account registered in Brazil, in the English interface. We opened menus and panels only; nothing was paid, no deposit was made and the account menu was not opened. Options, payouts and menus depend on your country and can change.
The IQ Option traderoom has a left sidebar, a top bar with your asset tabs and balance, a chart with its tools at the bottom left, a trading panel on the right and a footer with the Support button and the platform clock. This guide goes through each zone with numbered screenshots, so you can find a button before you need it. It was recorded on the web platform; the mobile app has its own guide, IQ Option mobile app.
Quick answer
- Six zones: sidebar (left), asset tabs and balance (top), chart tools (bottom left of the chart), trading panel (right), footer (bottom).
- Sidebar: Total portfolio, Trading history, Performance dashboard, Chats & Support, Tutorials, Promo, Leader board, Market analysis, Tournaments, More.
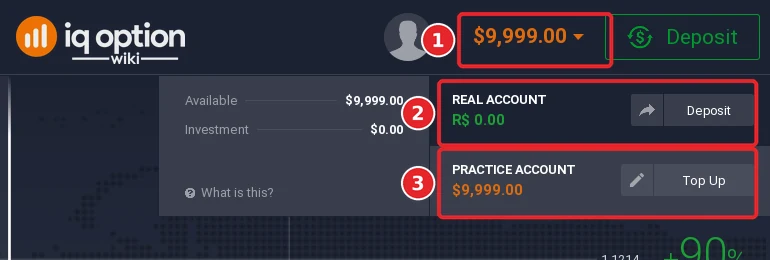
- Balance menu: click the balance to see the Real account (Deposit) and the Practice account (Top Up).
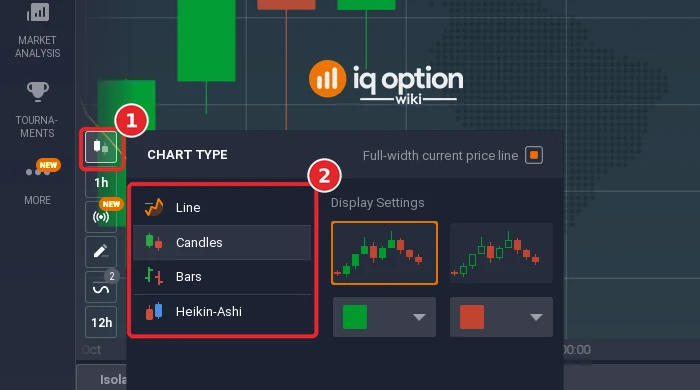
- Chart tools: chart type (Line, Candles, Bars, Heikin-Ashi), candle period (5 seconds to 1 month), Chart Analysis, chart grids.
- Trading panel: Invest, Expiration, Profit, Higher and Lower.
- Support: the red Support button and support@iqoption.com sit in the footer.
Understanding the Interface Layout
Step 1: Find the six zones
The screenshot shows the traderoom with an EUR/USD Blitz chart open. The numbers match the table.
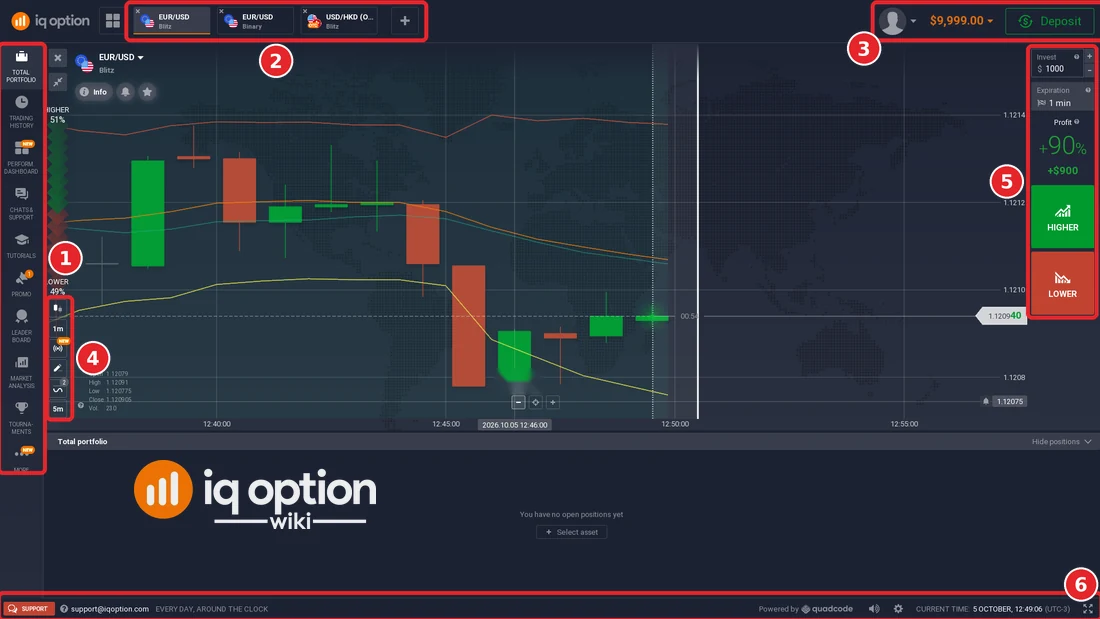
| Number | Zone | Where | What it holds |
|---|---|---|---|
| 1 | Sidebar | Left edge | Total portfolio, Trading history, Performance dashboard, Chats & Support, Tutorials, Promo, Leader board, Market analysis, Tournaments and More |
| 2 | Asset tabs | Top bar, left | One tab per open asset, the button for chart grids and the + button for new assets |
| 3 | Balance and Deposit | Top bar, right | The selected balance, its menu and the Deposit button |
| 4 | Chart tools | Bottom left of the chart | Chart type, candle time period, a NEW signals button, a pencil button, Chart Analysis and the timeframe |
| 5 | Trading panel | Right edge | Invest, Expiration, Profit and the Higher and Lower buttons |
| 6 | Footer | Bottom | The Support button, support@iqoption.com, sound and settings icons, the platform clock and the fullscreen button |
Sidebar Features
Each sidebar item (1 to 10) opens a panel next to the chart or, for the Performance dashboard, a full page. Press the same item again or the X to close it.
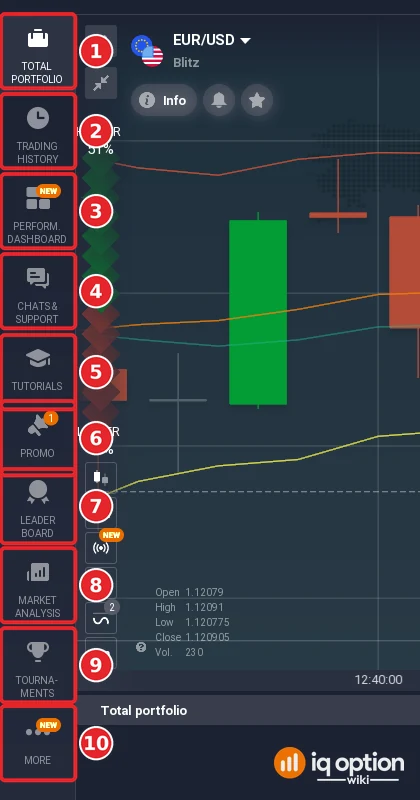
- Total portfolio: your open positions, shown in the panel under the chart. Ours read “You have no open positions yet”.
- Trading history: closed positions with date, asset and result, filtered by a drop-down that reads “All Positions”.
- Perform. dashboard: the Performance dashboard.
- Chats & Support: chat rooms and the support chat; see how to contact IQ Option support.
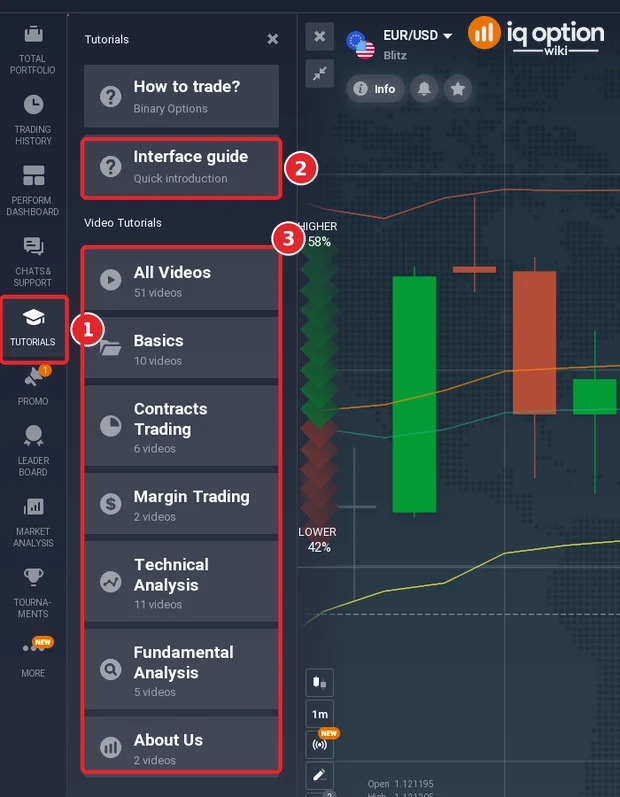
- Tutorials: the interface guide, a binary options guide and video lessons.
- Promo: promotions offered to the account.
- Leader board: the weekly ranking; see the IQ Option leaderboard.
- Market analysis: news.
- Tournaments: see IQ Option tournaments.
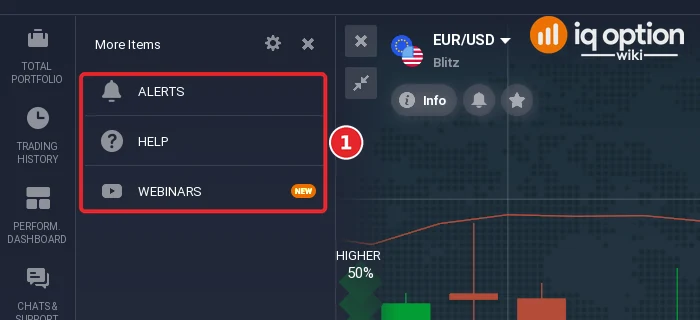
- More: Alerts, Help and Webinars.
Step 2a: Trading history
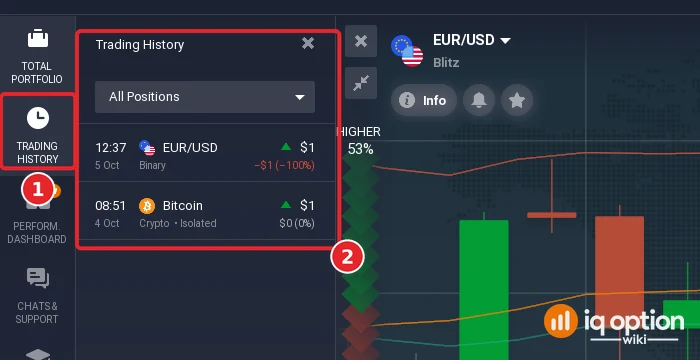
Click Trading history (1). The panel (2) listed our two practice positions: EUR/USD Binary on 5 October with a result of -$1 (-100%) and Bitcoin on 4 October at $0 (0%).
Step 2b: Performance dashboard
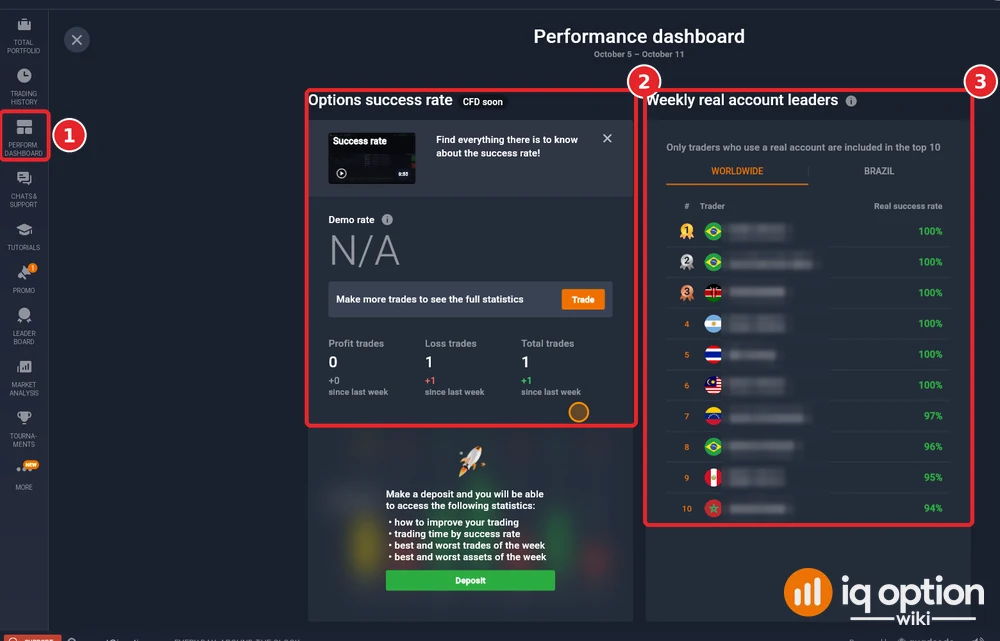
Click Perform. dashboard (1). The page is headed “Performance dashboard” with the week, “October 5 – October 11” on our screen. On the left (2), “Options success rate” shows a Demo rate, here “N/A”, and the counts of profit, loss and total trades. A note says that after a deposit you can see statistics such as how to improve your trading and your best and worst trades of the week. On the right (3), “Weekly real account leaders” lists the top 10 traders by real success rate, worldwide or for your country; the page says only traders who use a real account are included. We blurred the names.
Step 2c: Tutorials
Click Tutorials (1). The panel offers “How to trade?” for Binary Options and an “Interface guide” with a quick introduction (2), then Video Tutorials (3): All Videos (51 videos), Basics (10), Contracts Trading (6), Margin Trading (2), Technical Analysis (11), Fundamental Analysis (5) and About Us (2).
Step 2d: Promo
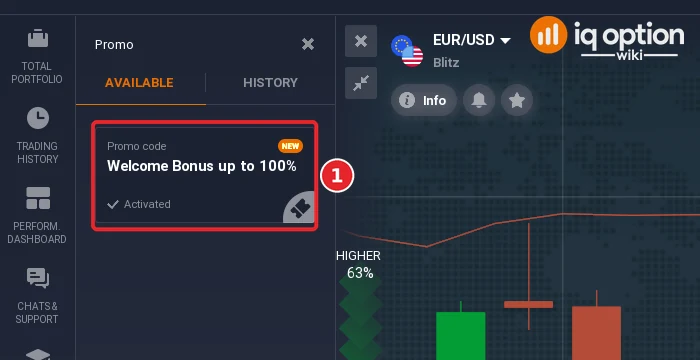
Click Promo. The panel has an Available tab and a History tab. Ours listed one entry (1), a promo code called “Welcome Bonus up to 100%” marked “Activated”. We did not use it, and bonus terms are on IQ Option’s own pages.
Step 2e: Market analysis
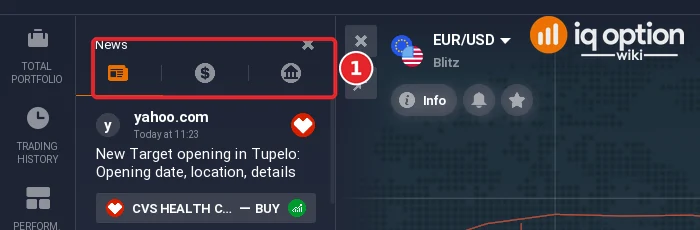
Click Market analysis. The panel is called News. It has three tabs (1); the first lists news items, each with its source, time and a related instrument tagged Buy or Sell.
Step 2f: More
Click More. The “More Items” panel holds Alerts, Help and Webinars (1). Alerts opens price alerts; see price alerts on IQ Option.
Click the balance in the top bar (1). The menu lists the Real account (2), with its Deposit button, and the Practice account (3), with a Top Up button. The balance in the top bar shows the account in use; ours was the Practice account at $9,999.00 after small practice trades. We did not press Deposit or Top Up. The Deposit button next to the balance leads to the cashier; see how to deposit.
Left of the balance, the asset tabs show each open asset with its type, for example EUR/USD Blitz and EUR/USD Binary. The + button opens the asset menu; see choosing an asset.
Chart Area and Analysis Tools
Step 4: Chart type, candle period and indicators
The tools sit in a column at the bottom left of the chart. The top button (1) opens Chart Type: Line, Candles, Bars and Heikin-Ashi (2). See chart types.
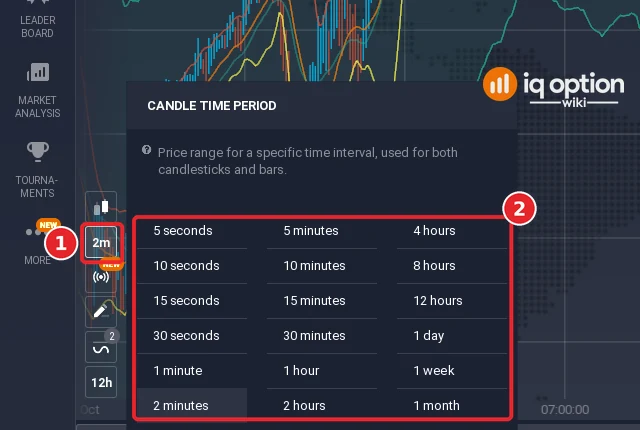
The next button shows the candle time period, for example 1m or 2m (1). Its menu (2) runs from 5 seconds to 1 month: seconds (5, 10, 15, 30), minutes (1, 2, 5, 10, 15, 30), hours (1, 2, 4, 8, 12), 1 day, 1 week and 1 month. The button at the very bottom is a separate Timeframe, the time span shown on the chart. See time frames.
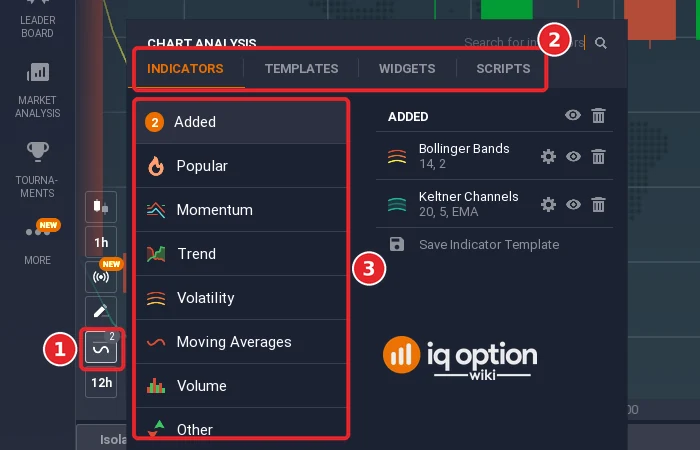
The wave button with a number (1) opens Chart Analysis. Its tabs (2) are Indicators, Templates, Widgets and Scripts. The Indicators tab lists Added, Popular, Momentum, Trend, Volatility, Moving Averages, Volume and Other (3). The number on the button was 2 because we had two indicators on the chart. See chart templates.
Step 5: Chart grids
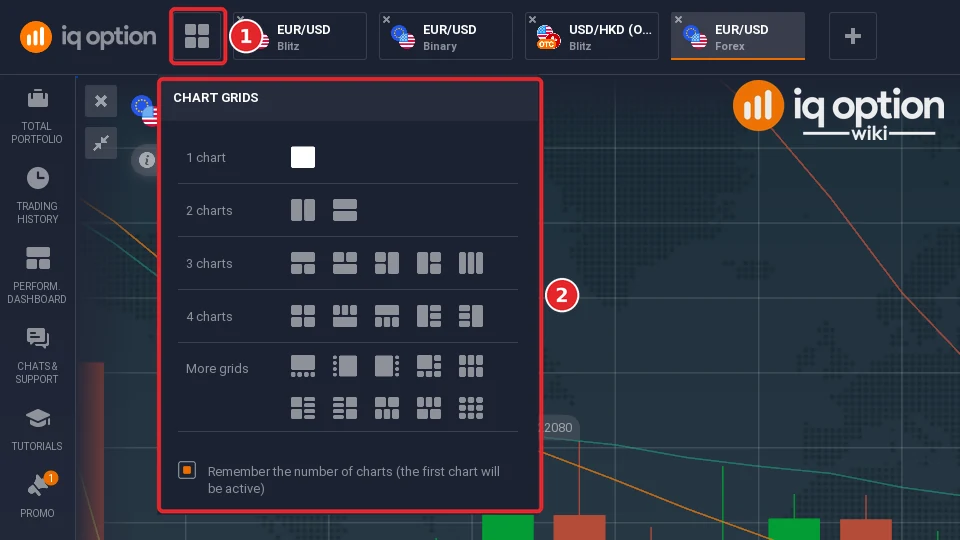
The button left of the asset tabs (1) opens Chart Grids (2): 1 chart, 2 charts, 3 charts, 4 charts and “More grids”. A box at the bottom remembers the number of charts. See chart grids.
Trading Panel (Right Side)
Step 6: Read the trading panel
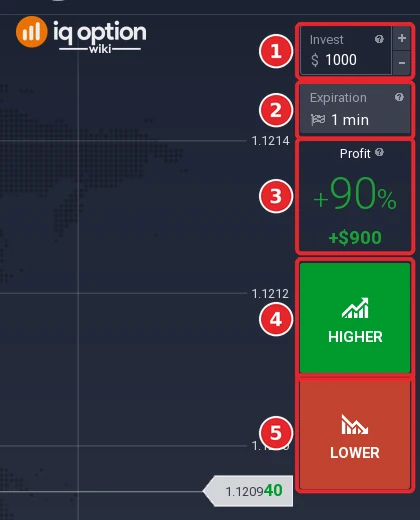
For an EUR/USD Blitz option the panel holds the Invest amount (1), the Expiration (2), the Profit percentage with the amount it would pay (3), and the Higher (4) and Lower (5) buttons. Ours showed an investment of $1000, an expiration of 1 min and a profit of +90% (+$900). The profit changes by asset and by moment, so read it before you trade. For forex and other margin instruments, IQ Option’s Settings describe a Simple mode with Invest, Leverage and Volume fields; see auto-closing for take profit and stop loss.
Expiration is explained in IQ Option trade expiration time. No result in this guide is a promise of profit.
Keyboard Shortcuts for Faster Trading
The shortcuts are listed in Settings, Keyboard shortcuts, where each can be switched off (see IQ Option platform settings). Ours were:
| Action | Keys |
|---|---|
| Close the current window or panel | Esc |
| Fullscreen mode | F11 |
| Move the chart forward quickly | Alt + Page Down |
| Move the chart back quickly | Alt + Page Up |
| Focus on the current price of the asset | Alt + End |
| Chart type Line | Alt + 1 |
| Chart type Candles | Alt + 2 |
| Chart type Bars | Alt + 3 |
| Chart type Heikin-Ashi | Alt + 4 |
Customizing Your Interface
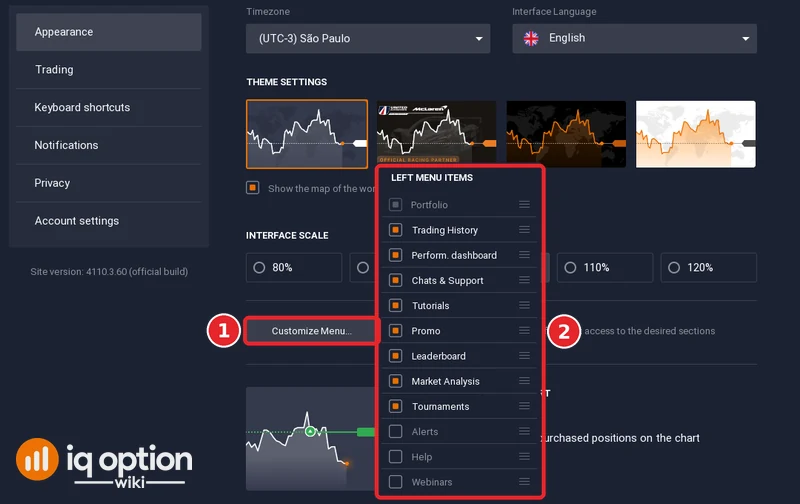
Open Settings with the gear at the bottom right, choose Appearance and click Customize Menu (1). The “Left menu items” list (2) has a box and a drag handle for each item. Portfolio is fixed; Trading History, Perform. dashboard, Chats & Support, Tutorials, Promo, Leaderboard, Market Analysis and Tournaments were ticked; Alerts, Help and Webinars were not, which is why they sit under More.
The same Appearance tab sets the time zone, the interface language, the theme, the interface scale (80% to 120%) and what the chart shows. All settings tabs are covered in the platform settings guide.
Getting Started: Your First Steps
- Register and open the Practice account from the balance menu (Step 3). It uses practice money, so nothing is at risk.
- Open the Interface guide in Tutorials (Step 2c) for IQ Option’s own quick introduction.
- Pick an asset with the + button and read its Profit and Expiration in the trading panel (Step 6).
- Set the chart type, candle period and any indicators (Step 4).
- Place a small trade on the Practice balance to see the whole flow.
Frequently Asked Questions
Q: Can I use the same interface on mobile?
A: The mobile app is a separate application with its own layout. We recorded only the web platform; see our mobile app guide.
Q: How do I switch between the Practice and Real account?
A: Click the balance in the top bar. The menu lists the Real account with a Deposit button and the Practice account with a Top Up button. The balance shown in the top bar is the account in use.
Q: Can I save my chart setup with indicators?
A: Chart Analysis has a Templates tab, and the Indicators tab has a “Save Indicator Template” link. See chart templates.
Q: Is the interface available in my language?
A: Yes, in several. Settings, Appearance, Interface Language lists English, Español, Português, Indonesia and Deutsch at the top and, after scrolling, 한국어, ไทย, Türkçe, العربية and Wikang Tagalog at the end.
Q: How do I contact support from within the platform?
A: Click Chats & Support in the sidebar and open Support, or use the red Support button at the bottom left. The footer shows support@iqoption.com and “Every day, around the clock”.
Q: How many charts can I show at once?
A: Chart Grids offers 1, 2, 3 and 4 chart layouts and a “More grids” row. We tested 2 and 4; see chart grids.
Summary
The traderoom puts navigation on the left, assets and balance on top, the chart and its tools in the middle, the order controls on the right and support and the clock at the bottom. Open each panel once on a Practice account, and the rest of IQ Option’s guides will map onto this layout.

