
Free · readable · MIT licensed
70 IQ Option scripts you can read before you import
50 indicator-combination strategy scripts, the IQ Wiki signal engines and simple context indicators for the IQ Option chart. Each script draws its indicators and marks HIGHER or LOWER setups on completed candles, so you can study a strategy on the Practice balance. 14 marker companions draw the markers of the panel scripts on the price chart, so they show on every asset, JPY pairs included.
- Scripts
- 70
- Categories
- 6
- File type
- .lua
- Orders placed
- Never
Use the Practice balance first. These scripts calculate from historical and current chart data. They are educational tools, not predictions, personal recommendations or evidence that a trade will be profitable. A marker does not tell you what the next candle must do.
Browse the scripts
Filter by idea, search by indicator, then open a script for its exact rules, default settings, chart preview and full source.

- Momentum
- Signal engine
- On price
- Advanced
IQ_WIKI_SCRIP_V1.1.0
A completed-candle adaptation of the regular IQOptionWiki Signals score. It weighs RSI, MACD, Bollinger %B, five directional candle patterns and optional chart-volume confirmation into one score and marks new qualifying setups.
Indicators: RSI · MACD · Bollinger %B (population deviation) · Five candlestick patterns · Optional chart volume

- Momentum
- Signal engine
- On price
- Advanced
IQ_WIKI_BINARY_SIGNAL_GUN_V1.1.0
A stricter local confluence engine with weighted RSI, ATR-normalized MACD, Bollinger and pattern-family votes. Optional strategy alignment must agree with the base direction.
Indicators: Weighted RSI · ATR-normalized MACD · Bollinger · Pattern families · ATR risk

- Trend
- Signal engine
- On price
- Intermediate
IQ_WIKI_SCRIP_V1.0.1
A selective confluence overlay with five readable filters: EMA trend alignment and slope, RSI momentum without chasing extremes, ADX/DMI strength, ATR activity and a candle-quality guard.
Indicators: EMA 9/21/50 · RSI (14) · ADX/DMI (14) · ATR (14)

- Trend
- On price
- Intermediate
ADX EMA28 Cross
Marks a candle that closes through the EMA 28 in the direction that +DI or -DI already favours. The DI lines act as a direction filter, the EMA cross as the trigger.
Indicators: ADX +DI / -DI (5) · EMA (28)

- Trend
- Own panel
- Beginner
Aroon Oscillator Zero Cross
Marks the candle where the Aroon Oscillator crosses its zero line. A cross up means the latest 25-candle high is now more recent than the latest low; a cross down means the opposite.
Indicators: Aroon Oscillator (25)

- Trend
- On price
- Beginner
EMA50 CCI 100
Marks the first CCI break beyond +100 or -100 shortly after price crossed the EMA 50 and stayed on that side. The EMA sets the direction and CCI times the entry, at most once per EMA cross.
Indicators: EMA (50) · CCI (14, levels +/-100)

- Trend
- On price
- Advanced
Fractal Alligator
Marks a close through the last confirmed fractal level when that level lies beyond the Alligator teeth. The Alligator gives the trend reference and the fractal gives the breakout level.
Indicators: Williams Fractals (5) · Alligator (13/8/5, shifted 8/5/3)

- Trend
- On price
- Beginner
Heikin Ashi EMA
Marks the first bullish or bearish Heikin-Ashi candle after a run of two opposite candles, only when price closes on the matching side of EMA 50. Heikin-Ashi is calculated inside the script, so the chart can stay on regular candles.
Indicators: Heikin-Ashi candles (calculated) · EMA (50)

- Trend
- On price
- Advanced
Ichimoku Kijun Cloud
Marks a close back across the Kijun-sen when price is already on the trend side of a coloured Ichimoku cloud. The cloud sets direction and the Kijun cross sets the timing.
Indicators: Ichimoku Cloud (9, 26, 52, displacement 26)

- Trend
- On price
- Intermediate
KAMA Trend
Marks closes that cross Kaufman's Adaptive Moving Average in the direction the average is already sloping. The slope check removes crosses where the flat, slow-moving KAMA is merely being touched by price.
Indicators: KAMA (10, 2, 30)

- Trend
- On price
- Intermediate
LRS Williams R
Uses the slope of a 100-candle regression line as the trend filter and Williams %R leaving its extreme zone as the timing event. The regression line is drawn on the price chart so the slope direction is visible.
Indicators: Linear Regression Slope (100) · Williams %R (14, levels -80/-20)

- Trend
- On price
- Intermediate
MACD PSAR EMA
Marks a MACD signal-line cross that is backed by candle colour, the EMA and the Parabolic SAR. Three different views of price have to agree on the same completed candle.
Indicators: MACD (12, 26, 9) · Parabolic SAR (0.02, 0.2) · EMA (10)

- Trend
- On price
- Intermediate
McGinley Dynamic RSI
Marks closes that cross the McGinley Dynamic line when RSI agrees on the side of 50. The McGinley Dynamic adjusts its own speed to price, and RSI gives a second opinion on momentum.
Indicators: McGinley Dynamic (14) · RSI (14, level 50)

- Trend
- On price
- Intermediate
RSI Stochastic EMA200
Uses the EMA 200 as a trend filter, RSI 50 as a momentum filter and a Stochastic cross out of its extreme zone as the timing. It marks the end of a pullback in the direction of the larger trend.
Indicators: EMA (200) · RSI (14) · Stochastic (14, 3, 3)

- Trend
- On price
- Beginner
SMA 8 21 Cross
Marks the candle on which the 8-period simple moving average crosses the 21-period average and price closes beyond both lines. It is the classic two-average cross with a simple price check.
Indicators: SMA (8) · SMA (21)

- Trend
- On price
- Intermediate
Supertrend EMA 200
Marks Supertrend direction flips only when the candle closes on the same side of the 200-period EMA. The EMA acts as a simple long-term bias filter for the Supertrend flip.
Indicators: Supertrend (10, 3) · EMA (200)

- Trend
- Own panel
- Intermediate
Trend Intensity Index
Marks the moment the Trend Intensity Index enters its strong zone: above 80 for upward pressure or below 20 for downward pressure, with the close on the matching side of the 60-period SMA. It is a trend-strength entry marker, not a reversal marker.
Indicators: Trend Intensity Index (30, SMA 60)

- Trend
- On price
- Intermediate
VHF EMA Cross
Marks EMA 9 and EMA 21 crosses only while the Vertical Horizontal Filter reports a trending market. The filter removes crosses that happen during sideways price action, where moving-average crosses tend to be unreliable.
Indicators: Vertical Horizontal Filter (28, 0.35) · EMA (9) · EMA (21)

- Trend
- Own panel
- Intermediate
Vortex MACD
Marks a Vortex VI+/VI- cross when the MACD line is on the matching side of its signal line. The Vortex cross shows which direction dominates and the MACD checks that momentum agrees.
Indicators: Vortex Indicator (21) · MACD (12, 26, 9)

- Trend
- On price
- Beginner
Well Defined EMA
After the EMA 20 crosses the EMA 50, marks the first pullback of price to the EMA 20 that closes back in the direction of the new trend. It turns the article's two steps (cross, then pullback) into one marker.
Indicators: EMA (20) · EMA (50)

- Trend
- On price
- Beginner
Williams R EMA Pullback
Marks the Williams %R cross back out of its oversold or overbought zone, but only when price is on the matching side of the EMA 50. The EMA turns the article's plain %R cross into a pullback-in-trend setup.
Indicators: Williams %R (14, -80/-20) · EMA (50)

- Reversal
- On price
- Beginner
Bollinger RSI Reversal
Marks the first candle that closes back inside the Bollinger Bands after a close outside a band with RSI in its oversold or overbought zone. The bands show how stretched price is and RSI adds a second view of the same stretch.
Indicators: Bollinger Bands (20, 2) · RSI (14, 30/70)

- Reversal
- Own panel
- Beginner
DeMarker 30 70 Cross
Marks the candle where DeMarker closes back out of its oversold or overbought zone. The 30 and 70 levels are the ones used in the related guide.
Indicators: DeMarker (14, levels 30/70)

- Reversal
- On price
- Beginner
Donchian RSI Reversal
Marks the moment RSI leaves its oversold or overbought zone after price touched the matching Donchian band in the same excursion. The channel shows where price is stretched; RSI shows when momentum starts to turn.
Indicators: Donchian Channel (20) · RSI (14, 30/70)

- Reversal
- Own panel
- Intermediate
Double Stochastic
Marks the candle where a slow Stochastic confirms a reversal cross that the fast Stochastic already showed in the same oversold or overbought zone. Using two settings asks the same question on two time scales before a marker appears.
Indicators: Stochastic fast (8, 3, 5) · Stochastic slow (17, 3, 7)

- Reversal
- On price
- Beginner
Envelopes RSI
Marks a bounce from the Envelope lines: a candle reaches the outer line, closes back inside, and RSI confirms that price was stretched. It follows the 'bounce from the sides' method in the related article.
Indicators: Moving Average Envelopes (SMA 20, deviation 1) · RSI (14, 35/65)

- Reversal
- Own panel
- Intermediate
Fisher Transform Reversal
Marks a Fisher Transform cross of its trigger line while the indicator is in an extreme zone. This is the extreme-then-cross confirmation the related article describes.
Indicators: Ehlers Fisher Transform (10)

- Reversal
- On price
- Beginner
Harami RSI
Marks bullish and bearish harami candle pairs when RSI is in a low or high zone. RSI helps check that the pair follows a push in the opposite direction.
Indicators: Harami candle pair · RSI (14, 40/60)

- Reversal
- Own panel
- Intermediate
KDJ Cross
Marks K/D crosses that happen while the faster J line is already stretched below 20 or above 80. J reaches the extremes first, so the cross after it is used as the timing event.
Indicators: KDJ (9, 3, 3)

- Reversal
- On price
- Beginner
Keltner Re-entry
Marks the candle that closes back inside the Keltner Channel after the previous candle closed outside it. The channel width follows volatility, so a close outside it shows an unusually stretched move.
Indicators: Keltner Channel (EMA 20, 2 x ATR)

- Reversal
- On price
- Intermediate
Morning Evening Star RSI
Marks morning star and evening star candle patterns when RSI on the middle candle was at a low or high zone. RSI helps check that the pattern follows a push in the opposite direction.
Indicators: Morning and evening star candles · RSI (14, 40/60)

- Reversal
- Own panel
- Beginner
RSI Law
Marks the candle on which a short RSI(5) closes back across the 30 or 70 line after an excursion into the extreme zone. This is the RSI Law rule from the related article, shown as completed-candle markers.
Indicators: RSI (5, 30/70)

- Reversal
- On price
- Beginner
STARC Bands Reversal
Marks a bullish or bearish candle that closes back inside the STARC Bands after the previous close was outside them. The bands show where price is stretched in ATR terms.
Indicators: STARC Bands (SMA 6, ATR 15, x2)

- Reversal
- On price
- Beginner
Stochastic PSAR
Marks a Stochastic %K/%D cross that starts in the oversold or overbought zone while the Parabolic SAR dot is on the matching side of price. The Stochastic gives the timing and the SAR checks the trailing stop agrees.
Indicators: Stochastic (14, 3, 3) · Parabolic SAR (0.02, 0.2)

- Reversal
- Own panel
- Intermediate
Three Oscillators
Counts how many of three oscillators have just crossed back out of their extreme zone and marks the candle where at least two agree. It follows the article's trio setup, where all three is strongest and two of three is enough.
Indicators: RSI (14, 30/70) · CCI (20, +/-100) · Williams %R (14, -80/-20)

- Momentum
- On price
- Beginner
Awesome Oscillator SMA
Marks the candle on which the Awesome Oscillator crosses zero in the direction of the 100-period SMA. The SMA acts as a simple trend filter for the oscillator.
Indicators: Awesome Oscillator (5, 34) · SMA (100)

- Momentum
- Own panel
- Beginner
Double Momentum 20 3
Marks the candle where the fast Momentum(3) line crosses zero in the direction of the slower Momentum(20) line. The slow line gives the trend side, the fast line gives the timing.
Indicators: Momentum (20) · Momentum (3)

- Momentum
- On price
- Intermediate
Elder Impulse
Marks the first candle where both trend (EMA 13) and momentum (MACD histogram) turn the same way, following Alexander Elder's Impulse System colours. A marker appears only when the state changes, not on every green or red candle.
Indicators: EMA (13) · MACD histogram (12, 26, 9)

- Momentum
- On price
- Beginner
EMA Momentum
Marks the candle that completes two events: price closes across the EMA(20) and the Momentum(20) line crosses zero, within a few candles of each other. Both must still be true on the marked candle.
Indicators: EMA (20) · Momentum (20)

- Momentum
- On price
- Beginner
MACD PSAR 7-14-5
Marks the candle on which the fast MACD line crosses the zero line while the Parabolic SAR sits on the matching side of price. The MACD cross shows momentum changing side and the SAR dot shows which side the trailing stop is on.
Indicators: MACD (7, 14, 5) · Parabolic SAR (0.02, 0.2)

- Momentum
- Own panel
- Intermediate
Schaff Trend Cycle
Marks the candle where the Schaff Trend Cycle leaves its low zone (crosses above 25) or its high zone (crosses below 75). The STC is a fast, bounded version of MACD, so it turns earlier than MACD alone.
Indicators: Schaff Trend Cycle (10, 23, 50)

- Momentum
- Own panel
- Intermediate
TSI Signal Cross
Marks TSI crossing its signal line, but only when the cross happens on the far side of zero: upward crosses below zero and downward crosses above zero. Requiring the zero-line side keeps the marker to turns that start from a stretched reading.
Indicators: True Strength Index (25, 13) · EMA signal (7)

- Momentum
- Own panel
- Beginner
Ultimate Oscillator Cross
Marks the Ultimate Oscillator leaving its oversold or overbought zone. The oscillator blends three periods, so it reacts more evenly than a single-period oscillator.
Indicators: Ultimate Oscillator (7, 14, 28)

- Momentum
- Own panel
- Intermediate
Woodies CCI
Marks a Woodies CCI zero-line cross: the 14-period CCI changes side after six candles on the other side, while the faster Turbo CCI already agrees. The zero line is the baseline the article uses to define trend side.
Indicators: CCI (14) · Turbo CCI (6)

- Breakout
- On price
- Beginner
BB1 Bollinger
Marks the first candle that closes outside a narrow Bollinger Band (deviation 1) after two candles closed inside it. It follows the BB1 rule from the related article, where the move out of the band is read in the direction of the break.
Indicators: Bollinger Bands (20, deviation 1)

- Breakout
- On price
- Intermediate
Donchian Turtle Breakout
Marks a close beyond the previous 20-candle high or low when ATR is above its 50-period average. It is a simplified channel breakout in the spirit of the Turtle rules, with an ATR filter to ask for expanding volatility.
Indicators: Donchian breakout (20) · ATR (14) · SMA of ATR (50)

- Breakout
- On price
- Intermediate
Fractal Chaos Bands Break
Marks a close through the Fractal Chaos Bands: the upper band is the last confirmed fractal high and the lower band the last confirmed fractal low.
Indicators: Fractal Chaos Bands

- Price action
- On price
- Beginner
Inside Bar Breakout
Marks the first close beyond the mother bar after an inside bar, within 3 candles and in the direction of EMA 50. The inside bar shows a pause; the breakout shows which way it resolved.
Indicators: Inside bar pattern · EMA (50)

- Price action
- On price
- Intermediate
Pin Bar Bollinger
Marks a pin bar whose long wick reaches an outer Bollinger Band and whose body closes back inside. The band shows where price is stretched; the pin bar shows that the stretch was rejected.
Indicators: Bollinger Bands (20, 2) · Pin bar candle geometry

- Price action
- On price
- Intermediate
Pin Bar Inside Bar
Finds the pin bar and inside bar combo from the related article: a rejection candle followed by a candle that stays inside its range. The marker appears when price then closes beyond the pin bar in the direction of its wick.
Indicators: Pin bar candle geometry · Inside bar pattern

- Price action
- On price
- Intermediate
RSI EMA200 Engulfing
Marks an engulfing candle that agrees with the long-term EMA 200 side and the RSI 50 midline. The EMA and RSI filter out engulfing candles that go against the broader direction.
Indicators: EMA (200) · RSI (14, midline 50) · Engulfing candle

- Price action
- On price
- Beginner
Three Candles Continuation
Marks the candle that completes three same-colour full-bodied candles with steady closes while price is on the matching side of EMA 20. An option flips the reading to the counter-trend idea described in the article.
Indicators: Three full candles · EMA (20)

- Volatility
- On price
- Intermediate
Bollinger Keltner Squeeze
Marks the first candle after a Bollinger-inside-Keltner squeeze of at least 6 candles ends, with Momentum showing which side price is leaning. The squeeze shows quiet volatility; Momentum adds a direction.
Indicators: Bollinger Bands (20, 2) · Keltner Channel (20, 1.5 ATR) · Momentum (12)

- Trend
- Context indicator
- On price
- Beginner
EMA Trend Ribbon
Plots a fast and slow exponential moving average over price and shades the space between them with a neutral ribbon, making the relationship between two smoothing speeds easier to see.
Indicators: EMA 9 · EMA 21

- Volatility
- Context indicator
- Own panel
- Beginner
Normalized ATR Percent
Expresses Average True Range as a percentage of the current close. Normalizing the value makes volatility readings easier to compare across instruments with different price levels.
Indicators: ATR (14) as % of close

- Momentum
- Context indicator
- Own panel
- Beginner
Price EMA Distance Percent
Shows how far the selected price source is above or below an EMA in percentage terms. A configurable reference zone helps compare the current distance with your chosen scale.
Indicators: EMA (20) distance in %

- Trend
- Marker companion
- On price
- Beginner
Aroon Oscillator Zero Cross Markers
Draws the HIGHER and LOWER markers of the Aroon Oscillator Zero Cross script on the price chart, above and below the candles, so they show on every asset, JPY pairs included. No lines: add Aroon Oscillator Zero Cross as well for the Aroon Oscillator line.
Indicators: Aroon Oscillator (25)

- Trend
- Marker companion
- On price
- Intermediate
Trend Intensity Index Markers
Draws the HIGHER and LOWER markers of the Trend Intensity Index script on the price chart, above and below the candles, so they show on every asset, JPY pairs included. No lines: add Trend Intensity Index as well for the TII line.
Indicators: Trend Intensity Index (30, SMA 60)

- Trend
- Marker companion
- On price
- Intermediate
Vortex MACD Markers
Draws the HIGHER and LOWER markers of the Vortex MACD script on the price chart, above and below the candles, so they show on every asset, JPY pairs included. No lines: add Vortex MACD as well for the Vortex lines.
Indicators: Vortex Indicator (21) · MACD (12, 26, 9)

- Reversal
- Marker companion
- On price
- Beginner
DeMarker 30 70 Cross Markers
Draws the HIGHER and LOWER markers of the DeMarker 30 70 Cross script on the price chart, above and below the candles, so they show on every asset, JPY pairs included. No lines: add DeMarker 30 70 Cross as well for the DeMarker line.
Indicators: DeMarker (14, levels 30/70)

- Reversal
- Marker companion
- On price
- Intermediate
Double Stochastic Markers
Draws the HIGHER and LOWER markers of the Double Stochastic script on the price chart, above and below the candles, so they show on every asset, JPY pairs included. No lines: add Double Stochastic as well for the four Stochastic lines.
Indicators: Stochastic fast (8, 3, 5) · Stochastic slow (17, 3, 7)

- Reversal
- Marker companion
- On price
- Intermediate
Fisher Transform Reversal Markers
Draws the HIGHER and LOWER markers of the Fisher Transform Reversal script on the price chart, above and below the candles, so they show on every asset, JPY pairs included. No lines: add Fisher Transform Reversal as well for the Fisher lines.
Indicators: Ehlers Fisher Transform (10)

- Reversal
- Marker companion
- On price
- Intermediate
KDJ Cross Markers
Draws the HIGHER and LOWER markers of the KDJ Cross script on the price chart, above and below the candles, so they show on every asset, JPY pairs included. No lines: add KDJ Cross as well for the K, D and J lines.
Indicators: KDJ (9, 3, 3)

- Reversal
- Marker companion
- On price
- Beginner
RSI Law Markers
Draws the HIGHER and LOWER markers of the RSI Law script on the price chart, above and below the candles, so they show on every asset, JPY pairs included. No lines: add RSI Law as well for the RSI line.
Indicators: RSI (5, 30/70)

- Reversal
- Marker companion
- On price
- Intermediate
Three Oscillators Markers
Draws the HIGHER and LOWER markers of the Three Oscillators script on the price chart, above and below the candles, so they show on every asset, JPY pairs included. No lines: add Three Oscillators as well for the lines that count the crossings.
Indicators: RSI (14, 30/70) · CCI (20, +/-100) · Williams %R (14, -80/-20)

- Momentum
- Marker companion
- On price
- Beginner
Double Momentum 20 3 Markers
Draws the HIGHER and LOWER markers of the Double Momentum 20 3 script on the price chart, above and below the candles, so they show on every asset, JPY pairs included. No lines: add Double Momentum 20 3 as well for the two Momentum lines.
Indicators: Momentum (20) · Momentum (3)

- Momentum
- Marker companion
- On price
- Intermediate
Schaff Trend Cycle Markers
Draws the HIGHER and LOWER markers of the Schaff Trend Cycle script on the price chart, above and below the candles, so they show on every asset, JPY pairs included. No lines: add Schaff Trend Cycle as well for the Schaff Trend Cycle line.
Indicators: Schaff Trend Cycle (10, 23, 50)

- Momentum
- Marker companion
- On price
- Intermediate
TSI Signal Cross Markers
Draws the HIGHER and LOWER markers of the TSI Signal Cross script on the price chart, above and below the candles, so they show on every asset, JPY pairs included. No lines: add TSI Signal Cross as well for the TSI and signal lines.
Indicators: True Strength Index (25, 13) · EMA signal (7)

- Momentum
- Marker companion
- On price
- Beginner
Ultimate Oscillator Cross Markers
Draws the HIGHER and LOWER markers of the Ultimate Oscillator Cross script on the price chart, above and below the candles, so they show on every asset, JPY pairs included. No lines: add Ultimate Oscillator Cross as well for the Ultimate Oscillator line.
Indicators: Ultimate Oscillator (7, 14, 28)

- Momentum
- Marker companion
- On price
- Intermediate
Woodies CCI Markers
Draws the HIGHER and LOWER markers of the Woodies CCI script on the price chart, above and below the candles, so they show on every asset, JPY pairs included. No lines: add Woodies CCI as well for the CCI lines.
Indicators: CCI (14) · Turbo CCI (6)
No script matches these filters.
Library pack 2.1.0
One ZIP, all 70 scripts
The pack contains every .lua file, a plain-language README, the MIT license, a machine-readable manifest and SHA-256 checksums. Extract the ZIP before importing a script into IQ Option.
ZIP · 172 KB · iqow-qcs-library-pack-2.1.0.zip
SHA-256: dd450ac605c066b8ecc3161a6098f209091e6617ac9e555b74ebe2f94fe601ca
Install any library script
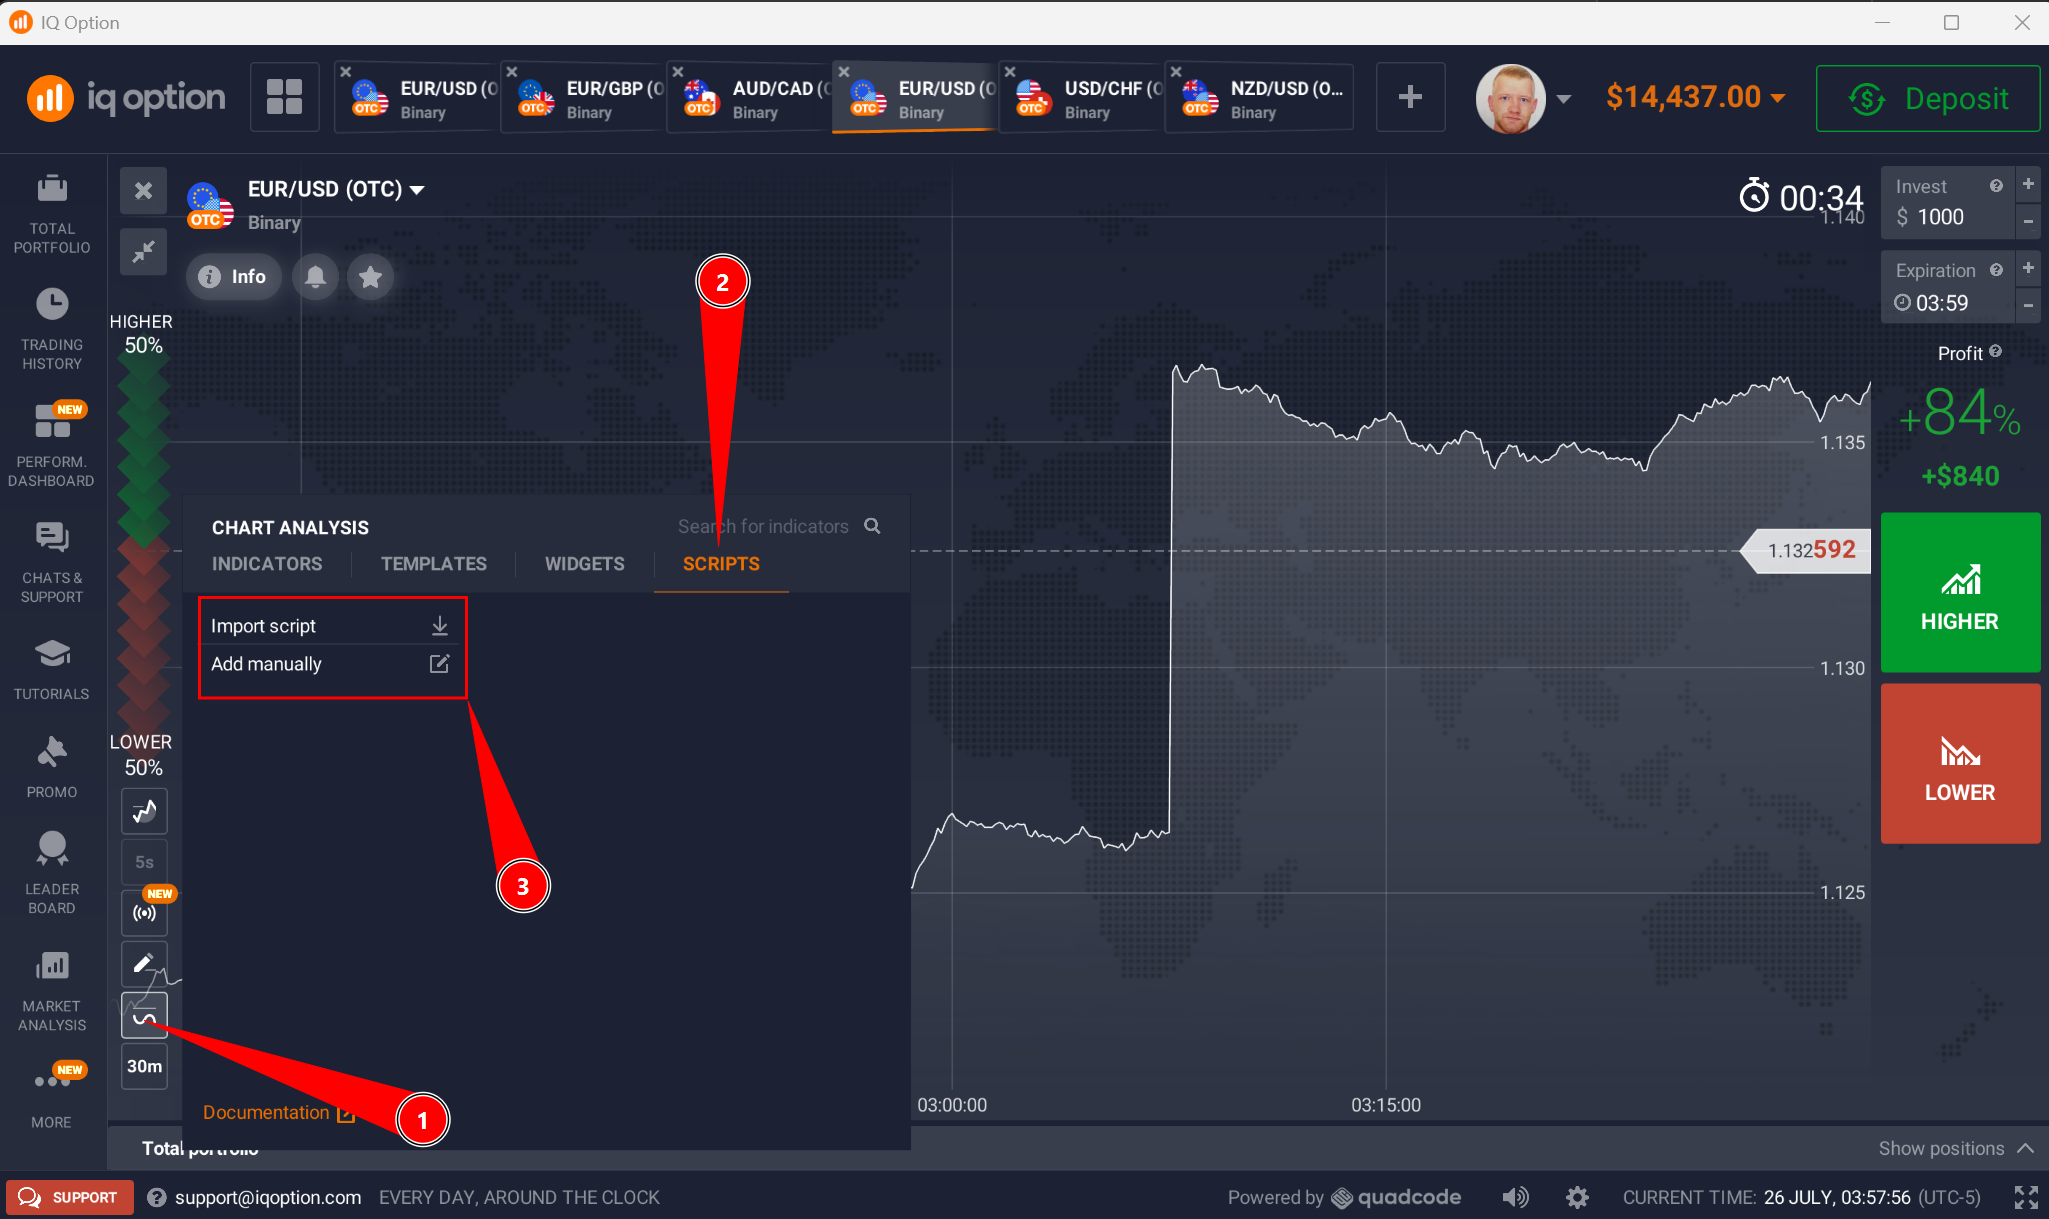
- Download and inspectDownload one .lua file and open it in a plain-text editor if you want to read it first. If you downloaded the ZIP, extract it.
- Open Chart Analysis → ScriptsIn the IQ Option traderoom, choose the Practice balance, open the chart analysis panel, select Scripts and choose Import script.
- Save and add to chartSelect the downloaded file, review the imported code, choose Save, then use the + control to add it to the chart.
- Change one input at a timeConfirm the default view first. Then adjust periods, levels or colours one setting at a time and note what changes.
See the illustrated IQ Option Scripts import guide for manual entry, export, deletion and troubleshooting. Quadcode does not draw plot_shape markers on mobile; use the desktop or web traderoom to see HIGHER and LOWER markers.
How every script is checked
- Plain, readable source code: no installer, no account connection, no credential request and no external data.
- Parsed as Lua 5.3 and compared with Quadcode’s public documentation and built-in indicator sources.
- Executed bar by bar in the IQOptionWiki QCS emulator on five synthetic datasets (trend, range, JPY prices, flat stretches and gaps) to catch runtime errors, missing values and markers that never or always fire.
- Markers are confirmed on the previous completed candle, so an unfinished candle never controls a marker.
- Every download is pinned to the SHA-256 digest shown on its page; a changed file is refused instead of served.
- No script is described as a guaranteed signal, a winning system or permission to risk real funds.
Verification boundary: the emulator is a local test harness, not the Quadcode engine. Indicator seeding can differ slightly from IQ Option’s built-in indicators, platform behaviour can change and account rollout can vary. Import on the Practice balance and compare with the native indicators named on each script page.
References, older packs and license
- Quadcode Script basics
- Quadcode built-in indicator source library
- IQ Wiki Signals V1.1.0 guide
- Illustrated import and troubleshooting guide
Earlier library packs (kept unchanged for reproducibility)
- IQOptionWiki QCS Starter Pack 1.0.0 SHA-256: 39a6478e24bb064bd775b849775ce154f6170bf8793f0912b3bea3407abf1b35
- IQOptionWiki QCS Library Pack 1.0.1 SHA-256: 673a18ca5626b1930966c8ccd4a6dba9829c7df98585f3ab20530ad100b318a3
- IQOptionWiki QCS Library Pack 1.1.0 SHA-256: 85c1f773e864be9d40758ada7eaa0874eafed32136c67dc37323eca3be77e943
- IQOptionWiki QCS Library Pack 2.0.0 SHA-256: 8d1a2f41005515970656247bf050b0f675b4df627fd21c393960439b168db106
- IQOptionWiki QCS Library Pack 2.0.1 SHA-256: 724154b97b1bacbd6333bc0e7139c9794b51bd3b4606d7360129f7ef75c8d5a1
The IQOptionWiki scripts are released under the MIT License and provided “as is”, without warranty. You may read, modify and share them with the license notice intact. IQOptionWiki is independent of the IQ Option platform operator. Nothing in this library is investment advice, a personal recommendation, a probability claim or a guarantee of results.