
Last updated: 8 October 2026. Every screenshot below was recorded on 5 October 2026 on an IQ Option Practice account registered in Brazil. We opened the Chart Grids menu and set up two and four charts; nothing was paid and no order was placed.
Chart grids, also called multi charts, let you see several charts in the IQ Option traderoom at once instead of switching between tabs. You choose a layout from a menu, and each chart in the grid keeps its own asset, indicators and order panel. This guide shows where the menu is, which layouts it offers and what the two- and four-chart views look like.
Quick answer
- Where: the grid button at the top left of the traderoom, next to the IQ Option logo, opens CHART GRIDS.
- Layouts: 1 chart; 2 charts (2 layouts); 3 charts (5 layouts); 4 charts (5 layouts); “More grids” (10 layouts).
- Remember: the menu has the option “Remember the number of charts (the first chart will be active)”.
- Each chart is separate: it has its own asset, tool column and order panel. In our four-chart test they were a Forex CFD, a Blitz option, a Binary option and an OTC Blitz option.
- Practice: we tried the grids on a Practice account.
How to use multi charts on the IQ Option platform
The numbers in each screenshot match the numbers in the text.
Click the grid button at the top left (1), next to the IQ Option logo. CHART GRIDS opens with these layouts (2): 1 chart; 2 charts, two layouts (side by side and stacked); 3 charts, five layouts; 4 charts, five layouts. Under More grids (3) are ten more layouts in two rows. At the bottom is a checkbox (4): “Remember the number of charts (the first chart will be active)”. It was ticked on our account.
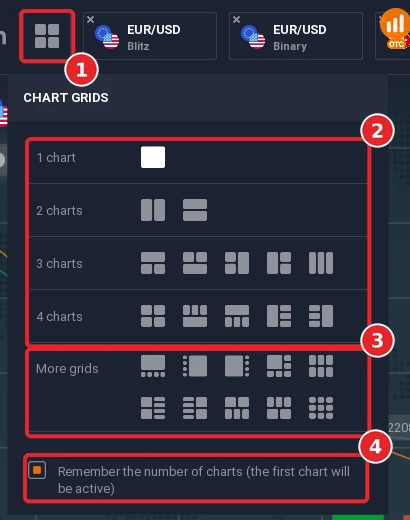
The last layout in More grids is a three-by-three of nine small charts. We did not open it, so we cannot describe how it behaves.
Step 2: Choose two charts
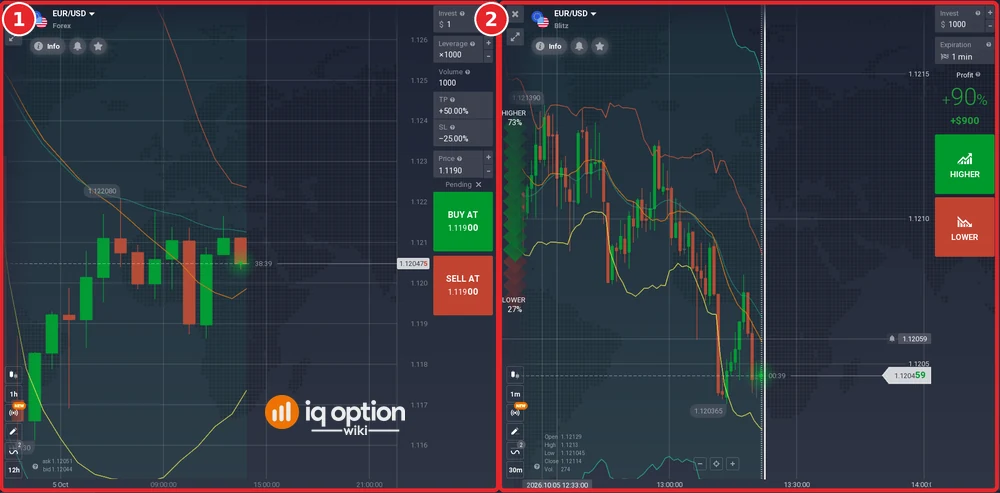
Click the first icon in the “2 charts” row to put two charts side by side. The left chart (1) was EUR/USD Forex with its leverage, take profit and stop loss fields and Buy at and Sell at buttons. The right chart (2) was EUR/USD Blitz with its Expiration field, the profit percentage and the Higher and Lower buttons. Each chart has its own tool column on the left, with its own candle and time buttons: ours showed 1h and 12h on the left chart and 1m and 30m on the right one.
Step 3: Choose four charts
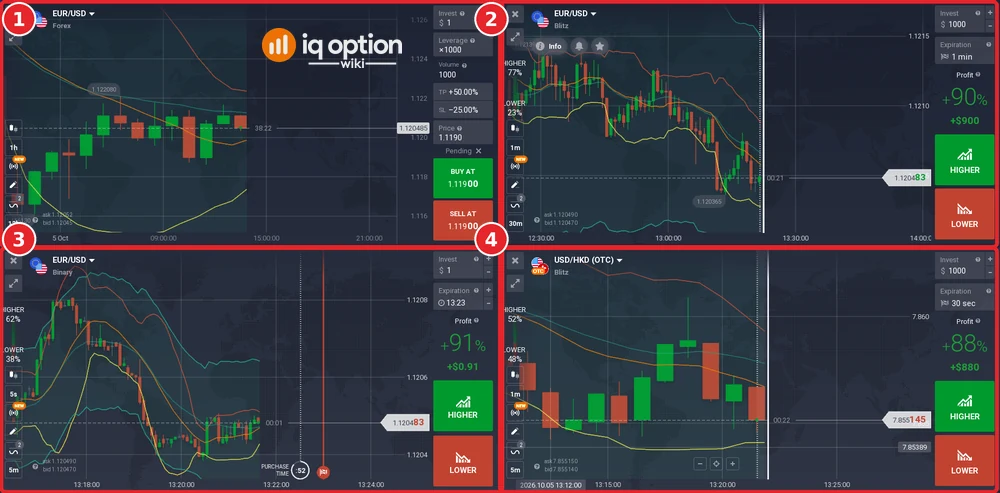
Open the menu again and click the first icon in the “4 charts” row for a two-by-two grid. Ours showed EUR/USD Forex (1), EUR/USD Blitz (2), EUR/USD Binary (3) and USD/HKD (OTC) Blitz (4). They were the four assets open as tabs along the top of the traderoom, and the tabs of the charts on screen were underlined. Every chart kept its own Invest and Expiration (or leverage) fields and its own buy buttons: Binary showed a profit of +91% and the OTC Blitz chart +88% at that moment.
Step 4: Go back to one chart
Open the menu and click the “1 chart” layout. With “Remember the number of charts” ticked, the platform keeps your choice, so check the layout when you return to the traderoom.
Trading many different instruments
A grid is useful when you follow several assets at once, because every price keeps moving on screen. It also shows that the charts are independent: in the four-chart view the Forex chart used leverage and volume, while the option charts used an investment and an expiry. Before you click Buy, Sell, Higher or Lower, check which chart’s panel you are in.
Finding correlations between the markets
Some traders put related assets side by side, for example two currency pairs that share the same base currency, to see whether their moves line up. A grid only shows the charts together; it does not tell you whether a relationship will hold.
Comparing timeframes
Because each chart has its own time buttons, you can also show the same asset on two time frames. In our two-chart test the left chart used 1h candles and the right one 1m. How the buttons work is explained in our time frames guide.
Pros and Cons of Using Multi Charts
| Pros | Cons |
|---|---|
| Several assets or time frames visible at once | More information on screen to follow |
| No switching between tabs to compare charts | Each chart has its own order panel, so check which one you click |
| Each chart keeps its own tool column and indicators | The nine-chart layout is small; we did not test it |
The assets in our test were a Forex CFD, a Blitz option, a Binary option and an OTC Blitz option. The kinds of assets you can open depend on what is available to your account at that moment.
Summary
Chart Grids is the button next to the logo at the top left. It offers layouts from one to four charts plus ten more under More grids, and each chart in the grid is a full chart with its own order panel. Try it on the Practice account first.
Related guides: chart types, chart templates and the interface guide.
Frequently Asked Questions
Q: How do I open several charts on IQ Option?
A: Click the grid button at the top left, next to the logo, and pick a layout in CHART GRIDS.
Q: Which layouts are there?
A: 1 chart; 2 charts (2 layouts); 3 charts (5 layouts); 4 charts (5 layouts); and More grids (10 layouts), as we saw on 5 October 2026.
Q: Can the charts show different kinds of assets?
A: Yes. Our four charts were a Forex CFD, a Blitz option, a Binary option and an OTC Blitz option, each with its own order panel.
Q: Does each chart have its own time frame?
A: Each chart has its own tool column. In our test the Forex chart showed 1h and 12h and the Blitz chart 1m and 30m.
Q: What does “Remember the number of charts” do?
A: The menu describes it as: “Remember the number of charts (the first chart will be active)”. It was ticked on our account.
Q: Can I practise with chart grids without paying?
A: Yes. We used a Practice account, which uses virtual money.

