
Last updated: 8 October 2026. The screenshots below were recorded on 5 and 8 October 2026 on an IQ Option Practice account registered in Brazil, in the English web traderoom. They show the Chart analysis panel and its Scripts tab, the import of one of our library scripts (Donchian RSI Reversal), its code in the built-in editor, the script on the chart and its settings dialog. We placed no real-money trade, and no script in this guide opens a trade.
IQ Option’s web traderoom can run custom indicators written in Quadcode Script (QCS), a language based on Lua 5.3. You open the Scripts tab of the Chart analysis panel, import a .lua or .txt file, save it and add it to the chart like any other indicator. This guide shows how to reach the Scripts tab on the Practice balance, what it offers besides importing, what to check before you run a file, and what to do when it does not work. A script draws on the chart; it does not decide anything for you, and it does not tell you what the next candle will do.
Quick answer
- Where: the indicators button at the bottom left of the chart opens Chart analysis; the Scripts tab sits beside Indicators, Templates and Widgets.
- Files:
.luaor.txtcontaining Quadcode Script, a language based on Lua 5.3. Pine Script and MQL code do not run. - Order: Import script, review the code, Save, then Add to the chart (Quadcode documentation), then adjust the settings.
- First test: on the Practice balance. A script draws on the chart; it does not place trades.
- Library: 56 readable scripts, each with its rule, defaults and source.
What the IQ Option Scripts tab does
The chart toolbar sits at the bottom left of the chart. Its indicators button, the wave icon, opens the Chart analysis panel with the tabs Indicators, Templates, Widgets and Scripts. The Scripts tab offers two actions, Import script and Add manually, and a Documentation link at the bottom of the panel. Your own indicators come from a file you import or from code you write in the built-in editor.
A QCS script receives the chart data and the settings its author exposes, calculates, and draws lines, levels, shapes, fills or candles. A line at the top of the file, the instrument declaration, gives the indicator its name. With overlay = true the plots appear on the price chart; with overlay = false the platform opens a separate panel under it, as it does for the RSI. Inputs written in the code become the controls you see in the indicator’s dialog: periods, colours, line width and the source price.
This is different from installing a browser extension or connecting a bot. A script is a text file that draws on a chart. Every script in our library is a readable chart indicator that marks setups on the chart; none of them opens positions or connects to an account.
The Scripts tab does not convert other languages. Pine Script, MQL, JavaScript and Python code does not run in it, and renaming a file to .lua does not change that: the code itself has to be Quadcode Script.
| Item | What the Scripts tab uses |
|---|---|
| Accepted files | .lua and .txt |
| Language | Quadcode Script, based on Lua 5.3 |
| Where it runs | The IQ Option web traderoom, on the chart you have open |
| First test | The Practice balance |
Before you import a script
- Use the current web traderoom and switch to the Practice balance.
- Check that the file ends in
.luaor.txtand contains QCS code. - Open it in a plain-text editor and read it. A normal indicator has an instrument declaration, calculations, inputs and plotting instructions.
- Keep a clean copy of the download, so that you can compare it with later edits or import it again.
- Know what the indicator is meant to display, and what would make its output misleading.
If you do not see the Scripts tab, reload the traderoom and open Chart analysis again. We have not found out which accounts or regions have it, so we do not claim any.
How to import a custom indicator in IQ Option
The numbers in each screenshot match the numbers in the text. The sequence is: open Chart analysis, choose Scripts, import, review, save if you changed the code, add to the chart. Every step is shown on our own screenshots from the Practice account, with one of our library scripts, Donchian RSI Reversal.
Step 1: Open Chart analysis
Open a chart on the Practice balance, with the asset and candle period you want to try the script on, because the script calculates from the active chart. Click the indicators button (1) at the bottom left of the chart.

Step 2: Select the Scripts tab
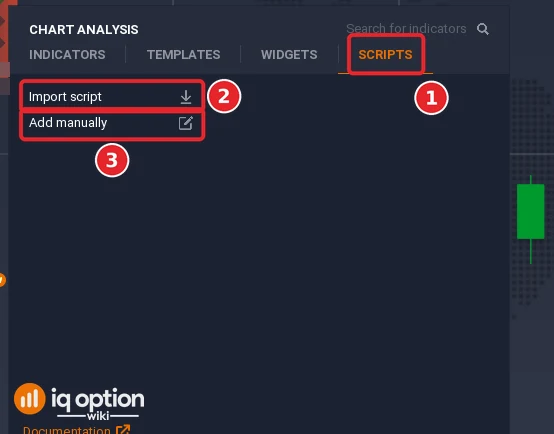
In the panel, click the Scripts tab (1). It sits beside Indicators, Templates and Widgets. The tab shows two actions: Import script (2) for an existing file and Add manually (3) to write code in the built-in editor. Below them is the list of your scripts, empty on our recording because we had none, and at the bottom of the panel a Documentation link.
Step 3: Choose Import script and pick the file
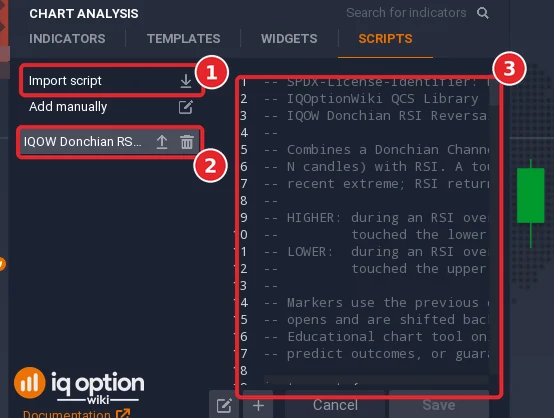
Click Import script (1) and choose a compatible .lua or .txt file from your device. Quadcode describes this as the way to use a script you already have saved on your computer. We imported the library file iqow-donchian-rsi-reversal.lua: it appeared at once as a row in the list (2), named after the script, with an Export icon and a Delete icon, and its code opened in the editor to the right of the list (3).
Step 4: Review the name and the code
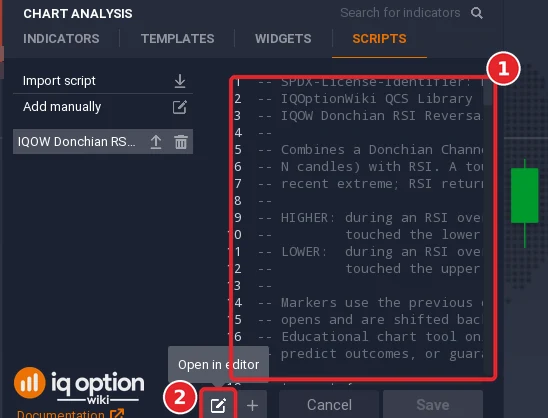
Read the code in the editor (1) before you do anything else. Read the instrument name, check whether it is an overlay or a separate-panel indicator, and look at the input defaults and what it plots. Under the editor are four controls: an icon whose tooltip reads Open in editor (2), an icon whose tooltip reads Add to chart (a plus sign), Cancel and Save. We did not click Open in editor. Do not continue with code you do not understand or do not trust.
Step 5: Save, then add it to the chart
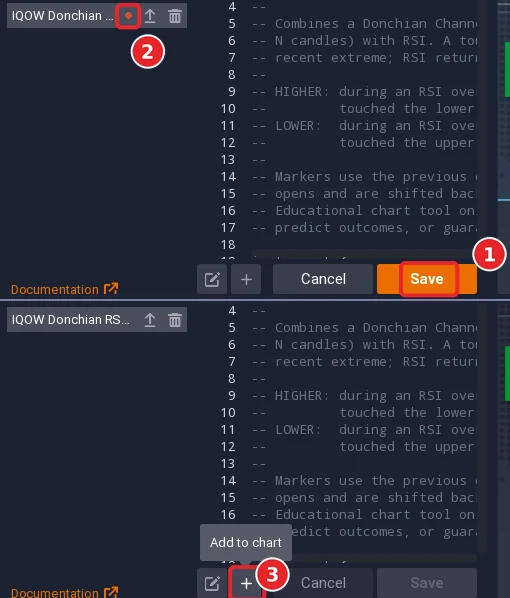
Save stays grey while the code is as imported. When you change the code, Save turns orange (1) and a red dot appears in the script’s row (2). We typed one space in a comment line to see this and then pressed Cancel, which restored the code; we saved nothing. The plus icon, tooltip Add to chart (3), puts the script on the chart. On our imported script it worked without saving first. Quadcode’s “Your First Indicator” page gives the order for a script you write: click Save, then Add to the chart.
Step 6: Check the output and the settings
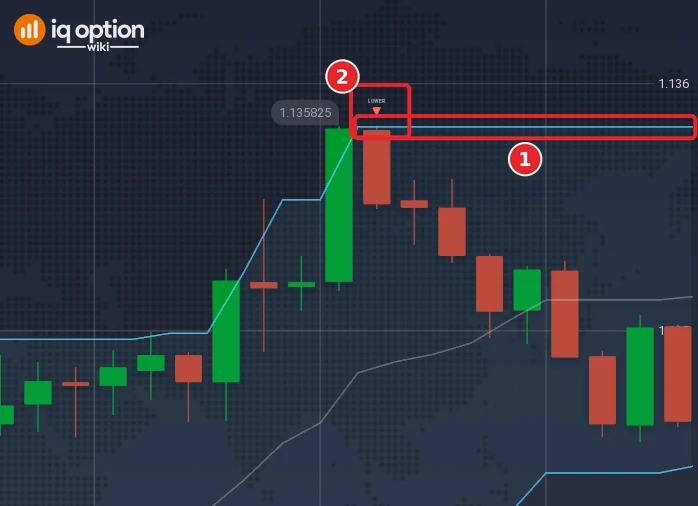
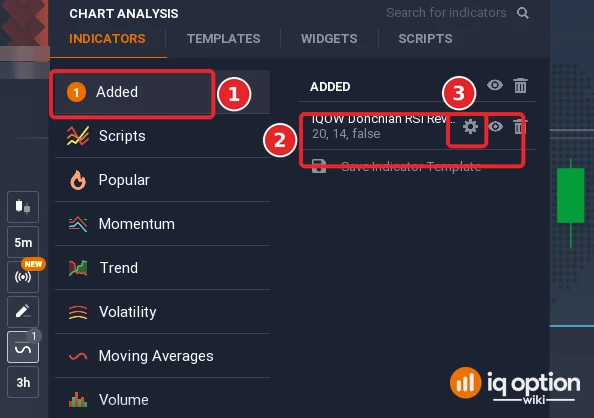
The script’s lines appeared on the chart at once. Donchian RSI Reversal draws an upper and a lower channel line with a grey middle line, and its HIGHER and LOWER markers: the picture shows the upper line (1) and a LOWER marker (2). Confirm that the expected line, band, marker or separate panel appears on your chart. The script is also listed on the Indicators tab, in the Added category (1), with a short summary of its settings, here “20, 14, false” (2), and a gear icon (3).
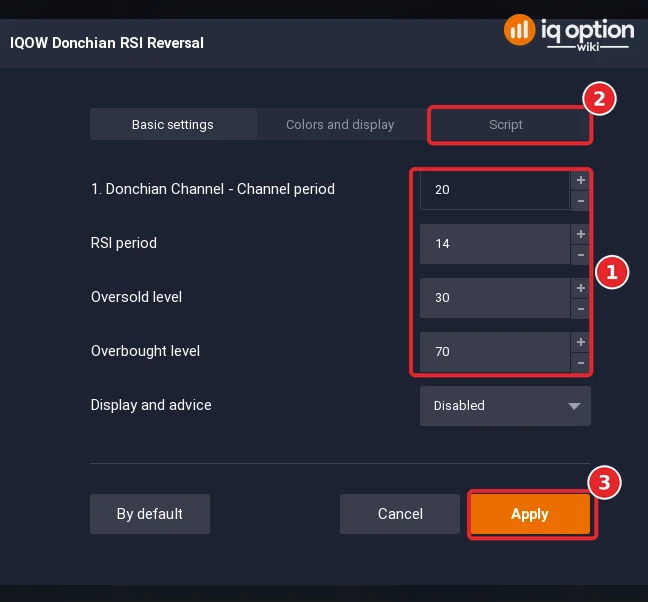
The gear opens the script’s dialog, with the tabs Basic settings, Colors and display and Script. The inputs written in the code appear on Basic settings as fields (1): for this script the Donchian channel period (20), the RSI period (14), the Oversold level (30), the Overbought level (70) and a Display and advice list. The Script tab (2) shows the code. Click Apply (3) after a change, and change one setting at a time during the first test.
Alternative: add script code manually
Click Add manually (1) when you have code to paste or want to write an indicator from scratch. On our recording it added a row called New Indicator to the list at once (2) and opened a sample script in the editor (3): an instrument block with name = 'New Indicator', icon = 'indicators:MA' and overlay = false. Replace or edit the sample code, then Save and add it to the chart as in Steps 5 and 6.
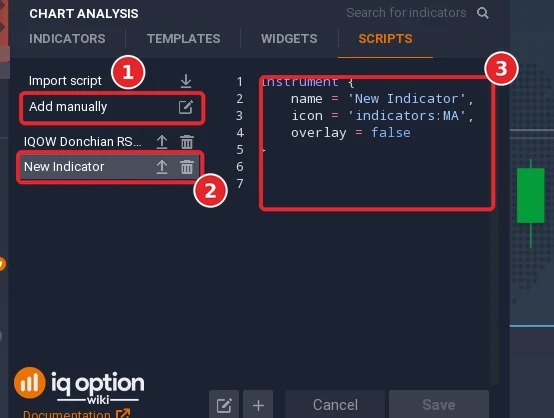
Keep exactly one instrument declaration at the beginning of the file. Give it a clear name, decide whether overlay is true or false, define inputs before you use them, and include at least one plotting instruction if you expect visible output. Quadcode’s documentation, linked below, lists the functions.
Edit and export a saved script
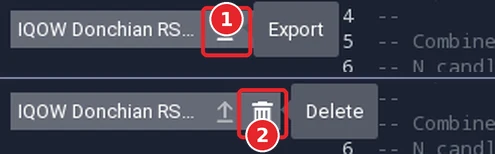
Quadcode’s Script Options page names three ways to work with scripts: Import Script, Add Manually and Export Script. Each row of the list has an Export icon (1) and a Delete icon (2); their tooltips read Export and Delete. Quadcode’s documentation says that to save a script you have created to your computer you click Save, and that the script is then downloaded as a .txt or .lua file. Keep a file like that as your backup before you change the code again. We did not click the Export icon and did not check what a download looks like. The Delete icon removed the script from the list without asking for confirmation, and it also took the script off the chart. We deleted both test scripts, the imported one and New Indicator, at the end of the recording.
Troubleshooting common script problems
- The file does not appear in the picker. Check that it is a plain-text
.luaor.txtfile. Extract a ZIP archive first. A document file such as.docxis not a script. - The editor reports a syntax or unknown-function error. The code may be written for Pine Script, MQL, standard Lua without the QCS functions or another version of the language. Compare the failing line with Quadcode’s documentation, and check quotation marks, commas, braces, parentheses and function names.
- The script saves but nothing appears over the price. Look under the main chart first:
overlay = falsesends the output to a separate panel. Also check that the code draws something, withplot,plot_shape,plot_candle,hlineor another display function, using valid data. - The indicator appears but its first values are blank. An indicator with a lookback period needs enough earlier candles to produce a value. Scroll the chart back or wait for more candles. This is normal for moving averages and volatility indicators.
- The Scripts tab is missing. Reload the traderoom and open Chart analysis again. Do not install an unrelated browser extension that claims to unlock the tab.
A practical script safety checklist
A short text file that you can read is safer than an opaque package. Prefer files from a named source, and avoid installers, browser extensions and macros.
- Read the whole file before you import it. Do not rely on its filename or its description.
- Never type your IQ Option password, a one-time code, payment details or API credentials into a script download page.
- Reject a supposed indicator that arrives as an executable installer or asks you to switch off browser or antivirus protection.
- Test on the Practice balance and compare what it draws with the formula the author describes.
- Treat every indicator as a view of past candles, not as proof of what the next candle will do.
- Keep your decisions about direction, amount and risk separate from what a script draws.
Browse 56 readable IQ Option scripts
Our scripts library holds 56 scripts: the 50 strategy scripts listed in the library catalog and six earlier ones, among them signal engines and simple context indicators. Each strategy script marks a HIGHER or LOWER setup on a completed candle from a combination of IQ Option’s own indicators, and its page gives the exact rule, the default settings, the limitations and the full source. A mark is a condition that appeared on the chart. It is not a prediction, and it is not an instruction to trade.
Popular starting points: Bollinger RSI Reversal, MACD and Parabolic SAR, Donchian RSI Reversal, Supertrend EMA 200 and Ichimoku Kijun Cloud.
Open the IQ Option scripts library
Sources
The Quadcode Script documentation describes the language and the Scripts tab: Script Basics, Script Options and Your First Indicator. The source of IQ Option’s built-in indicators is in the Quadcode Script library on GitHub. IQ Option Wiki is an independent educational site and is not the operator of the IQ Option platform. This guide is educational information, not investment advice or a trading signal.
Related guides
- IQ Option scripts library
- Chart templates on IQ Option
- Too many indicators on your chart
- All indicator guides and all strategy guides
Frequently Asked Questions
Q: What file types can I import in the IQ Option Scripts tab?
A: Files ending in .lua or .txt that contain Quadcode Script code.
Q: Can I import a Pine Script or MQL indicator?
A: Not directly. The Scripts tab runs Quadcode Script only, and renaming the file does not convert the code.
Q: Do scripts place trades?
A: The scripts in our library draw on the chart and nothing else. They do not open positions, and you place every trade yourself.
Q: Where do I find the Scripts tab?
A: Click the indicators button at the bottom left of the chart, and in the Chart analysis panel open the Scripts tab, next to Indicators, Templates and Widgets.
Q: Should I test a script before I rely on it?
A: Read the file, import it on the Practice balance and compare what it draws with the rule its author describes. Even then, a mark on a past candle says nothing certain about the next one.

