Last updated: 8 October 2026. Every screenshot below was recorded on 5 and 8 October 2026 on an IQ Option Practice account registered in Brazil, on EUR/USD candles. We placed no real-money trade. The facts about the indicator come from IQ Option’s own blog and, for the default settings, from the published source code of the platform’s built-in indicators. This guide has no tested box: the examples show how each setup looks on a chart, not how often it works.
The EMA, or exponential moving average, gives more weight to recent prices, so it follows price more closely than a simple moving average does. On IQ Option you add it from the Moving Average indicator by setting its type to EMA. IQ Option’s own blog says that no single indicator suits everyone, so this guide shows how to set the EMA, how it is calculated and two ways of reading it: EMA 14 against EMA 28, and price against EMA 30.
Quick answer
- Add it: indicators button, Chart analysis, Moving Average, then set Type to EMA, choose the period and click Apply.
- What it is: an average that gives bigger weights to recent prices (IQ Option’s blog). The SMA gives every price in the period the same weight.
- Arithmetic: EMA = (price − previous EMA) × k + previous EMA, with k = 2 ÷ (period + 1). The newest price gets 13.3% of the weight at period 14, 6.9% at 28 and 6.5% at 30.
- Two readings in this guide: EMA 14 against EMA 28, and price against EMA 30. Neither is tested here.
- Limit: a moving average is built from past prices, so it lags and cannot predict the direction or the strength of the next move (IQ Option’s blog).
- Which indicator? IQ Option’s blog says there is no single top indicator; the right one fits your strategy, your risk tolerance and your trading style.
What is the best indicator for IQ Option
IQ Option’s blog answers this itself: there is “no single top indicator for trading”, and the right one is the one that “fits your strategy, your risk tolerance, and your trading style” (How to Choose the Right Indicator for Trading?, updated 14 September 2026). IQ Option’s blog also calls the moving average “the most popular technical analysis tool on the IQ Option platform”, and the EMA is one of its types.
So which indicator is best for options trading?
The same blog gives a way to choose, not a name. Match the indicator to your strategy: trend indicators if you trade with the trend, momentum indicators if you trade reversals. Pair a trend indicator with a momentum indicator instead of two indicators that do the same job. Keep to one or two per group so the chart stays readable, and test before you trade real money. In that blog’s grouping the moving average is a trend indicator; on the platform it sits in its own Moving Averages list.
What is the EMA (Exponential Moving Average)?
A moving average is a line that shows the average price over a chosen number of candles. It updates with every new candle: new prices enter the calculation and old ones leave it, which smooths the chart and makes the direction easier to read. IQ Option’s blog names four types: the simple moving average (SMA), the weighted moving average (WMA), the exponential moving average (EMA) and the smoothed simple moving average (SSMA). The SMA gives every price in the period the same weight. The EMA gives bigger weights to recent prices, so it reacts faster. An IQ Option blog article names the cost: of the types it compares, the EMA follows price most closely and also gives the highest number of false signals, unless you have a method of sorting them out.
The Construction and Arithmetic of the EMA
Each new EMA value blends the latest price with the previous EMA value:
EMA = (price − previous EMA) × k + previous EMA, where k = 2 ÷ (period + 1)
“Price” is the candle price the indicator uses (the closing price in the Source setting that the platform’s other average dialogs show; the Moving Average dialog has no Source box) and the period is the number you enter in the dialog. A shorter period gives a larger k, so each new price moves the line more. Unlike the SMA, the EMA never drops an old price completely: it only gives it less and less weight. For the periods used in this guide about 86.5% of the total weight sits on the latest N candles and the other 13.5% on older ones. The table is plain arithmetic from the formula.
| Average | Weight of the newest price | Share of the total weight on the latest N candles |
|---|---|---|
| SMA 14 | 7.1% | 100% |
| EMA 14 | 13.3% | 86.5% |
| EMA 28 | 6.9% | 86.5% |
| EMA 30 | 6.5% | 86.5% |
The period counts candles, not days or minutes. For an EMA 30, about 86.5% of the weight sits on the latest 30 candles, whatever their size, and the rest on older ones.
Indicator Types Overview
The Chart analysis panel lists indicators in groups: Added and Popular, then Momentum, Trend, Volatility, Moving Averages, Volume and Other. IQ Option’s blog on indicator types describes the groups as in the table. The EMA belongs to Moving Averages.
| Group | What IQ Option’s blog says about it | Examples the blog names |
|---|---|---|
| Momentum | Good at identifying rapid price movements; can hint at a possible trend reversal. | Aroon Oscillator, Balance of Power, Center of Gravity, Detrended Price Oscillator, True Strength Index, Williams %R, Woodies CCI |
| Trend | Trend-following indicators can help get rid of the price noise. | Aroon, Average Directional Movement Index, Commodity Channel Index, Darvas Box, Mass Index, McGinley Dynamic, Trend Intensity Index |
| Volatility | Volatility is a measure of the speed of the price change. | Average True Range, Bollinger Bands, Chaikin Volatility, Donchian Channels, Historical Volatility, Standard Deviation |
| Moving Averages | They smooth out the price chart and make the trend more obvious and easier to spot. | Arnaud Legoux Moving Average, Kaufman’s Adaptive Moving Average, Least Squares Moving Average, Rainbow Moving Average |
| Volume | Volume represents the number of deals executed at a given moment of time. | Accumulation/Distribution, Net Volume, Volume Oscillator, Weis Wave Volume |
| Other | Indicators that do not fit the groups above. | Bollinger Bands Width, Chande Kroll Stop, Coppock Curve, Fractal, High-Low, Highest High, Lowest Low |
Our guides to ALMA and LSMA and to Moving Average Deviation cover three more members of the Moving Averages group.
Guide to trading using the EMA indicator on IQ Option
The EMA is a trend-following indicator: it smooths the price into one line that follows the trend. The first part of this guide adds it to the chart. The second part reads two setups. Both are ways of reading a chart. Neither is a signal that a trade will win: IQ Option’s blog says a moving average is built from past prices, so it cannot predict the direction or the strength of the next move.
If you only want two EMAs and the gap between them in one tool, the script library has IQOW EMA Trend Ribbon. It plots a fast and a slow EMA (defaults 9 and 21) and shades the space between them. It places no trades and gives no signals.
Setting up the EMA indicator on IQ Option
These steps use the web traderoom on a Practice balance. The numbers in each screenshot match the numbers in the text.
Step 1: Open Chart analysis
Click the indicators button (1), the wave icon in the chart toolbar at the bottom left of the chart. The Chart analysis panel opens with the tabs Indicators, Templates, Widgets and Scripts. Stay on Indicators.

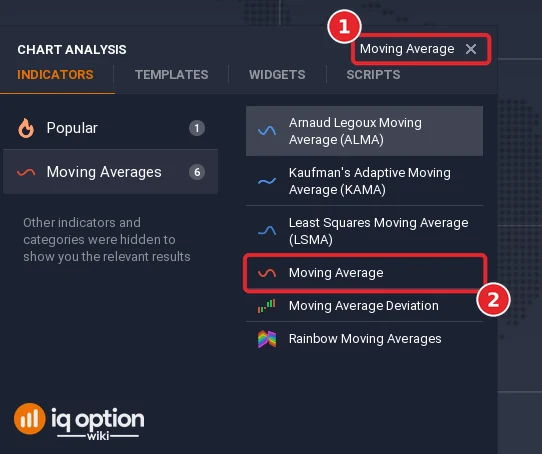
Step 2: Find the Moving Average indicator
The EMA is a type of the Moving Average indicator. Type “Moving Average” in the Search for indicators box (1) and click Moving Average (2). You can also open the Moving Averages list and click it there.
Step 3: Set the type to EMA and check the period
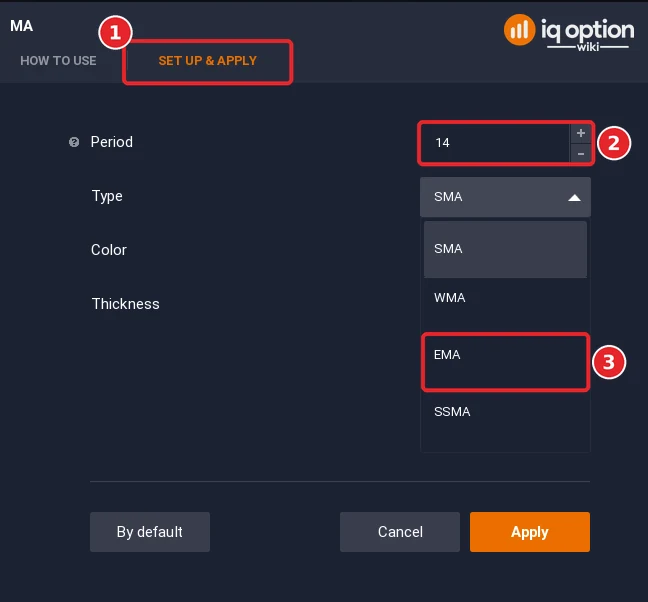
The dialog has two tabs, How to use and Set up & apply. Open Set up & apply (1). It shows four settings on one page: Period, Type, Color and Thickness. The period box (2) opens at 14. The Type list (3) opens at SMA: open it and choose EMA.
Step 4: Choose a colour and click Apply
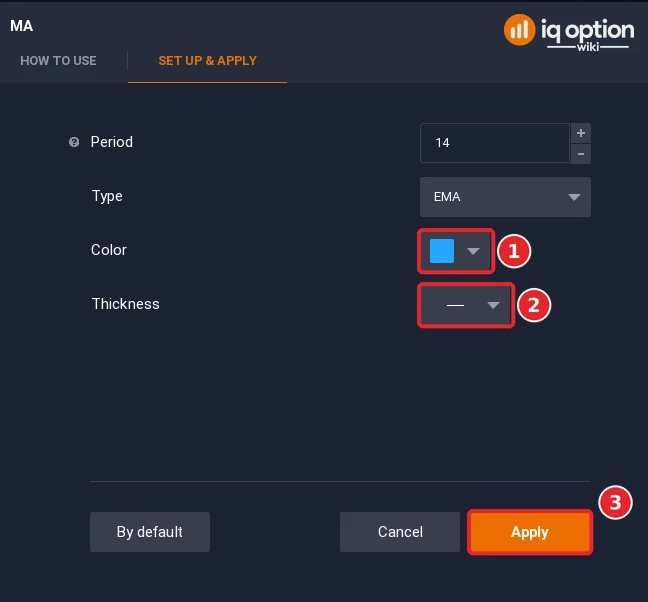
Open the Color list (1) and pick a line colour that stands out from the candles; this guide uses blue for the EMA 14 and yellow for the EMA 28. You can also change the line thickness (2). Click Apply (3).
Step 5: Add the second EMA with period 28
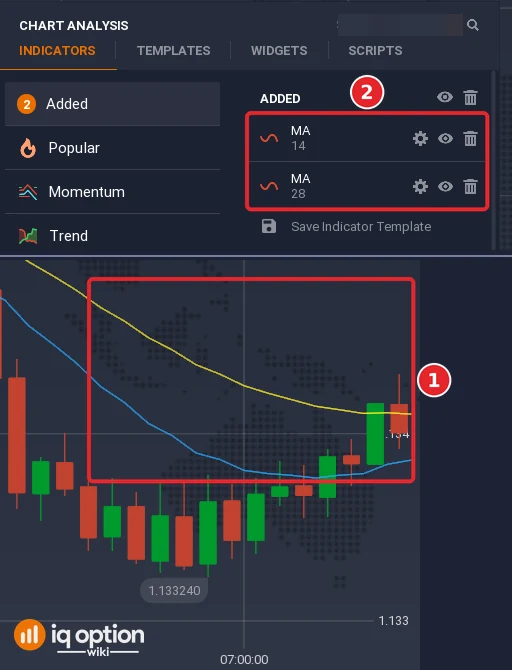
Repeat steps 1 to 4 for a second Moving Average: type EMA, period 28, colour yellow. Both lines now show on the chart (1): the blue EMA 14 follows price more closely and the yellow EMA 28 is smoother. The Added list in Chart analysis (2) shows the two Moving Average entries.
Step 6: Choose the candle size
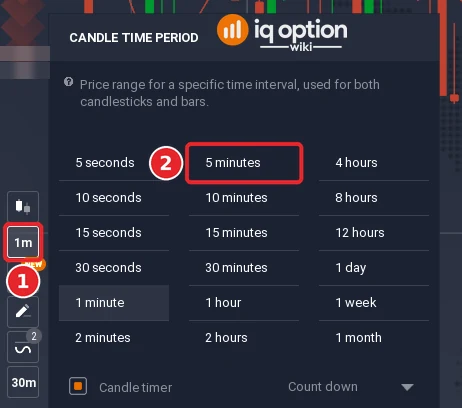
The period counts candles, so the candle size changes what the lines mean. An EMA 14 mainly reflects the last 14 candles: 14 minutes on one-minute candles and 70 minutes on five-minute candles. Click the candle time period button (1) in the chart toolbar and choose a size (2). The examples below use 5-minute candles.
Pros and Cons of EMA Indicator
| Pros | Cons |
|---|---|
| It follows price more closely than the SMA, because recent prices get bigger weights (IQ Option’s blog). | It is built from past prices, so it lags. IQ Option’s blog says a moving average cannot predict the direction or the strength of the next move. |
| It is one line with few settings: type, period, colour and thickness. | An IQ Option blog article says the EMA gives the highest number of false signals of the averages it compares, unless you have a method of sorting them out. |
| The period counts candles, so the same setting can be put on any asset’s chart and any candle size. | When price crosses the line again and again, the market has no clear direction and a single crossing says little (IQ Option’s blog). |
| It can be paired with an indicator from another group, such as an oscillator, which IQ Option’s blog prefers to several indicators of the same kind. | Choosing the period takes testing. No source recommends one period over the others, and the same period means something different on each candle size. |
Trading IQ Option using EMA14 and EMA28
The Significance of the 14-Period EMA and 28-Period EMA
What can be said about the 14-period and the 28-period EMA is arithmetic. The 14 EMA gives the newest price about twice the weight of the 28 EMA (13.3% against 6.9%), so it follows price faster, and the 28 EMA is the smoother line. IQ Option’s blog on the moving average bounce says that in general the higher the period, the smoother the line. The blog uses other pairs too: 14 and 100 in its Double Moving Averages article, 15 and 30 in its article on EMA crossovers. No source shows that one pair is better than another.
The buy and sell readings are tied to a cross: a buy once the EMA 14 has crossed above the EMA 28 and the gap keeps widening, a sell once it has crossed below. In a table:
| What the chart shows | Reading |
|---|---|
| EMA 14 above EMA 28, price above both lines and the gap between the lines widening | Uptrend. Open a buy (on a binary option, a Higher option). |
| EMA 14 below EMA 28, price below both lines and the gap between the lines widening | Downtrend. Open a sell (on a binary option, a Lower option). |
| Both lines run through the candles and keep crossing | A ranging market. Stay out and wait for a trend. |
- “Wide”: no number is given for a wide gap, so you judge it by eye. This guide does not invent one.
- Candle size and expiry: the readings name neither. A binary option closes at its expiry, so you must choose one; see the expiry guide. A margin (CFD) trade has no expiry, but it has a stop loss and a take profit.
- A narrowing gap: the gap narrows whenever the fast line slows against the slow line. We found no source that ties it to the end of a trend, so treat it as a description, not a signal.
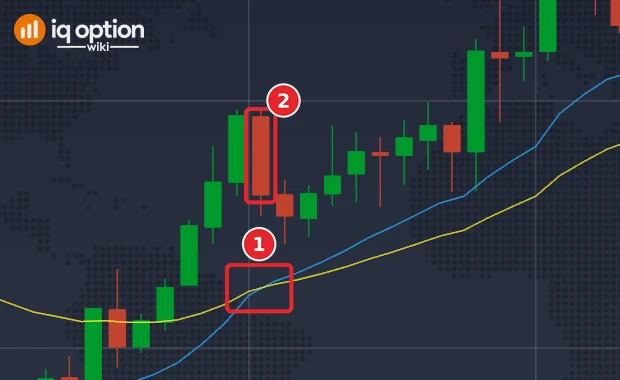
Buy reading. The chart is EUR/USD with 5-minute candles. On the candle that opened at 08:00 on 29 September 2026 on the platform clock (11:00 UTC), the blue EMA 14 moved above the yellow EMA 28 (1). In a replay of the recorded candles the EMA 14 stood at 1.134267 and the EMA 28 at 1.134256, a gap of 0.11 pips. The candle closed at 1.13462 (2), above both lines. The gap then widened to 0.27 pips on the next candle and 0.46 pips on the one after, which is the widening gap that the reading asks for. It is the first buy cross in the recorded series (from 29 September). We did not open an option here, so no outcome is claimed.
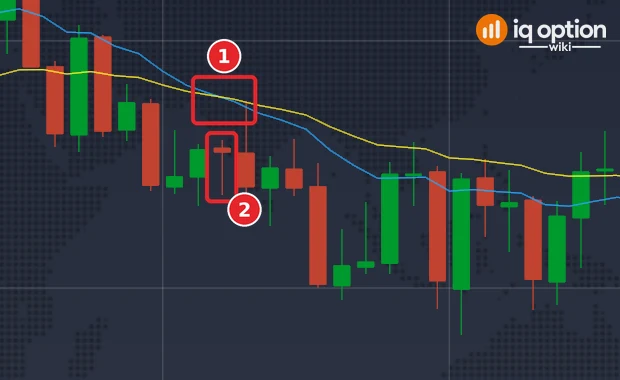
Sell reading. On the candle that opened at 10:10 on 29 September 2026 on the platform clock (13:10 UTC), the blue EMA 14 moved below the yellow EMA 28 (1). In the replay the EMA 14 stood at 1.134754 and the EMA 28 at 1.134764 (gap -0.10 pips); the candle closed at 1.13455 (2), below both lines. The gap was -0.31 pips on the next candle and -0.43 pips on the one after. It is the first sell cross in the recorded series. The two lines had been close together for some time before it, which is the flat, crossing look that the table above calls a ranging market. No outcome is claimed.
This guide does not test either reading. The examples show what the setup looks like on one chart; they do not show how often it works, and a few examples never could. IQ Option’s blog on backtesting says most strategies need dozens and often hundreds of trades before a result means anything, and that rules must stay fixed during a test. If you test the setup yourself, fix the candle size, the expiry and your own definition of a wide gap before you start.
Trading IQ Option using the EMA30
The second reading uses one line, the EMA with period 30, against price. Add it as in steps 2 to 4 with the type set to EMA and the period set to 30. It is read like this:
| What the chart shows | Reading |
|---|---|
| The EMA 30 slopes up and price stays above it | An uptrend reading. |
| The EMA 30 slopes down and price stays below it | A downtrend reading. |
| A bullish candle closes above the EMA 30 after closing below it, so the line now runs below the candles | The entry point for a buy. |
| A bearish candle closes below the EMA 30 after closing above it, so the line now runs above the candles | The entry point for a sell. |
| Price touches the EMA 30 from above and rises again, or touches it from below and falls again | The line is acting as dynamic support or resistance. |
IQ Option’s own article on EMA crossovers says that a simple price crossover of a 30 EMA is not enough to trigger an entry on its own, and uses a shorter EMA as a signal line instead. Read the price-crossing rule above as a reading aid, not as a complete system. A bullish candle is one that closes above its open and a bearish candle one that closes below it.
What do the sources say about the 30-period EMA?
We found no figure for how often traders use the 30-period EMA, so this guide does not claim that it is common. What the sources say is this. IQ Option’s blog groups periods of 20, 30 and 50 as medium-term settings that balance speed and stability. Another article of its blog uses a 30-bar EMA as the base line and a 15-bar EMA as a signal line, and treats the crossing of the two as the entry signal. A longer period does give a smoother line, which also means a later one.
Usage of the 30-Period EMA in Trading
IQ Option’s blog describes three uses of a moving average that apply to the EMA 30:
- Trend direction. When the line slopes up the market often follows an uptrend, and when it slopes down a downtrend. A flat slope points to a weak or sideways market, and repeated crossings by price mean the market has no clear direction.
- Entry timing. The blog’s 50-period EMA article treats the first candle that closes beyond the line after a cross as the confirmation: a buy once the first green candle closes above the line, a sell once the first red candle closes below it. That is the same idea as waiting for the close in the table above.
- Support and resistance. In an uptrend price may pull back to the line before moving higher again, and in a downtrend it may rise to the line before moving lower. Traders use these pullbacks for entries.
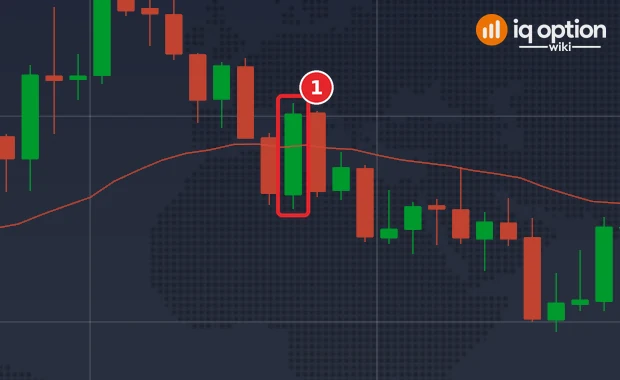
Buy reading. The chart is EUR/USD with 5-minute candles and a single EMA 30. The candle that opened at 09:40 on 29 September 2026 on the platform clock (12:40 UTC) is bullish and closed at 1.13501 (1), above the EMA 30 at 1.13486, after the previous candle had closed at 1.134625, under the line (EMA 1.13485). By the table’s wording that is the entry point for a buy. Five minutes earlier the line had been crossed the other way (see the sell reading below), and five minutes later a bearish candle closed under it again at 1.134635. So the line was crossed three times in ten minutes, which is the repeated crossing that the guide reads as a market without a clear direction. No outcome is claimed.
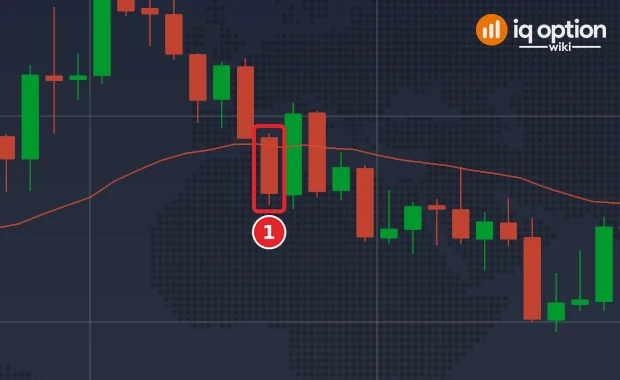
Sell reading. The candle that opened at 09:35 on 29 September 2026 on the platform clock (12:35 UTC) is bearish and closed at 1.134625 (1), under the EMA 30 at 1.13485, after the previous candle had closed at 1.134895, above the line (EMA 1.134865). By the table’s wording that is the entry point for a sell. The next candle closed back above the line, so a trader who acted on the rule would have had the opposite signal five minutes later. We did not open an option here, so no outcome is claimed.
A move of price through the line is where the reading changes, nothing more. It is not a signal that the trend is reversing: a moving average cannot predict a reversal, and a price that keeps crossing the line means there is no clear trend to reverse.
And what is your best indicator for IQ Option?
The sources give the same answer as at the top: the one that fits your strategy and that you have tested before you risk money. A moving average is a lagging indicator, which means it relies on past prices and reacts with a delay. That does not disqualify it, but you must keep it in mind (see also leading and lagging indicators).
A fair test of any EMA rule is plain. Write the rule down, choose one candle size and one expiry, run it on the Practice balance for many trades and compare the win rate with the break-even rate. At an 85% payout a trade needs to win more than 54% of the time (1 ÷ 1.85); at 87%, 53.5%. IQ Option showed payouts of 82% to 91% on options between 2 and 4 October 2026, so read the payout on the trade ticket when you trade.
Training Resources for Mastering the EMA Indicator
These are sources you can check:
- IQ Option’s blog articles used for this guide, all updated in September 2026: “What is Moving Average and How it Use it?”, “Double Moving Averages — Combining For Enhanced Results”, “The Power of Crossovers: EMA Trading Techniques”, “The 50-Period Moving Average — How to Use It?” and “How to Choose the Right Indicator for Trading?”.
- Our own guides: moving average on IQ Option, the simple moving average, a well defined EMA strategy and identifying a trend.
- The Practice balance: it holds $10,000 and has a Refill to $10,000 button, so you can test every setting there without risking real money.
Common mistakes with the EMA
- Too many lines. IQ Option’s blog says two or three moving averages are usually enough; more lines overlap and make the signals unclear.
- Using a crossover as the only signal. It can come late or be false in slow markets, so the blog asks for extra confirmation.
- Trading against the trend because price touched the line. The blog lists this as a common mistake: check the overall direction first.
- Comparing the same period on different candle sizes. The candle size decides what the period covers.
- Reading the EMA as a forecast. The blog is clear that moving averages do not predict future prices; they smooth past data and show the current direction.
Related guides
- Moving average on IQ Option and the simple moving average
- 1-minute binary options strategy with SMA 8/21 and SMA 4 and SMA 30: a 5-minute strategy
- ADX and EMA 28 strategy, EMA and CCI strategy and EMA and Momentum strategy
- MACD, Parabolic SAR and EMA strategy
- Time frames on IQ Option, Japanese candlesticks and expiry times
- IQOW EMA Trend Ribbon script in the script library
- All indicator guides and all strategy guides
Frequently Asked Questions
Q: How can I use the EMA indicator to identify trends?
A: Look at the slope of the line and at where price sits. IQ Option’s blog says that when a moving average slopes up the market often follows an uptrend, when it slopes down a downtrend, and a flat slope signals a weak or sideways market. Price that stays above the line points to a bullish structure and price that stays below it to a bearish one.
Q: What is the difference between the EMA and the Simple Moving Average (SMA)?
A: The SMA gives every price in the period the same weight. The EMA gives bigger weights to recent prices, so it follows price faster and, according to an IQ Option blog article, also gives more false signals unless you filter them.
Q: How can I identify trend reversals using the EMA indicator?
A: A move of price through the line is where the reading changes, but it does not prove a reversal. IQ Option’s 50-period EMA article waits for the first candle that closes beyond the line. Its crossover article says a simple price crossover is not enough on its own, and when price crosses the line repeatedly there is no clear direction.
Q: Which time frames suit the EMA indicator on IQ Option?
A: No source names one time frame as better than the others. The period counts candles, so an EMA 30 averages 30 one-minute candles on a one-minute chart and 30 days on a daily chart. IQ Option’s blog says a 50 EMA on daily candles may suit longer-term trading and on hourly candles an intraday strategy.
Q: Which EMA period should I use?
A: IQ Option’s blog groups 5, 9 and 10 as short-term periods, 20, 30 and 50 as medium-term and 100 and 200 as long-term, and says the choice depends on your trading style. Short periods react fast and can produce more noise; long periods react slowly. No source names one period as better than the others.
Q: Can I use the EMA indicator with other technical indicators?
A: Yes. IQ Option’s blog pairs moving averages with RSI, MACD, ATR and support and resistance, and prefers indicators from different groups to several of the same kind. Test any combination on the Practice balance before you rely on it.
Q: Is the EMA the top indicator for IQ Option?
A: IQ Option’s blog says there is no single top indicator: the right one is the one that fits your strategy, your risk tolerance and your trading style.
Q: Can I add two EMAs as one script?
A: The script library’s IQOW EMA Trend Ribbon plots a fast and a slow EMA (defaults 9 and 21) and shades the gap between them. It gives no signals. Import it as shown in our scripts guide.