Last updated: 8 October 2026. Every screenshot below was recorded on 8 October 2026 on an IQ Option Practice account registered in Brazil, on one-minute EUR/USD candles. We placed no real-money trade. The tested box shows what each rule did on the candles of 2 to 5 October 2026; it says nothing about what the rules will do next.
The 1-minute SMA 8/21 strategy puts two simple moving averages on a one-minute chart and reads the trend from them: while the 8-period average is above the 21-period average the trend is up, and while it is below, the trend is down. The strategy’s entry is a pull-back against that trend, traded with a one-minute expiry. This guide shows how to set the two lines on IQ Option’s current platform, how the entry works, and what each rule did when we ran it on EUR/USD candles.
Video tutorial
Quick answer
- Indicator: Moving Average, type SMA, once with period 8 and once with period 21 (a new Moving Average starts with period 14 and type SMA).
- Chart: one-minute candles, one-minute expiry.
- Trend: SMA(8) above SMA(21) is an uptrend, below it a downtrend.
- Entry as tested: in an uptrend, the first candle that closes below both lines opens Higher; in a downtrend, the first candle that closes above both lines opens Lower.
- Test result: on 1,505 one-minute EUR/USD candles (about 25 hours, 2 to 5 October 2026) the pull-back rule fired 108 times and won 62 of 106 decided trades (58.5%) against a break-even of 54.1% at an 85% payout; the close cross won 43.5% and the two-average cross 42.9%. A replay this short predicts nothing. With 106 trades the win rate has a margin of error of about ±5 points (one standard error), so 58.5% cannot be told from break-even.
The classic interpretation of moving averages
A simple moving average (SMA) is the plain average of the last N closing prices. The SMA(8) is the average of the last eight closes and the SMA(21) the average of the last 21, so the SMA(8) follows price quickly and the SMA(21) follows it more slowly. IQ Option’s platform lists several types of moving average under one Moving Average indicator; this strategy uses the simple one. There are two classic ways to read the lines.
The closing price crosses the moving average
The simplest reading is a buy signal when a candle closes above the moving average and a sell signal when it closes below. It gives many false signals, because price crosses an average back and forth whenever the market moves sideways. In our replay on one-minute EUR/USD candles it fired 165 times and won 70, lost 91 and tied 4, a win rate of 43.5% of decided trades, well below the 54.1% that a one-minute option needs to break even at an 85% payout.
Using 2 moving averages to generate trading signals
The second reading uses two averages with different periods. The signal to buy is when the fast average crosses above the slow one, and the signal to sell is when it crosses below. In the same replay it fired 79 times and won 33, lost 44 and tied 2, a win rate of 42.9% of decided trades. It fires less often than the close cross, and it also stayed below break-even.
How to add SMA 8 and SMA 21 to the IQ Option chart
These steps use the web traderoom on a Practice balance. The numbers in each screenshot match the numbers in the text.
Step 1: Open Chart analysis
Click the indicators button (1), the wave icon at the bottom left of the chart. The Chart analysis panel opens with the tabs Indicators, Templates, Widgets and Scripts.

Step 2: Find the Moving Average indicator
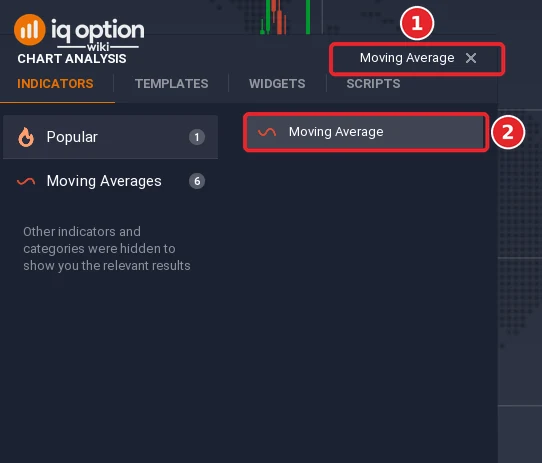
Click the search box (1), type Moving Average and click the Moving Average result (2). A dialog titled MA opens.
Step 3: Set the type to SMA and the period to 8
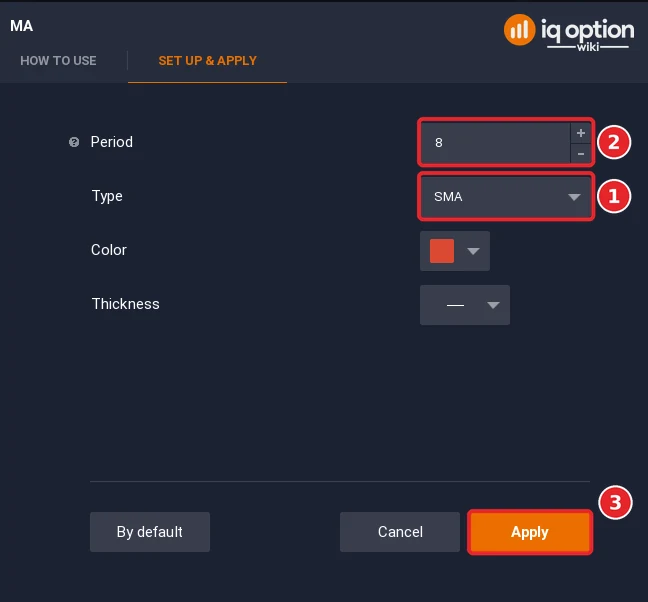
The dialog opens on its Set up & apply tab with Period 14 and Type SMA. Leave the type on SMA (1), set the period to 8 (2) and click Apply (3). The new line is red.
Step 4: Add the second average with period 21
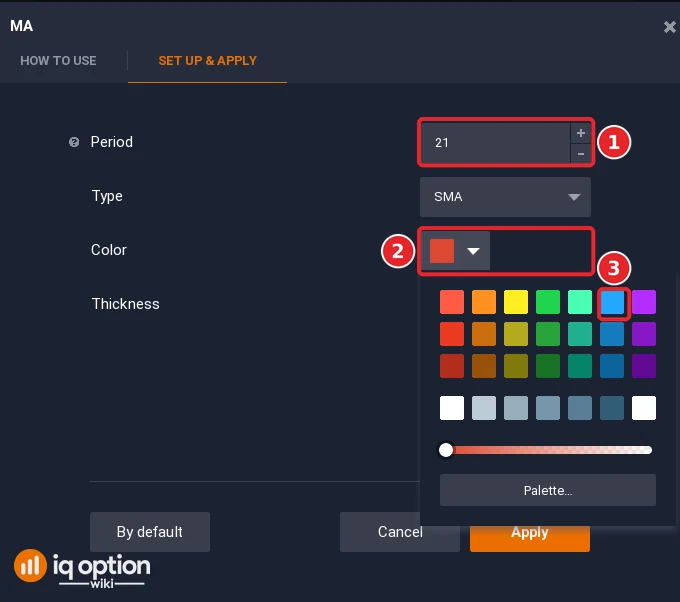
Add a second Moving Average the same way. Set the period to 21 (1) and keep the type on SMA. A new Moving Average is red again, so open the Color list (2) and choose a blue swatch (3) to tell the two lines apart, then click Apply.
Step 5: Use one-minute candles
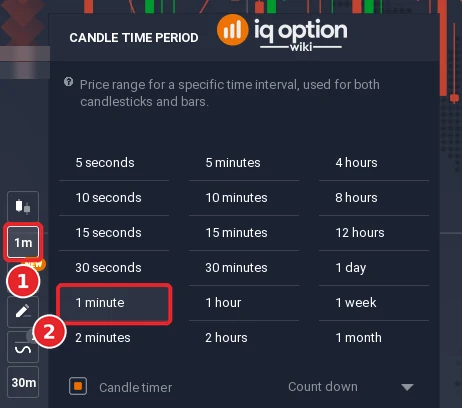
Click the candle time period button at the bottom left of the chart (1) and choose 1 minute (2). The menu lists periods from 5 seconds to 1 month.
Step 6: Read the trend
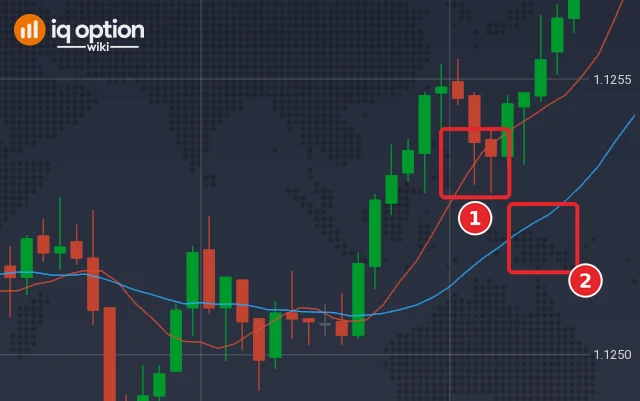
Both lines are now on the chart. The red SMA(8) (1) is the faster line and the blue SMA(21) (2) the slower one. When the red line is above the blue line the trend is up, and when it is below the trend is down. In this screenshot the red line is above the blue line at the right edge, so the trend is up there.
Binary options strategy for 1-minute binary options using SMA(8) and SMA(21)
The strategy trades with the trend, but it does not enter when the trend is just running. It waits for a pull-back, a candle that closes on the wrong side of the averages, and enters the way the trend points. The idea is to buy a dip in an uptrend and sell a rally in a downtrend, so you enter at a price that is cheap or expensive relative to the trend. The test below reads the rule like this:
- Uptrend, open Higher: the SMA(8) is above the SMA(21) and a candle closes below both lines for the first time after the price was above them.
- Downtrend, open Lower: the SMA(8) is below the SMA(21) and a candle closes above both lines for the first time after the price was below them.
- Expiry: one minute, entered at the close of that candle.
A binary option has no stop loss and no take profit: it closes at the expiry time, and you can only decide direction and stake.
Opening positions for price decreases
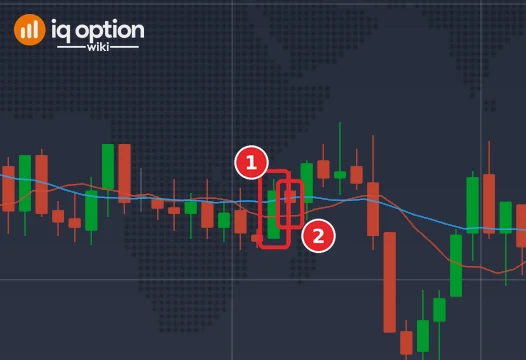
On 2 October 2026 at 18:47 UTC (15:47 on the platform clock, which is UTC-3) the SMA(8), 1.125115, was below the SMA(21), 1.125146. The candle marked (1) closed at 1.12516, above both lines, after the candle before it had closed below them, so the rule gave Lower with entry at that close. One minute later the next candle (2) closed at 1.12514, below the entry, so that trade would have won. The two lines were only 0.00003 apart, which shows how little a trend filter says in a flat market. The next signal, Lower at 18:49 UTC, also won.
Opening positions for price increases
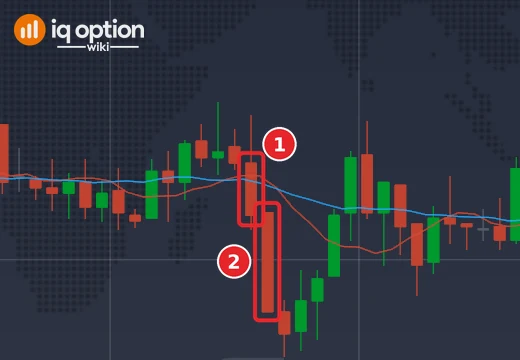
At 18:53 UTC (15:53 platform clock) the SMA(8), 1.125152, was above the SMA(21), 1.125139. The candle marked (1) closed at 1.12508, below both lines, after the candle before it had closed above them (1.125175), so the rule gave Higher with entry at 1.12508. The next candle (2) closed at 1.124905, below the entry, so that trade would have lost. The next Higher signal of the series, at 19:05 UTC, lost as well. The examples are the first signals of each direction in time order, not selected by outcome.
Tested on IQ Option: 2 to 5 October 2026
| Asset and candles | EUR/USD (binary), one-minute candles recorded from IQ Option’s Practice traderoom, from 2 October 2026 18:23 UTC to 5 October 2026 19:29 UTC: 1,505 candles in two unbroken runs (Friday evening, then Sunday evening to Monday), about 25 hours. |
|---|---|
| Rules tested | All three use simple moving averages of the close. 1. Close cross: Higher when a candle closes above the SMA(21) after the previous candle closed at or below it; Lower for the mirror. 2. Two-average cross: Higher on the candle where the SMA(8) crosses above the SMA(21); Lower when it crosses below. 3. Pull-back (the strategy’s entry): while the SMA(8) is above the SMA(21), the first candle that closes below both lines opens Higher; while the SMA(8) is below the SMA(21), the first candle that closes above both lines opens Lower. Entry at the close of the signal candle, expiry one candle (one minute). |
| Signals and outcomes | Close cross: 165 signals (83 Higher, 82 Lower), 70 wins, 91 losses, 4 ties; 43.5% of decided trades won. Two-average cross: 79 signals (39 Higher, 40 Lower), 33 wins, 44 losses, 2 ties; 42.9%. Pull-back: 108 signals (52 Higher, 56 Lower), 62 wins, 44 losses, 2 ties; 58.5%. |
| Break-even | At an 85% payout a trade has to win about 54.1% of decided trades to break even (1 ÷ 1.85); at 87%, 53.5%. The 85% is an assumption for the arithmetic, not a payout read from the platform. Net result per dollar staked at 85% (a tie returns the stake): close cross -$0.19, two-average cross -$0.20, pull-back +$0.08. |
| Orders placed | None. The test only replays recorded candles: it used no real money and placed no order of any kind, Practice included. |
This is a replay of three fixed rules on candles recorded from IQ Option’s Practice traderoom, not a set of orders placed on the platform, so the numbers say nothing about what the rules will do next. It ignores spread and delays, and the payout was fixed at 85% for the arithmetic; IQ Option showed 91% for EUR/USD binary options expiring within about ten minutes on 5 October 2026 and 82% to 91% on options on 2 to 4 October, and at 91% the break-even rate is 52.4%. With 106 decided trades, the win rate of the pull-back rule has a margin of about five percentage points either side, larger than its gap to the break-even rate. IQ Option’s blog on backtesting says most strategies need dozens, often hundreds, of trades before the results mean anything. A short test predicts nothing, and no profit and no win rate is promised.
Pros and cons of the 1-minute strategy
| Pros | Cons |
|---|---|
| It gives a quick, rule-based answer on a one-minute chart. | The rule fires often, and in our replay the pull-back rule fired 108 times in about 25 hours of candles and won 58.5% of its 106 decided trades, a result that a sample this small cannot tell apart from chance. |
| The two lines show the trend at a glance. | It needs the chart open all the time, because a one-minute entry is only valid for that candle. |
| You can test it on a Practice balance at no cost. | In a sideways market the averages cross back and forth and the signals fail. |
Which strategy is best for binary options?
None of the rules above is proven, and our replay did not find an edge: the pull-back rule won 62 of 106 decided trades (58.5%) against a break-even rate of 54.1%, but with 106 trades one standard error is about five percentage points, which is larger than the gap; the close cross and the two-average cross won 43.5% and 42.9%. Practise on the Practice balance, count your own results over a few hundred trades and compare the win rate with the break-even rate before you risk money. Remember that a one-minute binary option is a very short bet; if you want to know what a losing run costs, try the martingale calculator.
Related guides
- SMA 4 and SMA 30: a 5-minute strategy
- How to trade with the EMA indicator on IQ Option
- IQ Option scripts library, with an SMA 8/21 cross script that marks the plain cross on your chart
- All indicator guides and all strategy guides
Frequently Asked Questions
Q: How do you identify the trend with the 1-minute SMA 8/21 strategy?
A: By the order of the two lines. When the SMA(8) is above the SMA(21) the trend is up, and when it is below, the trend is down.
Q: What expiry does the strategy use?
A: One minute, from the close of the signal candle. On 5 October 2026 the Expiration list for EUR/USD binary offered an expiry for every minute for about ten minutes ahead, each shown as a clock time with the time remaining, not as a number of minutes. The replay assumes exactly one candle.
Q: Is the strategy suitable for beginners?
A: It is easy to set up, but a one-minute trade leaves little time to think. Try it on the Practice balance first.
Q: What win rate does a trade need to make money?
A: About 54.1% of decided trades at an 85% payout (1 ÷ 1.85), about 53.5% at 87% and more than 54.9% at 82%. Read the payout next to the asset before you trade. In our replay the pull-back rule won 58.5% of its decided trades, but the sample was small, so it shows no edge.
Q: Can I add the two lines as one script?
A: Yes, for the plain two-average cross: the library’s SMA 8/21 cross script marks it. That is a different, slower setup than the pull-back above, and the script does not mark the pull-back entry. Import it as shown in our scripts guide.