
Last updated: 8 October 2026. Every screenshot below was recorded on 5 and 8 October 2026 (the Chart analysis pictures in Steps 1 and 2 are from 5 October) on an IQ Option Practice account registered in Brazil, on 5-minute EUR/USD candles from 29 September 2026. We placed no real-money trade. The defaults and allowed values come from the published source code of the platform’s built-in indicators (Quadcode’s script library), and the screenshots show the dialogs as recorded. This guide has no tested box: ALMA and LSMA are lines to read, and no trading rule for them is tested here.
ALMA (the Arnaud Legoux Moving Average) and LSMA (the Least Squares Moving Average) are two moving averages in IQ Option’s Moving Averages group, and each draws one line on the price chart. ALMA has the settings Period (default 9), Offset (0.85), Sigma (6) and Source (close); LSMA has Period (25), Offset (0) and Source (close). This guide shows where to find them, what each setting is and how the lines can be read; neither has a trading rule of its own.
Quick answer
- Where: the indicators button, Chart analysis, the Moving Averages list, then ALMA or LSMA.
- ALMA defaults: Period 9, Offset 0.85, Sigma 6. The period accepts 1 to 100 (published source code of the platform’s built-in indicators).
- LSMA defaults: Period 25, Offset 0. The period accepts 1 to 200.
- What the LSMA is: the end of a least-squares line fitted to the last N values. With offset 0 and the same period it draws the same line as the Linear Regression Forecast indicator.
- How to read both: the slope of the line and where price sits against it, as with any moving average. Neither has a trading rule or an expiry of its own, and none is tested here.
- Limit: both are built from past prices, so they lag. IQ Option’s blog says a moving average cannot predict the direction or the strength of the next move.
- Colours: in the source code both lines start in the same light blue, so change one colour before you put them on one chart.
Where to find Arnaud Legoux Moving Average and LSMA on the IQ Option platform
Both indicators sit in the Moving Averages group of the Chart analysis panel. IQ Option’s blog on indicator types names the Arnaud Legoux Moving Average, Kaufman’s Adaptive Moving Average, the Least Squares Moving Average and the Rainbow Moving Average as members of that group. These steps use the web traderoom on a Practice balance, and the numbers in each screenshot match the numbers in the text. If you do not have an account yet, see how to register.
Step 1: Open Chart analysis
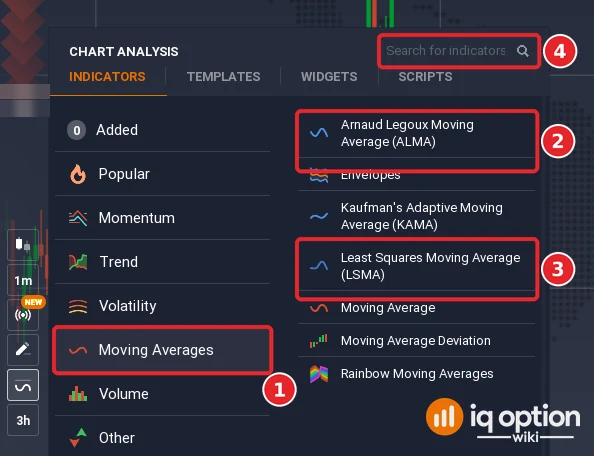
Click the indicators button (1), the wave icon in the chart toolbar at the bottom left of the chart. The Chart analysis panel opens with the tabs Indicators, Templates, Widgets and Scripts. Stay on Indicators.

Step 2: Open the Moving Averages list
Open the Moving Averages list (1). Arnaud Legoux Moving Average (ALMA) (2) and Least Squares Moving Average (LSMA) (3) are in it, with Envelopes, Kaufman’s Adaptive Moving Average (KAMA), Moving Average, Moving Average Deviation and Rainbow Moving Averages. You can also type “ALMA” or “LSMA” in the Search for indicators box (4). Click a name to open its dialog.
Arnaud Legoux Moving Average
The ALMA is a moving average: it draws one line that follows price and smooths it. IQ Option’s blog says moving averages “smooth out the price chart and make the trend more obvious and easier to spot”. The simple moving average gives every candle in its period the same weight. The ALMA has two extra settings, offset and sigma, that control how it weights the candles in the period, so an ALMA and an SMA with the same period do not draw the same line. The examples here leave offset and sigma at their defaults.
| Setting | Default | Allowed values | What it sets |
|---|---|---|---|
| Period | 9 | 1 to 100 | The number of candles in the average. |
| Offset | 0.85 | 0 to 100 | A shape setting of the ALMA. |
| Sigma | 6 | 0.01 to 10 | A shape setting of the ALMA. |
| Source | close | the list of prices | The price of each candle that the line is built from. |
The defaults and the allowed values come from the published source code of the platform’s built-in indicators. The dialog in step 3 shows the same fields and values.
Step 3: Open the ALMA dialog and check the settings
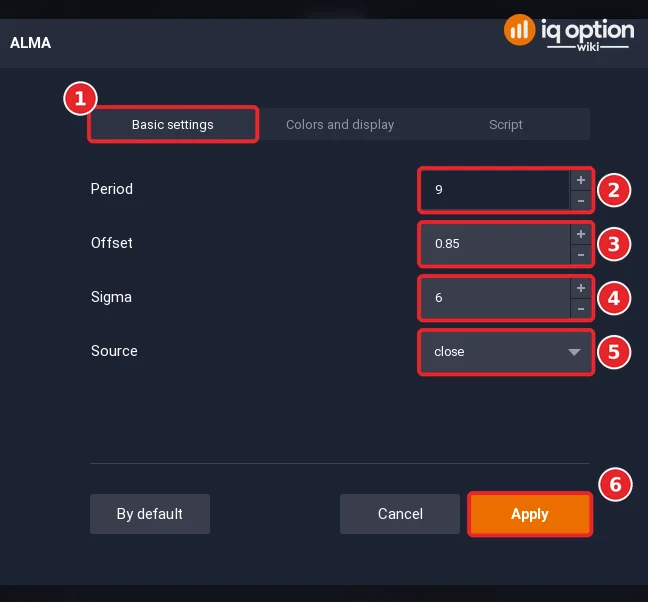
Click ALMA. The dialog has three tabs: Basic settings (1), Colors and display and Script. On Basic settings the fields are Period (2), Offset (3), Sigma (4) and Source (5), a list that opens on close. Leave them at 9, 0.85, 6 and close and click Apply (6). The By default button is named for restoring the opening values.
Step 4: Compare the ALMA with an SMA of the same period
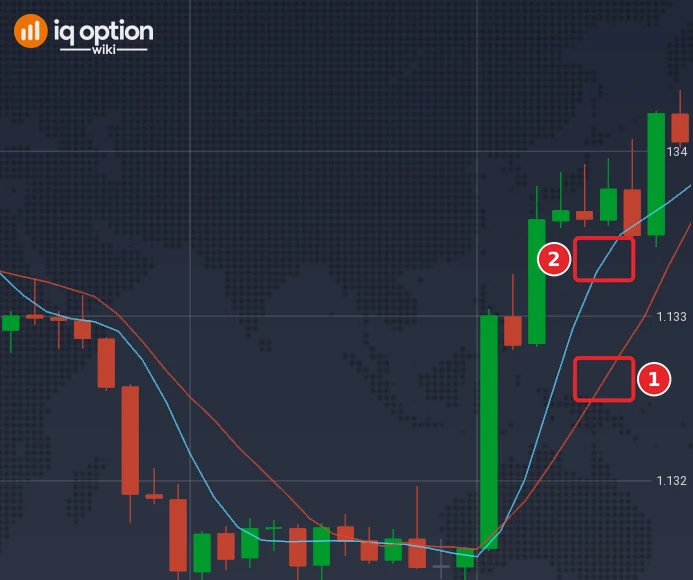
To see how the ALMA differs from a simple moving average, add a Moving Average with the type SMA and the period 9 in another colour (1) next to the ALMA (2). Both lines are built from the same nine candles but weight them differently, so they do not overlap.
What is ALMA strategy?
The ALMA has no trading rule of its own: it is a line, and it is read the way any moving average is read. IQ Option’s blog describes three readings that apply:
- Slope. When the line slopes up the market often follows an uptrend, and when it slopes down a downtrend. A flat slope points to a weak or sideways market.
- Where price sits. Price that stays above the line points to a bullish structure and price that stays below it to a bearish one.
- Crossings. When price crosses the line again and again, the market has no clear direction.
A longer period gives a smoother line and a later one: IQ Option’s blog says that, in general, the higher the period, the smoother the line. The ALMA accepts periods from 1 to 100.
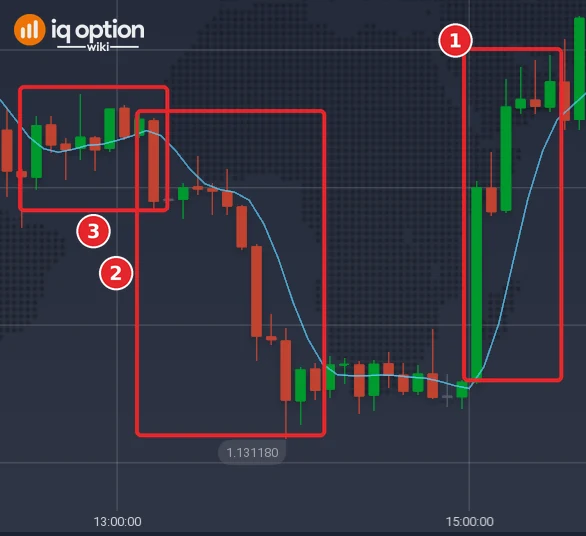
The picture shows the ALMA with its defaults (period 9, offset 0.85, sigma 6) on 5-minute EUR/USD candles of 29 September 2026, from 12:15 to 15:40 on the platform clock. From 15:00 to 15:25 the line slopes up and the candles close above it (1). From 13:10 to 14:05 it slopes down and each of the 12 candles closes below it, two of them by less than 0.1 pip (2). Between 12:30 and 13:10 the line is nearly flat, within 2 pips, and the closes cross it eight times in 40 minutes (3): the repeated crossings that the blog reads as a market without a clear direction. All three are readings of a chart that had already been drawn. Nothing here shows that price kept going the way the line pointed.
A moving average is built from past prices, so it cannot mark a reversal or a breakout in advance: IQ Option’s blog says it cannot predict the direction or the strength of a trend. The blog’s article on indicator combinations pairs a moving average with the Stochastic Oscillator, and the same idea can be tried with the ALMA. This guide has not tested it.
Least Squares Moving Average
The LSMA is built from a least-squares line: the straight line through the last N values of the chosen price that makes the sum of the squared distances to those values as small as possible (the method). In the published source code of the platform’s built-in indicators the LSMA is a call of the linreg function, which gives the value of that line at the latest candle when the offset is 0. The platform’s Linear Regression Forecast indicator uses the same call with offset 0, so an LSMA with the same period draws the same line as that indicator. Our guide to the Linear Regression Forecast covers it. The Chande Forecast Oscillator uses the same call: it plots the gap between price and that line as a fraction of price.
| Setting | Default | Allowed values | What it sets |
|---|---|---|---|
| Period | 25 | 1 to 200 | The number of candles that the least-squares line is fitted to. |
| Offset | 0 | −100 to 100 | How many candles back the value is read; 0 reads the line at the latest candle. |
| Source | close | the list of prices | The price of each candle that the line is built from. |
Step 5: Open the LSMA dialog and check the settings
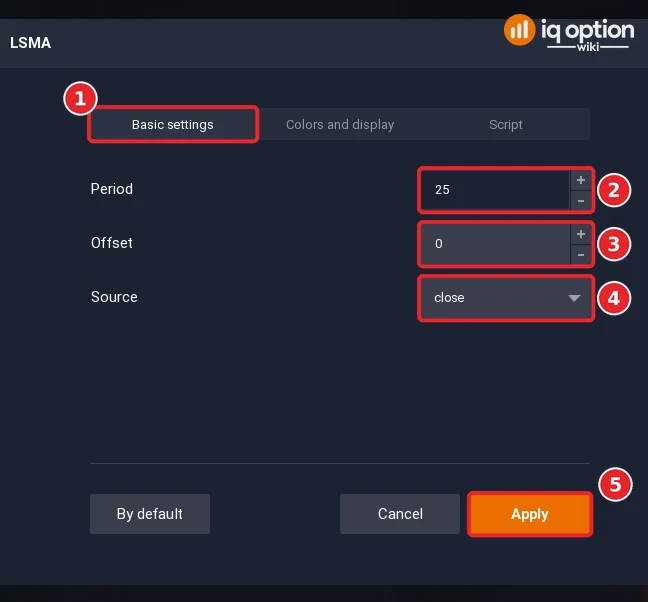
Click LSMA in the Moving Averages list. On Basic settings (1) the fields are Period (2), Offset (3) and Source (4), a list that opens on close. Leave them at 25, 0 and close and click Apply (5). In the published source code the ALMA line and the LSMA line start in the same light blue, so if both are on the chart, open Colors and display and give one of them another colour.
How you can use the Least Squares Moving Average
Like the ALMA, the LSMA is a line, so the readings above apply to it too: the slope, the position of price against the line and repeated crossings. It can be used in two ways:
- One LSMA. A rising line with price staying above it is read as an uptrend, and a falling line with price below it as a downtrend.
- Two LSMAs. Add a second LSMA with another period, for example LSMA 20 and LSMA 50, and look at where they cross. As with any pair of averages, the faster line crossing above the slower one is read as a move up and crossing below it as a move down. IQ Option’s blog says crossovers can give false signals when the market moves sideways.
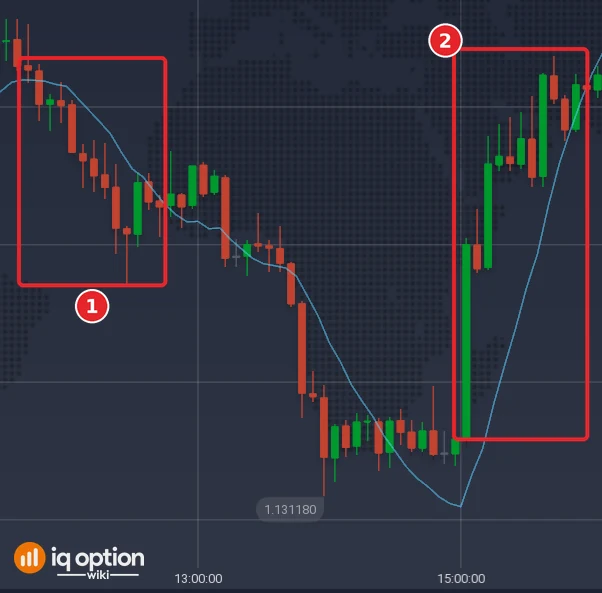
The picture shows the LSMA with its defaults (period 25, offset 0) on 5-minute EUR/USD candles of 29 September 2026, from 11:25 to 16:10 on the platform clock. From 11:45 to 12:40 the line slopes down and each of the 12 candles closes below it, the last three by less than a pip (1). From 15:00 to 15:50 it slopes up and each of the 11 candles closes above it, the last two by about a pip or less (2). These are readings of a past chart: there is no entry candle and no expiry, and this guide does not test them.
Step 6: Add a second LSMA with another period
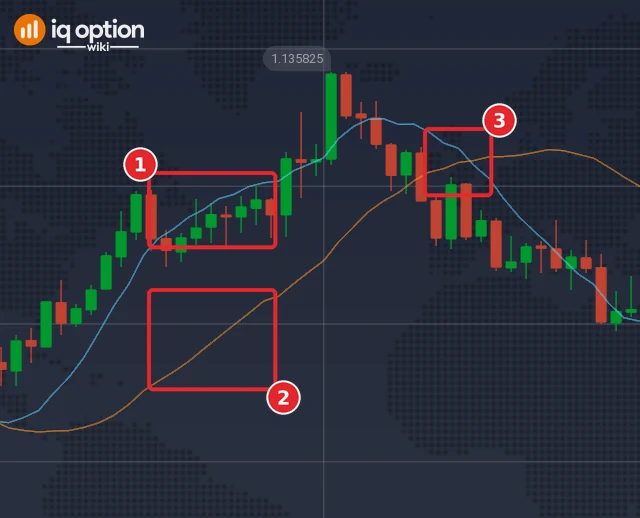
To see the crossing, put two LSMAs on the chart with different periods and different colours. In this guide the faster one has period 20 (1) and the slower one period 50 (2). The point where the faster line crosses the slower one (3) is where a change of direction is read. These are readings of a chart: they have no entry candle and no expiry, and this guide does not test them. In the picture the LSMA 20 is the light blue line and the LSMA 50 the orange one, which we picked on Colors and display. In its window (05:10 to 14:30 on the platform clock, 29 September 2026) the two lines crossed six times. The one marked (3), at 09:45, has the LSMA 20 moving below the LSMA 50; they crossed again at 11:50 and at 12:05, 15 minutes apart.
Pros and Cons of ALMA and LSMA
| Pros | Cons |
|---|---|
| Each is one line on the price chart with few settings: four for the ALMA (Period, Offset, Sigma, Source), three for the LSMA (Period, Offset, Source). | Both are built from past prices, so they lag. IQ Option’s blog says a moving average cannot predict the direction or the strength of the next move. |
| Both come with defaults (ALMA 9, 0.85 and 6; LSMA 25 and 0), so you can start without choosing anything. | The ALMA has two shape settings, offset and sigma, and no source used here says how to choose them. |
| You can compare either line with an SMA of the same period on the same candles, as in step 4. | A pair of lines can cross late or falsely when the market moves sideways (IQ Option’s blog). |
| The LSMA matches the Linear Regression Forecast of the same period with offset 0, so one calculation covers both. | In the published source code both lines start in the same light blue, so you must change a colour before you can tell them apart. |
ALMA vs. LSMA: Key Differences
| Feature | ALMA | LSMA |
|---|---|---|
| Full name | Arnaud Legoux Moving Average | Least Squares Moving Average |
| Group on the platform | Moving Averages | Moving Averages |
| Settings | Period, Offset, Sigma, Source | Period, Offset, Source |
| Default settings | Period 9, offset 0.85, sigma 6 | Period 25, offset 0 |
| Period range in the source code | 1 to 100 | 1 to 200 |
| What the line is | A moving average with its own weighting, shaped by offset and sigma | The end of a least-squares line fitted to the last N values, read at the latest candle when the offset is 0 |
| Same calculation as another indicator | None named in the source code | Linear Regression Forecast (same period, offset 0) |
| Default line colour in the source code | Light blue (#56CEFF) | The same light blue at 75% opacity |
Final words
The ALMA and the LSMA are two of the moving averages in IQ Option’s Moving Averages group. Both are lines built from past prices: they show the direction of the recent average and where price sits against it, and they do not forecast. A sensible way to use this guide is to add each indicator on the Practice balance, keep the defaults, change the period only, and write down what you see before you build a trade rule on it. IQ Option’s blog says most strategies need dozens, and often hundreds, of trades before a result means anything. Indicators give false signals from time to time, so ask for an extra confirmation before you act on any crossing.
Common mistakes
- Two lines in the same colour. The ALMA and the LSMA start in nearly the same light blue in the source code. Change one on the Colors and display tab.
- Comparing lines on different candle sizes. The period counts candles, so an ALMA 9 covers nine one-minute candles on a one-minute chart and nine daily candles on a daily chart.
- Treating a crossing as a signal on its own. IQ Option’s blog says crossovers can be late or false in slow markets and that traders need extra confirmation.
- Changing offset and sigma at random. Nothing here says how they should be chosen. Change one setting at a time and look at the result.
Related guides
- Moving average on IQ Option and the EMA indicator
- Linear Regression Forecast, Linear Regression Slope and Chande Forecast Oscillator
- Kaufman’s Adaptive Moving Average and Moving Average Deviation
- Trading with the SMA 20, identifying a trend and identifying breakouts
- Chart types on IQ Option, Fibonacci levels and an overview of the platform
- All indicator guides and all strategy guides
Frequently Asked Questions
Q: What are the default settings of ALMA and LSMA?
A: ALMA: period 9, offset 0.85 and sigma 6. LSMA: period 25 and offset 0. Both dialogs open with the source set to close. The screenshots show these values; the allowed ranges in this guide come from the published source code of the platform’s built-in indicators.
Q: Can ALMA and LSMA be used together in a trading strategy?
A: They can be on the same chart. No source shows that doing so improves results. Both are moving averages, and IQ Option’s blog prefers indicators from different groups to several of the same kind and says too many lines make signals unclear. Test any combination on a Practice balance first.
Q: How can I practice using ALMA and LSMA before trading with real money?
A: Add them to a chart on the Practice balance. It holds $10,000 and has a Refill to $10,000 button. Change one setting at a time and note what the line does.
Q: Are ALMA and LSMA suitable for beginner traders?
A: They are quick to add and have few settings. IQ Option’s blog says a moving average needs a lot of practice to be used effectively, and no source rates the ALMA or the LSMA for beginners.
Q: Can I use ALMA and LSMA on various financial instruments and timeframes?
A: You can add them to the chart of any asset. The period counts candles, so the candle size changes what the line means.
Q: How can I reduce false signals generated by ALMA and LSMA?
A: No source gives a method that removes them. IQ Option’s blog says crossovers can be late or false in slow markets and that traders need extra confirmation. Whatever you add, test it separately from the lines.
Q: Why do my ALMA and LSMA lines look the same colour?
A: In the published source code both start in the same light blue, the LSMA slightly transparent. Change one colour on the Colors and display tab.
Q: Is the LSMA the same as the Linear Regression Forecast?
A: With offset 0 and the same period it draws the same line, because both use the same calculation in the published source code of the platform’s built-in indicators.

