
Last updated: 8 October 2026. Every screenshot below was recorded on 8 October 2026 on an IQ Option Practice account registered in Brazil, on one-minute EUR/USD candles. We placed no real-money trade. The tested box reports two things: ten one-dollar Practice orders from 2 October 2026, when the strategy videos were recorded, and a replay of the rule on recorded candles. Neither says anything about what the next signal will do.
The ADX and EMA strategy reads the direction lines of the Average Directional Movement Index (+DI and −DI, period 5) together with an EMA of period 28 on a one-minute chart. When +DI is above −DI and a bullish candle closes above the EMA 28 after closing at or below it, the strategy opens a Higher (CALL) option; the mirror case opens a Lower (PUT) option. This guide shows how to set both indicators, spells out the rule and reports ten Practice orders from 2 October 2026 (5 won, 5 lost) and a replay on recorded candles.
Quick answer
- Setup: one-minute candles, an EMA 28 on the price chart (Moving Average, Type EMA) and the ADX in a panel with the Period set to 5.
- Higher (CALL): +DI is above −DI and a bullish candle closes above the EMA 28 after the previous close was at or below it. Lower (PUT): the mirror.
- Expiry: the rule uses one minute (60 seconds). The Practice orders below used two minutes, because the recorded entry needed the extra minute.
- Our Practice test, 2 October 2026: 10 one-dollar orders on five forex pairs, 5 won and 5 lost, a net loss of $0.69.
- Replay on recorded candles: on 1,505 recorded one-minute EUR/USD candles (2 and 4 to 5 October 2026) the rule gave 107 signals. With a one-minute expiry 39 of 102 decided trades won (38.2%); with two minutes, 47 of 104 (45.2%). Both are below the 54.1% break-even rate at an 85% payout.
- The ADX line: the rule does not read it. Only the +DI and −DI lines are used.
- Break-even: at an 85% payout a trade needs to win about 54.1% of the time (1 ÷ 1.85); at 88%, about 53.2%. With 104 trades the win rate has a margin of error of about ±5 points (one standard error), so 45.2% sits about 1.8 standard errors below break-even; a 95% interval of roughly 36% to 55% still includes it.
60 seconds ADX strategy that combines ADX with EMA
The strategy needs a one-minute chart with two indicators: an EMA on the price chart and the ADX in a panel below it. The expiry is 60 seconds. The Practice orders in the tested box used two minutes, and the box says why.
EMA
EMA stands for exponential moving average, an average that gives bigger weights to recent prices (IQ Option’s blog). The strategy uses the period 28. On a one-minute chart the line mainly reflects the last 28 minutes. Our EMA guide shows how it is calculated and how to read it.
ADX
The Average Directional Movement Index (ADX) draws three lines in a panel below the price chart: the ADX line, +DI and −DI. IQ Option’s blog says the ADX line measures how strong the current directional movement is, not which way it goes. The two DI lines show the side: when +DI is above −DI, upward movement has been stronger over the lookback period, and when −DI is above +DI, downward movement has been stronger. The calculation uses Wilder’s smoothing over a chosen period. This strategy reads only the two DI lines.
What is an ADX crossover?
An ADX crossover usually means the +DI and −DI lines crossing each other. This strategy does not wait for it: it only checks which of the two lines is higher at the moment a candle closes through the EMA. The DI lines show which side has been stronger, nothing more, and the strategy has no exit: the option closes at its expiry. IQ Option’s blog warns that DI crossovers can fail in a range. Its example is a stock whose DI lines crossed 14 times in 45 daily sessions at an average ADX of 13.7, while the close changed by +0.1%: each crossover named the stronger side at that moment, but neither side held control.
What is the best setting for the ADX indicator?
No source names one. IQ Option’s blog calls the standard period 14 “a reasonable place to learn the indicator”, says that shorter periods such as 7 or 10 react faster but produce more abrupt changes, and says: “I would not change the period just to make an old trade look better. Pick a setting, test it across many examples, and keep the definition consistent.” The strategy shortens the period from 14 to 5 for one-minute trades, which is shorter than the blog’s fast examples, so the DI lines can swap sides often. In this guide the 5 is a rule to test, not a proven setting. In the platform’s ADX dialog the setting is a single Period field (step 5).
How to add EMA 28 and ADX (5) to the IQ Option chart
These steps use the web traderoom on a Practice balance. The numbers in each screenshot match the numbers in the text.
Step 1: Open Chart analysis
Click the indicators button (1), the wave icon in the chart toolbar at the bottom left of the chart. The Chart analysis panel opens with the tabs Indicators, Templates, Widgets and Scripts. Stay on Indicators.

Step 2: Find the Moving Average indicator
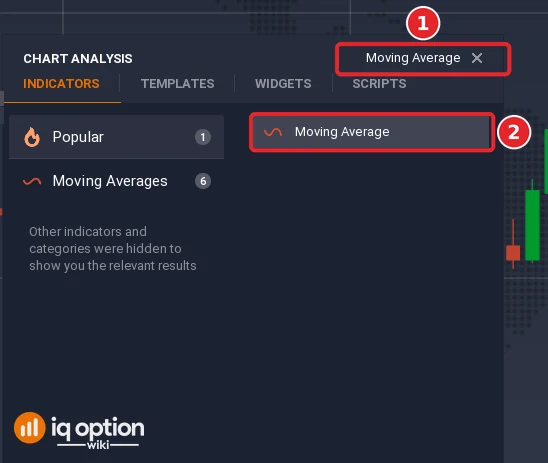
The EMA is a type of the Moving Average indicator. Type “Moving Average” in the search box (1) at the top of the panel; the one result is Moving Average (2). Click it.
Step 3: Set the type to EMA and the period to 28
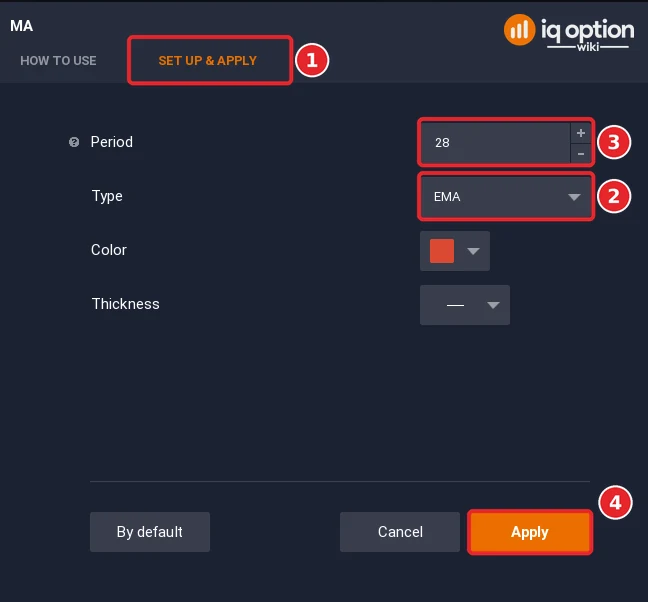
The dialog has two tabs, How to use and Set up & apply. The dialog is titled MA. Open Set up & apply (1); the settings are on one page: Period (default 14), Type (default SMA), Color and Thickness. In the Type list (2) the choices are SMA, WMA, EMA and SSMA; choose EMA. Enter 28 as the period (3) and click Apply (4). Color and Thickness are yours to choose.
Step 4: Find the Average Directional Movement Index
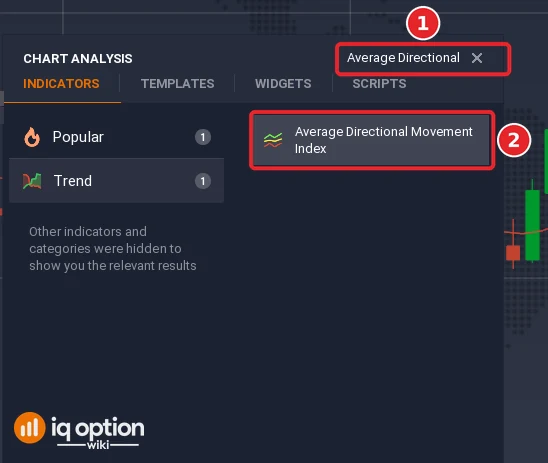
Click the indicators button again. Type “average directional” in the Search for indicators box (1), or open the Trend list, and click Average Directional Movement Index (2). It is the ADX.
Step 5: Set the period to 5
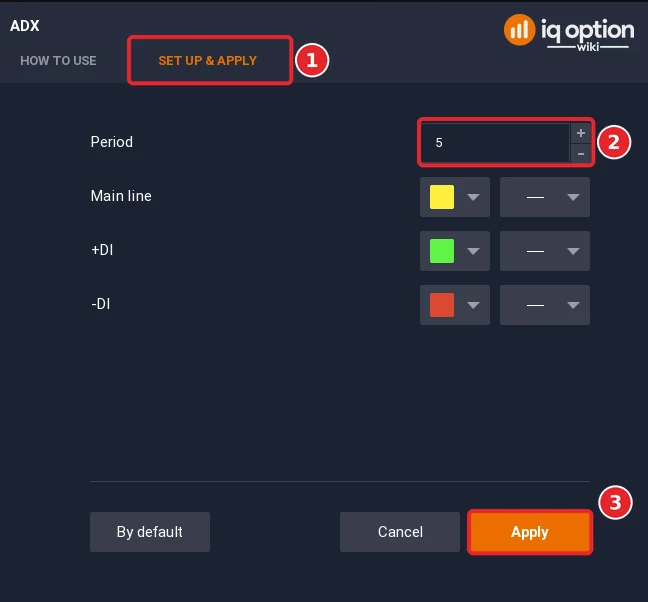
Open Set up & apply (1). The ADX dialog has one number field, Period (2), with the default 14, and colour and line settings for the main line, +DI and −DI. Change the Period (2) to 5 and click Apply (3). The dialog does not say which part of the calculation the Period controls, and the rule reads only the +DI and −DI lines.
Step 6: Read the chart
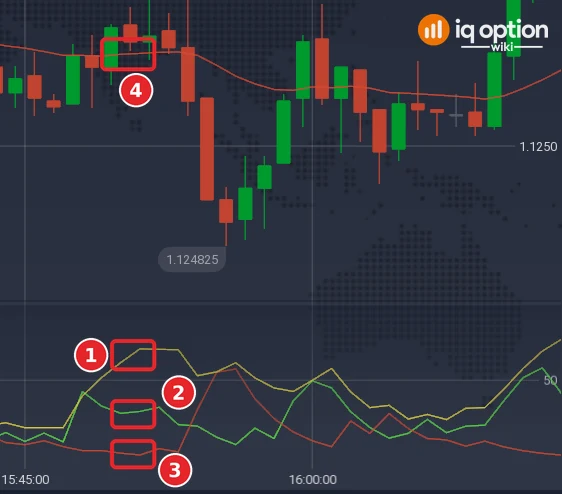
The ADX appears in a panel under the price chart with the ADX main line (1), the +DI line (2) and the −DI line (3). With the default colours the main line is yellow, +DI is green and −DI is red. On the price chart the EMA 28 (4) runs through the candles. The first condition is read from the two DI lines: +DI above −DI for a Higher option, −DI above +DI for a Lower option.
Step 7: Use one-minute candles
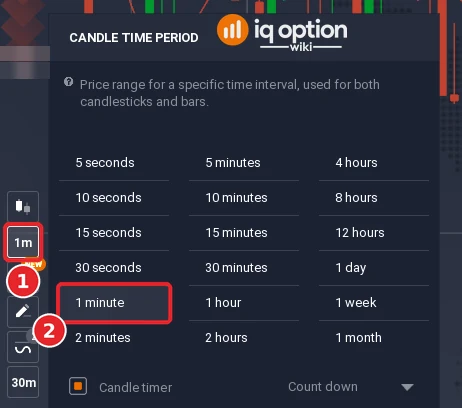
Click the candle time period button (1) in the chart toolbar and choose one minute (2). The strategy reads one-minute candles.
Step 8: Choose a binary option and the expiry
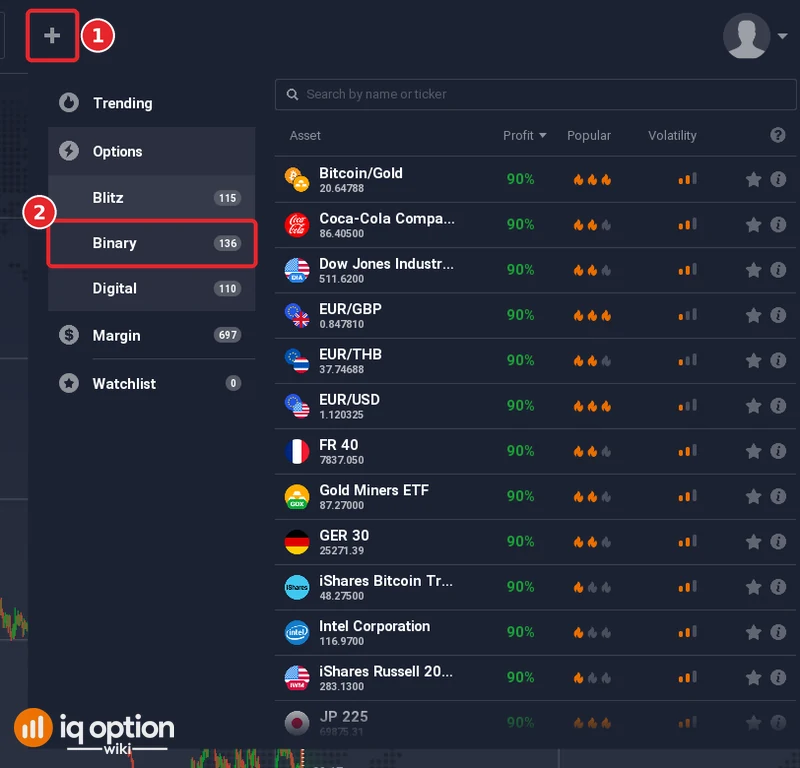
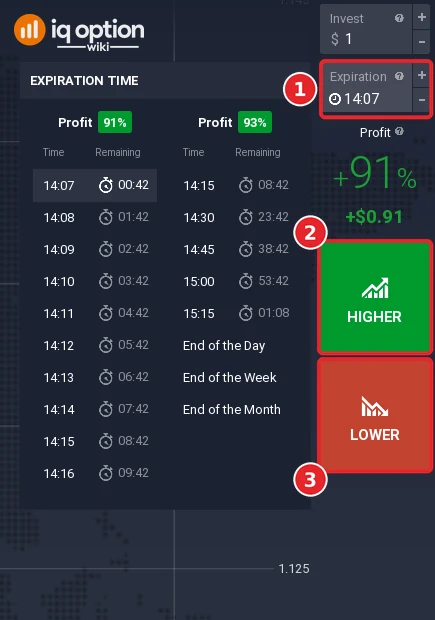
First image: click the + in the top bar (1), open Options and choose Binary (2). Second image: the trade panel is at the right of the chart. The Expiration box (1) shows a clock time, not a number of seconds. In the recorded list, the rows run one minute apart (14:07, 14:08, 14:09 and so on) with a Remaining column (00:42, 01:42, 02:42), so there is no row labelled 60 seconds. Pick the row whose remaining time matches the expiry you test, and check the Remaining column before every order. The strategy’s expiry is 60 seconds, which is one minute. The Higher (2) and Lower (3) buttons place the order once a signal appears. A binary option closes at its expiry; it has no stop loss and no take profit. For how expiry times work, see the expiry guide.
Opening a CALL position with 60 seconds EMA ADX strategy on IQ Option
A CALL is a Higher option on the platform. The rule has three conditions, all checked on closed one-minute candles, and then the entry:
- The direction line. +DI is above −DI.
- The cross. The candle closes above the EMA 28 after the previous candle closed at or below it.
- The signal candle. It is bullish: it closes above its open.
- The entry. At the close of that candle open a Higher option. The expiry is one minute.
The script library’s IQOW ADX EMA28 Cross marks exactly this rule on the chart: a green HIGHER triangle under the candle, shown after the candle has closed. The DI lines are not drawn on the price chart, so keep the native ADX panel open to see them.
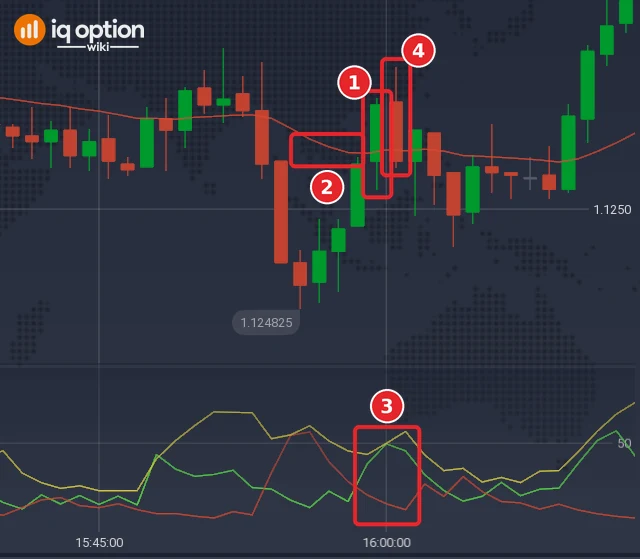
Example of a Higher signal that lost, the first Higher signal in the replay candles in time order (not chosen by outcome). The signal candle opened at 18:59 UTC (15:59 on the platform clock, UTC-3) on 2 October 2026. It was bullish: it opened at 1.125085 and closed at 1.125185, above the EMA 28, while the previous candle had closed at 1.12508 below the line, and +DI was above −DI. A Higher option opened at its close, 19:00 UTC, at 1.125185. One minute later, at 19:01 UTC, the price was 1.125085, below the entry, so the option lost. The picture marks the signal candle (1), the EMA 28 just before it (2), the DI lines at the signal (3) and the candle the option ran through (4). The previous candle closed only a hair below the EMA, so this signal is a close call for the rule.
Opening a PUT option with 60 seconds EMA ADX strategy on IQ Option
A PUT is a Lower option. The conditions are the mirror image, again on closed one-minute candles:
- The direction line. −DI is above +DI.
- The cross. The candle closes below the EMA 28 after the previous candle closed at or above it.
- The signal candle. It is bearish: it closes below its open.
- The entry. At the close of that candle open a Lower option, with the same expiry.
The library script marks this case with a red LOWER triangle above the candle.
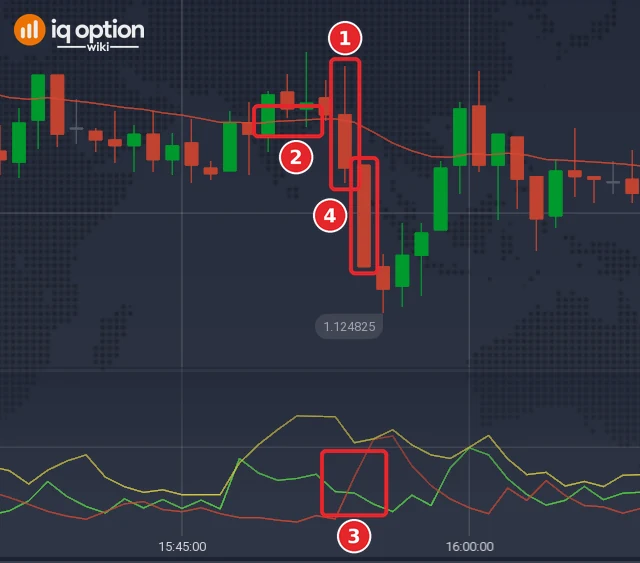
Example of a Lower signal that won, the first Lower signal in the replay candles in time order (not chosen by outcome). The signal candle opened at 18:53 UTC (15:53 on the platform clock) on 2 October 2026. It was bearish: it opened at 1.125175 and closed at 1.12508, below the EMA 28, after the previous candle had closed at 1.125175 above the line, and −DI was above +DI. A Lower option opened at its close, 18:54 UTC, at 1.12508. One minute later, at 18:55 UTC, the price was 1.124905, below the entry, so the option won. In the picture: signal candle (1), EMA 28 just before it (2), the DI lines at the signal (3) and the candle the option ran through (4). The entry and exit prices come from our recorded candles, not from an order on the platform.
Tested on IQ Option: Practice orders of 2 October 2026 and a replay run on 8 October 2026
| Asset and candles | Practice orders: ten one-dollar orders on a Practice balance, one at a time, on five forex pairs: USD/JPY (2 orders), EUR/JPY (2), EUR/USD (4), NZD/USD (1) and GBP/JPY (1). One-minute candles. The scans that led to the orders started between 17:23 and 17:59 UTC on Friday 2 October 2026. Replay: EUR/USD binary (regular, not OTC), 1,505 one-minute candles recorded from IQ Option’s Practice traderoom in two stretches: 2 October 2026, 18:23 to 20:59 UTC, and 4 October 2026, 21:01 to 5 October 2026, 19:28 UTC. The replay places no orders; it only scores the rule on those closed candles, at an 85% payout. |
|---|---|
| Rule tested | On one-minute candles, Higher when +DI(5) is above −DI(5) and a bullish candle (close above open) closes above the EMA 28 after the previous close was at or below it; Lower when −DI(5) is above +DI(5) and a bearish candle closes below the EMA 28 after the previous close was at or above it. The option opens when the signal candle closes. Expiry: the rule’s expiry is one minute; the Practice orders used two minutes because the recorded entry needed the extra minute, and the replay scores both. The body colour of the previous candle is not used, and neither is the ADX line. |
| Signals | Practice orders: 10, of which 7 Higher and 3 Lower. Replay: one-minute expiry: 107 signals (51 Higher, 56 Lower); two-minute expiry: 106 signals (50 Higher, 56 Lower; one signal at the end of the data has no exit candle). |
| Outcomes | Practice orders (two-minute expiry): 5 won, 5 lost, none refunded; a net loss of $0.69 on $10 staked. Higher: 3 of 7 won. Lower: 2 of 3 won. The winning orders paid 85% on USD/JPY, NZD/USD and GBP/JPY and 88% on EUR/USD. Replay: one-minute expiry: 39 won, 63 lost, 5 refunded (equal price); 38.2% of the 102 decided trades won; net −$0.28 per $1 staked. Two-minute expiry: 47 won, 57 lost, 2 refunded; 45.2% of 104 decided trades; net −$0.16 per $1. Both are below the break-even rate, so the replay shows no edge on these candles. |
| Break-even | At an 85% payout a trade needs to win more than 54% of its decided trades to break even (1 ÷ 1.85); at 88%, about 53.2% (1 ÷ 1.88). Five wins in ten orders is 50%. |
Ten orders, all from scans that started within 36 minutes of one Friday afternoon, cannot show whether the rule has an edge. Five wins in ten is below the break-even rate, but a result this small can move either way after a few more trades, and the replay is only a look back at candles recorded on the dates above: it placed no real orders, covers about 25 hours of candles on one pair (1,505 one-minute candles), and counts overlapping trades as if they were independent. A short test proves nothing about the future, and no profit and no win rate is promised here. IQ Option’s own blog says most strategies need dozens, and often hundreds, of trades before a result means anything.
The ten Practice orders
These are the ten orders behind the box, from 2 October 2026, a Friday. The scan watched 11 currency pairs and placed one order at a time when the rule marked a closed one-minute candle. “Scan start” is when the scan that produced the order began. The expiry was two minutes.
| Order | Scan start (UTC) | Pair | Direction | Result | Net |
|---|---|---|---|---|---|
| 1 | 17:23 | USD/JPY | Higher | Won | +$0.85 |
| 2 | 17:26 | EUR/JPY | Lower | Lost | −$1.00 |
| 3 | 17:29 | EUR/JPY | Higher | Lost | −$1.00 |
| 4 | 17:34 | EUR/USD | Higher | Won | +$0.88 |
| 5 | 17:37 | EUR/USD | Higher | Lost | −$1.00 |
| 6 | 17:45 | USD/JPY | Higher | Lost | −$1.00 |
| 7 | 17:48 | NZD/USD | Higher | Won | +$0.85 |
| 8 | 17:52 | EUR/USD | Lower | Won | +$0.88 |
| 9 | 17:56 | GBP/JPY | Lower | Won | +$0.85 |
| 10 | 17:59 | EUR/USD | Higher | Lost | −$1.00 |
Pros and Cons of the 60 Seconds ADX Strategy
| Pros | Cons |
|---|---|
| Both indicators are built in, so no script is needed. The library script marks the same rule if you want markers on the chart. | The rule never reads the ADX line, so it does not check how strong the trend is. IQ Option’s blog says the ADX is most useful for deciding whether a trend-following idea belongs in the market at all. |
| The rule is mechanical: +DI against −DI, a candle closing through the EMA and the colour of the candle’s body. It can be replayed on past candles and tried on a Practice balance. | In a sideways market price crosses a 28-period EMA again and again, and each cross can pass the DI filter when the two DI lines are close together (the library script’s own note). |
| The expiry is fixed in advance, so the stake is the most you can lose on a trade. | A period of 5 is shorter than the 7 or 10 that IQ Option’s blog gives as fast settings, and the blog calls the one-minute chart usually too noisy for beginners. |
| With the default colours the +DI line is green and the −DI line red, so the first condition can be read at a glance. | In the ten Practice orders 5 won and 5 lost. At an 85% payout a trade needs to win more than 54%. In the replay the rule won 38.2% (39 of 102) with the one-minute expiry and 45.2% (47 of 104) with the two-minute expiry of its decided trades. |
Important Factors to Consider When Using the 60 Seconds ADX Strategy
| Factor | Description |
|---|---|
| Timing | The rule is read on closed one-minute candles: wait for the close, then place the order. The rule’s expiry is one minute; the Practice orders used two minutes because the recorded entry needed the extra minute. |
| Market conditions | Look at the ADX panel before you act. IQ Option’s blog says that a low ADX with the DI lines crossing repeatedly means the market is probably rotating rather than trending. The rule does not use the ADX line, so this check is yours to add, and it is not tested here. |
| Risk management | A binary option has no stop loss: it closes at its expiry and the most you can lose is the stake. At an 85% payout a trade needs to win more than 54% of the time to break even. |
| Discipline | Keep the rule and its settings fixed. IQ Option’s blog on backtesting says changing rules during a test invalidates it, and its ADX article says not to change the period just to make an old trade look better. |
| Practice | Test on the Practice balance, which holds $10,000 and has a Refill to $10,000 button. IQ Option’s blog says most strategies need dozens, and often hundreds, of trades before a result means anything. |
| Adjustments | Change one thing at a time and rerun the whole test. The EMA period, the ADX period and the expiry all change the results. |
Common mistakes
- Reading the ADX line as direction. It shows strength only; the direction comes from the DI lines and the price chart.
- Treating a DI crossover as a signal in a range. The DI lines can cross many times with almost no net price movement.
- Entering before the candle closes. Every condition is read on a closed candle.
- Changing the ADX period or the EMA period after seeing results. That is how a rule gets fitted to past candles.
- Looking for a stop loss. A binary option has none; decide the stake before the session.
Related guides
- How to trade with the EMA indicator on IQ Option
- SMA 4 and SMA 30: a 5-minute strategy and the 1-minute SMA 8/21 strategy
- IQOW ADX EMA28 Cross script in the script library
- Put and call options explained, expiry times and time frames
- All indicator guides and all strategy guides
Frequently Asked Questions
Q: Can I use this strategy for longer trade durations?
A: The rule holds each trade for 60 seconds. The Practice orders used two minutes, and nothing longer has been tested here. If you change the expiry, treat it as a new strategy and test it on its own.
Q: How can I improve the accuracy of the signals generated by this strategy?
A: No source shows that adding an indicator improves accuracy. IQ Option’s blog says that more indicators do not automatically improve results and can give different indications. If you add a filter, such as a minimum ADX level, test it separately. IQ Option’s blog calls its ADX zones reference zones, not market laws, and says that neither 20 nor 25 is a universally better threshold.
Q: Is this strategy suitable for beginners?
A: The setup is short, but the trade is fast. IQ Option’s blog calls the one-minute chart usually too noisy for beginners. Try it on the Practice balance first.
Q: Can I use this strategy for trading other financial instruments?
A: The Practice orders covered five forex pairs (USD/JPY, EUR/JPY, EUR/USD, NZD/USD and GBP/JPY) and the replay covers EUR/USD only. We have no result for other assets.
Q: How can I minimize losses when using this strategy?
A: A binary option has no stop loss, so the stake is the most you can lose on each trade. Choose the stake before the session and compare your win rate with the break-even rate: more than 54% at an 85% payout.
Q: What ADX setting should I use for a 1-minute chart?
A: This strategy sets the ADX period to 5. IQ Option’s blog calls 14 the standard period and says that shorter periods react faster but produce more abrupt changes. No source shows that 5 is better than another value, so pick one, test it on many examples and keep it fixed.
Q: Which EMA period should I use on a 1-minute chart?
A: This strategy uses 28. IQ Option’s blog groups periods of 20, 30 and 50 as medium-term and says the choice depends on your trading style. No source names one period as better than the others for a one-minute chart.
Q: Why did the Practice orders use a two-minute expiry?
A: The rule says one minute. The recorded entry needed the extra minute, so the orders were placed with a two-minute expiry. The replay in the box scores the rule on both expiries.
Q: Does the rule use the ADX line or the threshold?
A: No. It reads only +DI and −DI, and it uses no ADX level such as 20 or 25. The ADX main line is on the chart, but it is not part of the rule.
Q: Can I add the rule as a script?
A: The script library’s IQOW ADX EMA28 Cross marks the same rule on the chart with HIGHER and LOWER triangles after the candle has closed. Import it as shown in our scripts guide and keep the native ADX panel open to see the DI lines.

