Last updated: 8 October 2026. Every screenshot below was recorded on 8 October 2026 on an IQ Option Practice account registered in Brazil, on five-minute EUR/USD candles. We placed no real-money trade. The tested box shows what the rule did when we replayed it on recorded five-minute EUR/USD candles from 29 September to 5 October 2026; it says nothing about what the rule will do next.
This strategy combines three indicators on a five-minute chart: the MACD, the Parabolic SAR and a 10-period exponential moving average (EMA). The entry waits for the MACD line to cross its signal line on a candle that closes on the right side of the EMA, with the Parabolic SAR dot on the matching side of price, and the trade is held about 30 minutes. This guide shows how to set the three indicators on IQ Option’s current platform, how the entry works and what the rule did when we replayed it on recorded candles.
Quick answer
- Chart: five-minute Japanese candles.
- Indicators: MACD 12, 26, 9; Parabolic SAR with Acceleration Step 0.02 and Acceleration max 0.2; Moving Average, type EMA, period 10.
- Buy (Higher): the MACD line crosses above its signal line on a bullish candle that closes above the EMA, with the Parabolic SAR dot below price.
- Sell (Lower): the mirror: the MACD line crosses below its signal line on a bearish candle that closes below the EMA, with the dot above price.
- Time in the trade: about 30 minutes, which is six five-minute candles.
- Caution from IQ Option’s blog: the Parabolic SAR is meant for strong trends; the blog advises against it on short time intervals and in sideways movement.
- Replay on recorded candles: on 1,334 five-minute EUR/USD candles (29 September to 5 October 2026), with a six-candle (30-minute) expiry, Reading 1 gave 58 signals: 30 won and 28 lost (51.7%). The stricter Reading 2 gave 15 signals: 6 won and 9 lost (40.0%). Break-even at an 85% payout is 54.1%. With 58 trades the win rate has a margin of error of about ±7 points (one standard error), so 51.7% cannot be told from break-even.
Chart setup for Parabolic SAR and MACD strategy
These steps use the web traderoom on a Practice balance. The numbers in each screenshot match the numbers in the text. You add the three indicators one by one and save them together as a template. The MACD and the Parabolic SAR keep their default settings; the EMA is the only value you set yourself.
Step 1: Open Chart analysis
Click the indicators button, the wave icon in the toolbar at the bottom left of the chart (1). The Chart analysis panel opens with the tabs Indicators, Templates, Widgets and Scripts. Its search box, “Search for indicators”, finds an indicator by name.

Step 2: Add the MACD
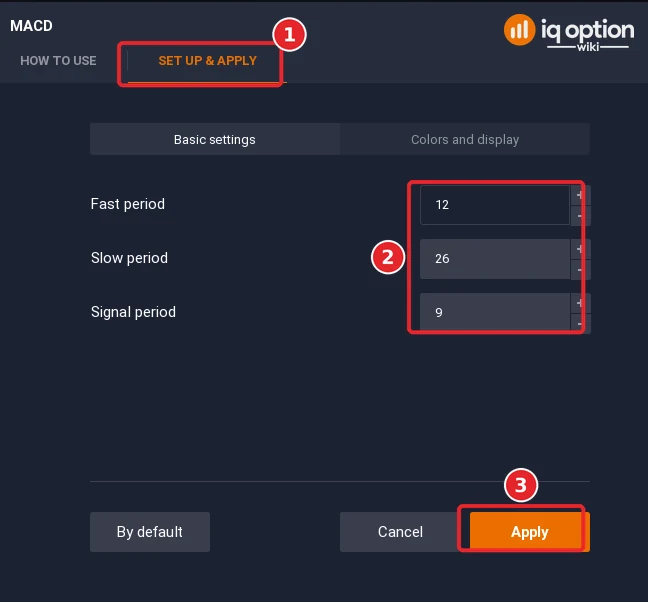
Type MACD in the search box and click MACD; it is also in the Popular list. In the dialog that opens, switch from How to use to the Set up & apply tab (1). On Basic settings, leave Fast period at 12, Slow period at 26 and Signal period at 9 (2) and click Apply (3). The MACD opens in its own panel with the MACD line, the signal line and a histogram. The MACD line is the 12-period EMA minus the 26-period EMA of the closing price, the signal line is a 9-period EMA of the MACD line, and the histogram is the MACD line minus the signal line.
Step 3: Add the Parabolic SAR
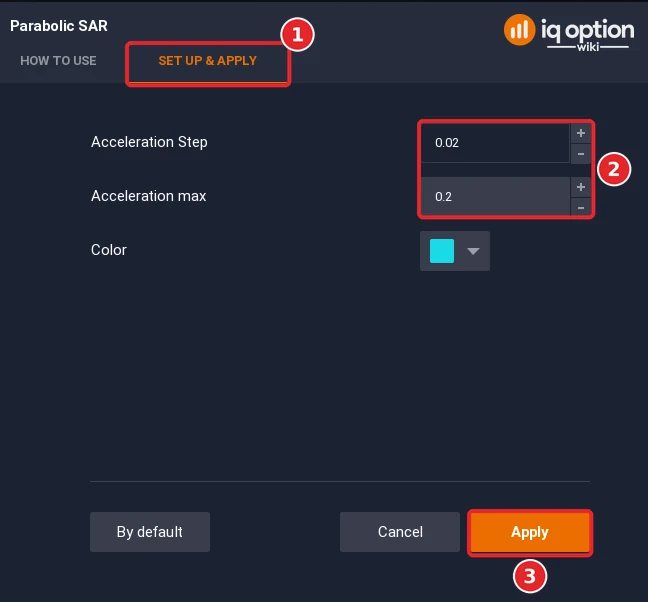
Click the indicators button again, type Parabolic SAR in the search box and click Parabolic SAR; it is in the Trend list. On Set up & apply (1), the two values are Acceleration Step 0.02 and Acceleration max 0.2 (2). Keep them and click Apply (3). The indicator draws dots on the price chart: IQ Option’s blog says they normally sit below the price in an uptrend and above it in a downtrend. The blog also says that higher acceleration values make the indicator more sensitive but less precise, and lower values do the opposite.
Step 4: Add the EMA 10
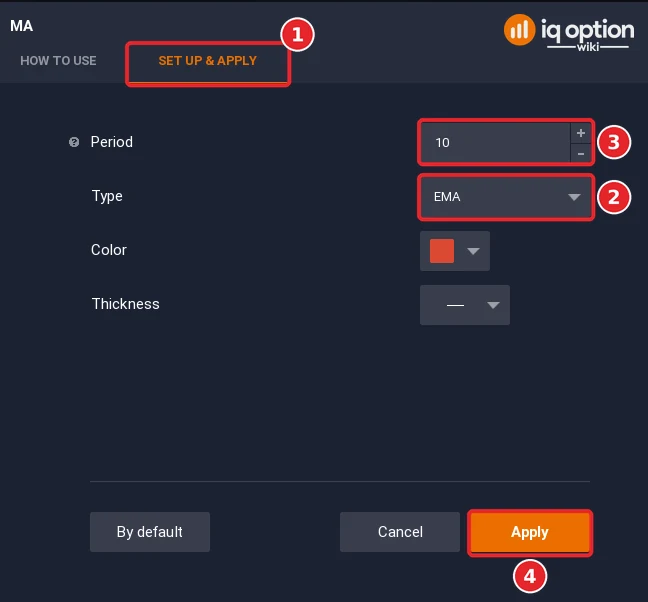
Click the indicators button again, type Moving Average in the search box and click Moving Average. IQ Option has one Moving Average indicator with a Type setting, so the EMA is chosen there. On Set up & apply (1), set Type to EMA (2) and Period to 10 (3), then click Apply (4). The line follows the closing price more closely than a simple average of the same length, because an EMA gives more weight to recent prices.
Step 5: Use five-minute candles
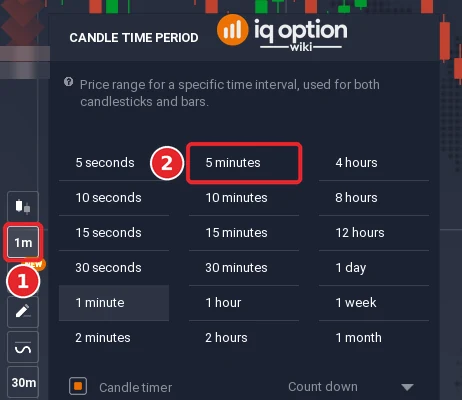
Click the candle time period button in the toolbar at the bottom left (1) and choose 5 minutes (2). The chart should show Japanese candles; if it shows a line or bars, change it with the chart type button in the same toolbar (see Japanese candlesticks and chart types on IQ Option). Every period here counts candles, not minutes: the MACD numbers 12, 26 and 9 and the EMA 10 are counted in five-minute candles.
Step 6: Check the finished chart
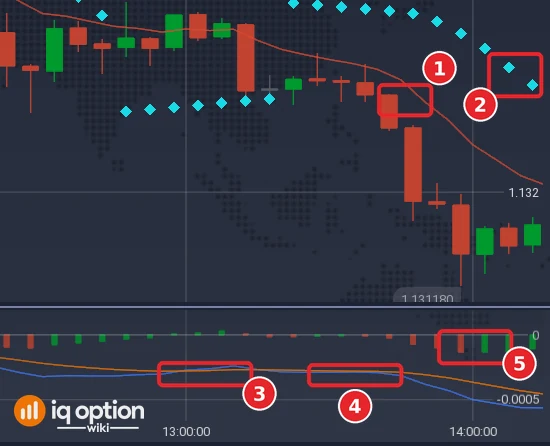
The price chart shows the EMA line (1) and the Parabolic SAR dots (2). The MACD panel under it shows the MACD line (3), the signal line (4) and the histogram (5). Colours are set on the Colors and display tab of each dialog, so identify the MACD line and the signal line there or in the screenshot.
Step 7: Save the template
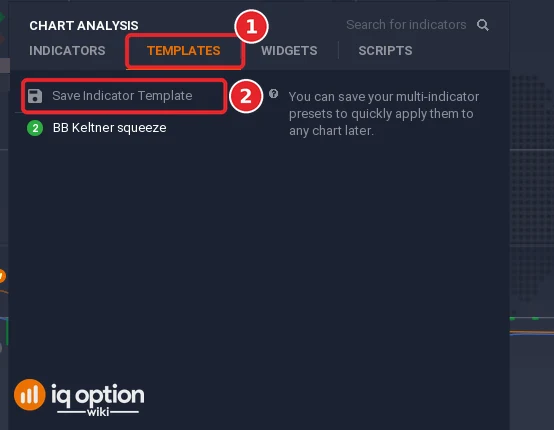
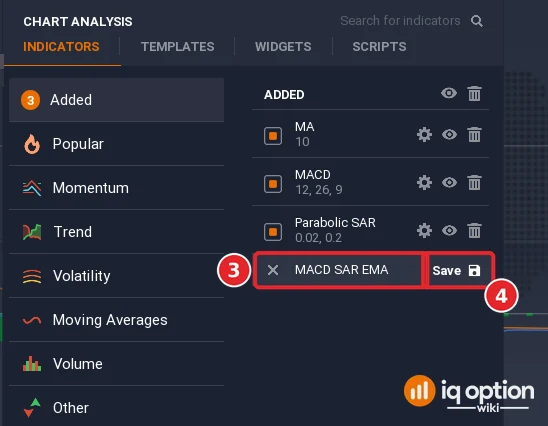
To use the same set later without repeating the steps, click the indicators button again and open the Templates tab (1). Save the current indicators as a template with the save option (2) and a row opens under the added indicators: type a name in it, for example MACD SAR EMA (3), and click Save (4). We typed the name to take the screenshot and did not save it. Next time, open the same tab and click the template to load the three indicators at once. For chart templates in general, see IQ Option chart templates.
Which indicator works best with Parabolic SAR?
There is no single answer. IQ Option’s blog pairs the Parabolic SAR with a simple moving average in one article (acceleration 0.04, acceleration max 0.4 and a 55-period SMA) and with the ATR in another. Its advice on combining indicators is to try not to overdo it: more indicators do not automatically improve results, and they may give different indications. This strategy pairs the SAR with the MACD and an EMA. The MACD line is built from two EMAs of the closing price and the EMA 10 is an average of closing prices too, so those two overlap, and IQ Option’s Vortex article warns that two indicators of the same kind can have signals that stem from the same source.
Having three indicators agree on one candle also means few marks. Our script library’s note on this rule says the marks are rare and can still appear in choppy markets.
| Indicator | Built from | What the rule uses it for |
|---|---|---|
| MACD (12, 26, 9) | Two EMAs of the closing price | The MACD line crossing its signal line |
| Parabolic SAR | Price action, with Acceleration Step 0.02 and Acceleration max 0.2 | Which side of price the dot is on |
| EMA (10) | Closing prices | Whether the candle closes above or below the line |
How to trade Parabolic SAR and MACD strategy
The Parabolic SAR (“stop and reverse”) normally appears below price in an uptrend and above it in a downtrend. IQ Option’s blog says that when price crosses one of the dots, the indicator may be expected to turn up on the opposite side of price, which can mean a reversal or at least a slowdown. The same blog says that, according to Welles Wilder, the indicator should only be used during strong trends, which usually do not exceed 30% of the time. It adds that using it on short time intervals and during sideways movement is not advised, because the indicator loses its predictive potential and can return false signals. A five-minute chart is a short interval, so treat this strategy as an idea to test and read the replay below with that warning in mind.
The rule asks for four things on one closed candle:
| Condition on the closed candle | Buy (Higher) | Sell (Lower) |
|---|---|---|
| MACD (12, 26, 9) | The MACD line crosses above its signal line on this candle | The MACD line crosses below its signal line on this candle |
| Candle | Bullish: it closes above its open | Bearish: it closes below its open |
| EMA (10) | The candle closes above the EMA | The candle closes below the EMA |
| Parabolic SAR | The dot is below the candle’s close | The dot is above the candle’s close |
| Order | Higher option when the candle closes | Lower option when the candle closes |
| Time in the trade | Six candles (30 minutes), counted from the close of the signal candle to the close six candles later | As for a buy |
The test runs two readings of the rule. Reading 1 is the table: it checks where the EMA and the SAR dot are on the signal candle, which is what our script library does. Reading 2 is stricter: the SAR dot was on the other side of price on the previous candle and has flipped on the signal candle, and the EMA 10 lies within the body of the signal candle, so that the candle appears to cut through the line.
When to enter a long-lasting buy position
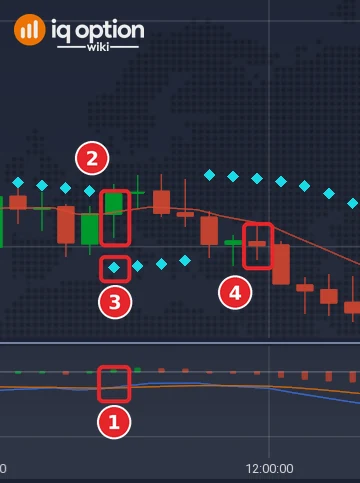
A buy looks like this: the MACD line crosses above the signal line; at the same time the chart has developed a bullish candle; the EMA 10 cuts through that candle and moves under the price; finally the Parabolic SAR dots, which were above the price, stop, break and start moving under it. This is the first buy of the replay that fits every part of that description, in time order, on EUR/USD 5-minute candles. On the candle that opened at 14:25 UTC on Tuesday 29 September 2026 (11:25 on the platform clock) the MACD line crossed above its signal line (1); the candle was bullish (open 1.134285, close 1.13447) and the EMA 10, at 1.13432, cut through its body (2); and the Parabolic SAR dot moved from above the price (1.13449 on the candle before) to below it (3). A Higher order opened at the close, 1.13447, and checked six candles later, at 15:00 UTC (4), when the price was 1.13401, would have lost.
When to enter a long-lasting sell position
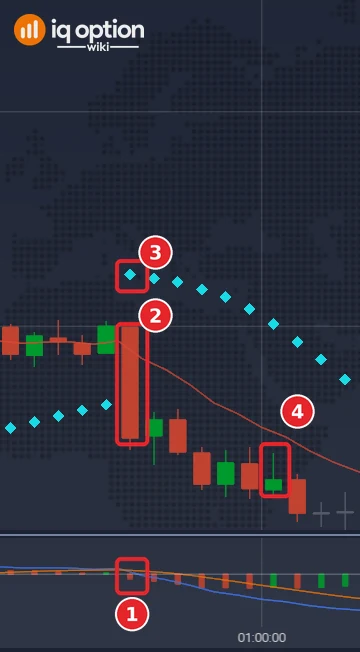
For a sell, the MACD line must cross below the signal line. The chart develops a bearish candle which the EMA 10 cuts across and then runs above the price, and the Parabolic SAR dots, which were below the price, break and start moving above it. The first full sell setup of the replay is the candle that opened at 03:30 UTC on 30 September 2026 (00:30 on the platform clock). The MACD line crossed below its signal line (1); the candle was bearish (open 1.133995, close 1.13348) and the EMA 10, at 1.13385, cut through its body (2); and the SAR dot moved from below the price (1.13365 on the candle before) to above it (1.13424) (3). A Lower order opened at the close, 1.13348, and checked six candles later, at 04:05 UTC (4), when the price was 1.133285, would have won. Both examples are the first of their kind in time order, not picked by result.
Tested on IQ Option: a replay run on 8 October 2026
| Asset and candles | EUR/USD binary (regular, not OTC), 1,334 five-minute candles recorded from IQ Option’s Practice traderoom in two stretches: 29 September 2026, 01:55 UTC, to 2 October 2026, 20:55 UTC (1,093 candles), and 4 October 2026, 21:00 UTC, to 5 October 2026, 17:00 UTC (241 candles). The replay places no orders; it scores each reading on closed candles, at an 85% payout. Reading 2 signals start 100 candles into each stretch, so that the averages and the SAR have settled. |
|---|---|
| Rules tested | Reading 1, our script library’s: on five-minute candles, the MACD (12, 26, 9) line crosses above its signal line on a bullish candle that closes above the EMA 10, with the Parabolic SAR dot (the library script’s start 0.02, step 0.02 and maximum 0.2) below the close. A Higher option opens when that candle closes. The mirror opens a Lower option. Reading 2, stricter: as Reading 1, and in addition the SAR dot was on the other side of price on the previous candle (it has flipped) and the EMA 10 lies within the body of the signal candle. Expiry: six candles (30 minutes), counted from the close of the signal candle to the close six candles later. IQ Option’s binary expiry list offers fixed clock times (one-minute steps for the first ten minutes, then quarter-hour marks, as seen on 5 October 2026), so an exact 30 minutes exists only when you enter on a quarter-hour mark; the replay does not model that. |
| Signals | Reading 1: 58 (25 Higher, 33 Lower), from the library script run on the candles; a separate Python version of Reading 1 gave 54 (24 Higher, 30 Lower); we did not find the reason for the difference of four signals, and both versions ended below break-even. Reading 2: 15 (10 Higher, 5 Lower). |
| Outcomes | Reading 1: 30 won, 28 lost, none refunded; 51.7% of the 58 decided trades won; net −$0.04 per $1 staked (Higher 13 of 25 won, Lower 17 of 33). The Python version: 27 won, 27 lost (50.0%). Reading 2: 6 won, 9 lost, none refunded; 40.0% of 15; net −$0.26 per $1 (Higher 3 of 10 won, Lower 3 of 5). |
| Break-even | At an 85% payout a trade needs to win more than 54% of the time to break even (1 ÷ 1.85); at 87%, 53.5%. Both readings ended below that rate on these candles. With 58 trades a win rate anywhere from roughly 39% to 64% would fit Reading 1’s result (95% interval); with 15 trades, Reading 2’s result fits anything from about 20% to 64%. |
The replay applies the rule to candles that were already on the chart, recorded from IQ Option’s Practice traderoom on the dates above, and it placed no real orders. It shows what the rule did on those candles and nothing more. With three indicators that must agree on one candle the number of signals is small, and a small number of signals proves little: IQ Option’s own blog says most strategies need dozens, and often hundreds, of trades before the results mean anything. A short test proves nothing about the future, and no profit and no win rate is promised here.
Pros and Cons of the Parabolic SAR and MACD Strategy
| Pros | Cons |
|---|---|
| Three views of price have to agree on the same candle, so the marks are selective. | With three indicators that must agree, the marks are rare, according to our script library’s note, and they can still appear in choppy markets. |
| All three indicators are built into the platform and can be saved as one template. | IQ Option’s blog advises against the Parabolic SAR on short time intervals and in sideways movement, and this strategy uses a five-minute chart. |
| The rule can be written down and tested on a Practice balance at no cost. | The MACD and the EMA are both built from averages of closing prices, so they overlap; the replay gave 58 signals with 30 wins and 28 losses for Reading 1 (51.7%) and 15 signals with 6 wins and 9 losses for Reading 2 (40.0%), both below the 54.1% break-even rate at an 85% payout. |
Common mistakes
- Identifying the MACD line and the signal line by colour alone. Check the Colors and display tab and the screenshot above to tell them apart.
- Entering before the candle closes. The MACD lines, the EMA and the SAR dots can all change while a candle is still forming.
- Trading it in a sideways market, where the SAR dots flip back and forth and the MACD lines keep crossing.
- Expecting many marks. With three indicators that must agree, a mark can take a long time to appear.
- Counting the MACD and the EMA as independent confirmations. Both are built from averages of closing prices.
- Looking for a stop loss. A binary option has no stop loss and no take profit; it closes at the expiry time.
Related guides
- MACD indicator on IQ Option
- Parabolic SAR indicator on IQ Option
- Binary options strategy with MACD and Parabolic SAR
- Stochastic and Parabolic SAR strategy on IQ Option
- How to trade with the EMA indicator on IQ Option
- Chart time frames and expiry times
- IQ Option scripts library, with a MACD, Parabolic SAR and EMA script that marks this rule on your chart
- All indicator guides and all strategy guides
Frequently Asked Questions
Q: Which settings does the strategy use?
A: MACD with Fast 12, Slow 26 and Signal 9; Parabolic SAR with Acceleration Step 0.02 and Acceleration max 0.2; and a Moving Average of type EMA with period 10. All of them run on five-minute candles.
Q: How long should the trade last?
A: The rule holds a trade about 30 minutes on a five-minute chart, which is six candles. The replay used six candles (30 minutes), counted from the close of the signal candle to the close six candles later. IQ Option’s binary expiry list offers fixed clock times (one-minute steps for the first ten minutes, then quarter-hour marks, as seen on 5 October 2026), so an exact 30 minutes exists only when you enter on a quarter-hour mark. Check which expiries the platform offers for the asset you trade.
Q: What does the Parabolic SAR show?
A: A series of dots that normally sit below price in an uptrend and above it in a downtrend. When price crosses a dot, the dots may turn up on the other side, which can mean a reversal or a slowdown.
Q: Is the Parabolic SAR suitable for a five-minute chart?
A: IQ Option’s blog advises against using it on short time intervals and in sideways movement, because it loses predictive potential and can return false signals. This strategy uses a five-minute chart, so treat it as a test and not as a recommendation: the replay is reported with its limits and no result here is a promise.
Q: Can I use another moving average instead of the EMA?
A: The Moving Average indicator has a Type setting, so you can choose another type. The replay used the EMA 10 only; another type would change the signals and has not been tested.
Q: How did the rule do in your test?
A: On 1,334 recorded five-minute EUR/USD candles, Reading 1 gave 58 signals and 30 of them won (51.7%), and Reading 2 gave 15 signals and 6 won (40.0%); both are below the 54.1% break-even rate at an 85% payout. A test on recorded candles shows what the rule did on those candles and says nothing about what it will do next.
Q: Is the strategy suitable for beginners?
A: The rule is easy to state, but three indicators and a long hold leave room for mistakes. Try it on the Practice balance first, which was $10,000 when we looked and has a Refill to $10,000 button.
Q: Is there a script that marks this rule on the chart?
A: Yes. The script library has a MACD, Parabolic SAR and EMA script that draws a marker when the MACD line crosses its signal line on a candle that closes beyond the EMA with the SAR dot on the matching side. Import it as shown in our scripts guide.