Last updated: 8 October 2026. Every screenshot below was recorded on 8 October 2026 on an IQ Option Practice account registered in Brazil, on one-minute EUR/USD candles. We placed no real-money trade. The tested box shows what the rule did when it was replayed on recorded candles; it says nothing about what the next signal will do.
The 5-minute SMA 4 and SMA 30 strategy puts two simple moving averages on a one-minute chart. After the fast average (SMA 4) crosses the slow one (SMA 30), it waits for price to come back to the SMA 4 and then trades the direction of the cross for five minutes; the “5 minutes” is the length of the trade, not the candle size. This guide shows how to set up the two lines and the five-minute expiry, spells out the rule in exact terms and reports what the rule did on recorded candles.
Video tutorial
Quick answer
- Setup: a one-minute chart with an SMA 4 (blue) and an SMA 30 (red), both from the Moving Average indicator with Type SMA.
- Higher: after the SMA 4 crosses above the SMA 30, the first bullish candle that touches the SMA 4 while the SMA 4 is still above the SMA 30. Lower: the mirror with a bearish candle.
- Expiry: five minutes, from the close of the signal candle. The five minutes are the length of the trade; the chart stays on one-minute candles.
- Risk: a binary option has no stop loss and no take profit; the most you can lose on a trade is the stake.
- Replay on recorded candles: on 1,505 one-minute EUR/USD candles (2 to 5 October 2026) the rule gave 55 signals with a five-minute expiry: 31 wins, 23 losses and 1 tie, a win rate of 57.4% of decided trades against 54.1% to break even at an 85% payout. That gap is smaller than the noise of 54 trades, so the replay shows no edge. A short replay predicts nothing.
- Break-even: at an 85% payout a trade needs to win about 54.1% of the time (1 ÷ 1.85); at 87%, about 53.5%. With 54 trades the win rate has a margin of error of about ±7 points (one standard error), so 57.4% cannot be told from break-even.
Setting up SMA4 and SMA30 on IQ Option
These steps use the web traderoom on a Practice balance. The numbers in each screenshot match the numbers in the text.
Step 1: Open Chart analysis
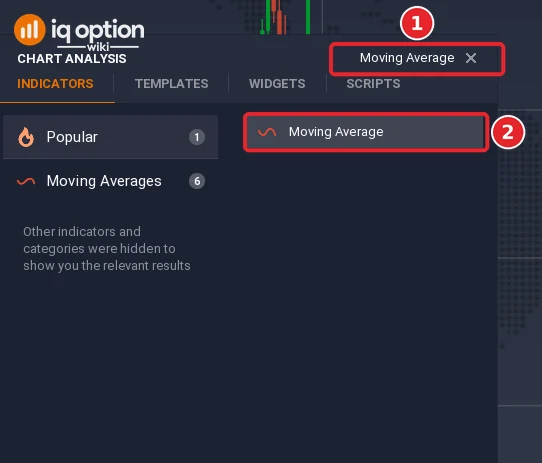
Click the indicators button (1), the wave icon in the chart toolbar at the bottom left of the chart. The Chart analysis panel opens on the Indicators tab.

Step 2: Find the Moving Average indicator
Type “Moving Average” in the search box at the top of the panel (1) and click Moving Average (2), or open the Moving Averages list and click it there. One Moving Average indicator covers every type of average; you choose the type in its dialog.
Step 3: Set the type to SMA and the period to 4
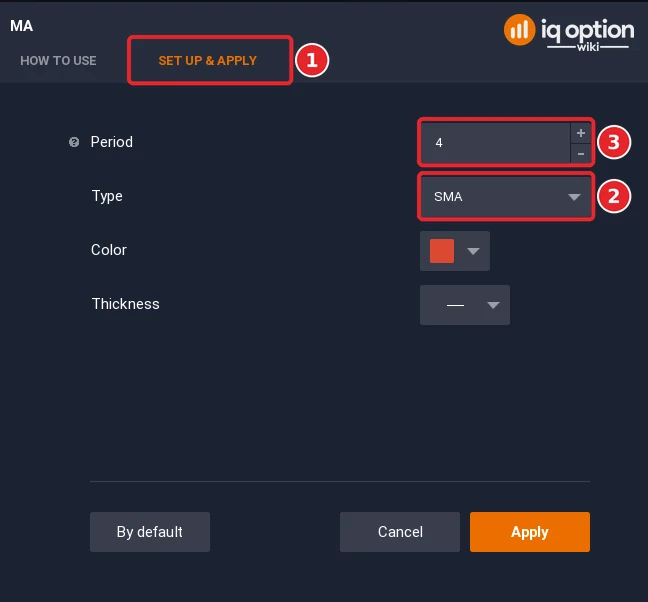
The dialog has two tabs, How to use and Set up & apply. Open Set up & apply (1). On 8 October 2026 this dialog, titled MA, showed Period (14 by default), Type (SMA by default), Color (red by default) and Thickness. Check that the Type list (2) reads SMA, then enter 4 as the Period (3).
Step 4: Colour the line blue and click Apply
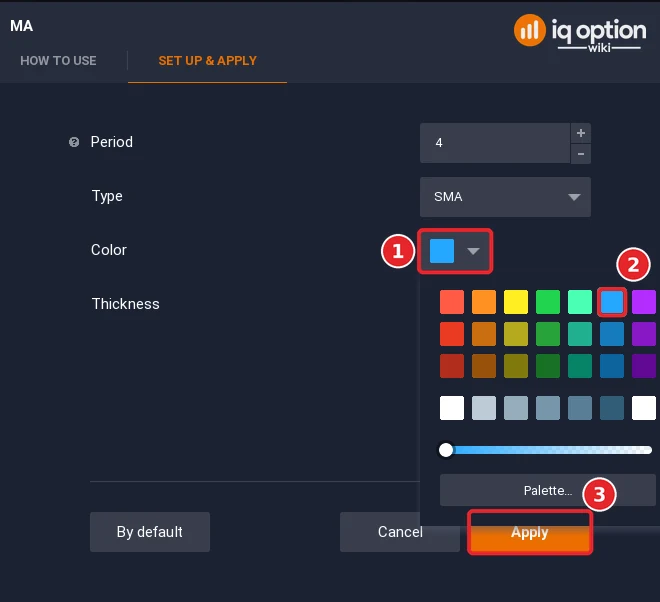
Open the Color list (1) in the same dialog, choose blue for the line (2) and click Apply (3); the Apply button sits partly behind the open colour list. A new Moving Average is red by default. Colour and width are yours to change; the rest of this guide calls the SMA 4 the blue line and the SMA 30 the red line.
Step 5: Add the SMA 30 in red
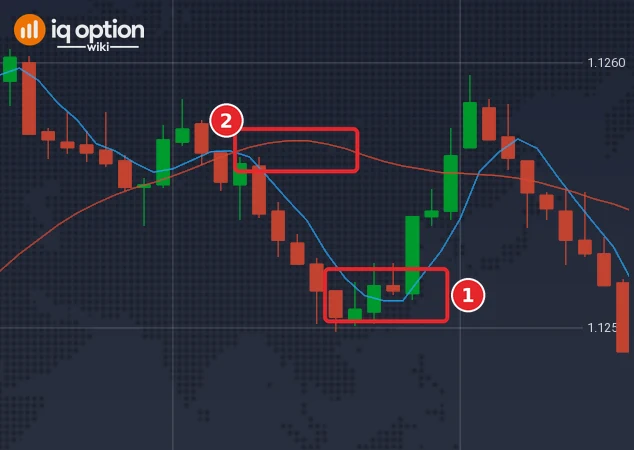
Repeat steps 1 to 3 for a second Moving Average: type SMA, period 30. Its default colour is already red, so you can leave the colour alone. Both lines now show on the chart: the blue SMA 4 (1) follows price closely and the red SMA 30 (2) is slower.
Step 6: Use one-minute candles
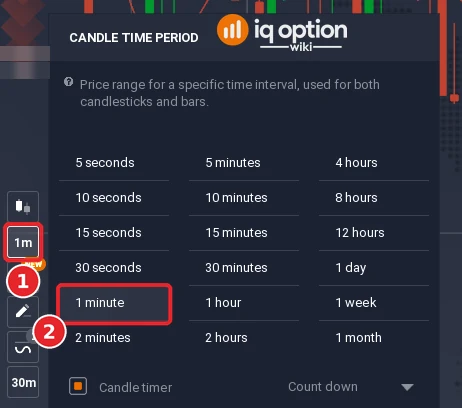
Click the candle time period button (1) in the chart toolbar and choose one minute (2). The strategy reads one-minute candles. The five minutes in its name is the length of the trade, which you set in step 7.
Step 7: Choose a binary option and a five-minute expiry
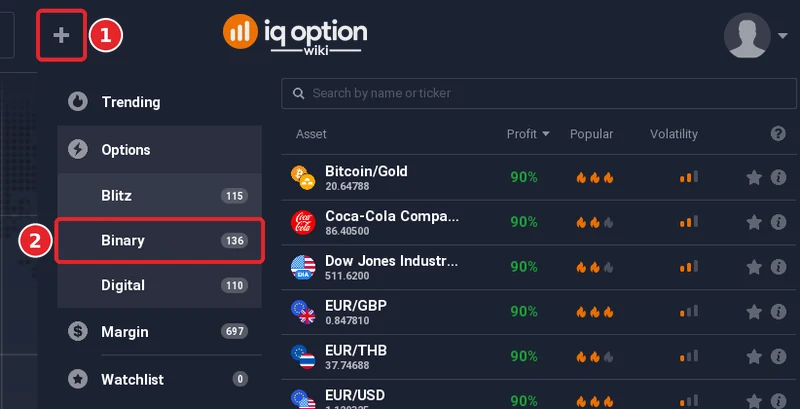
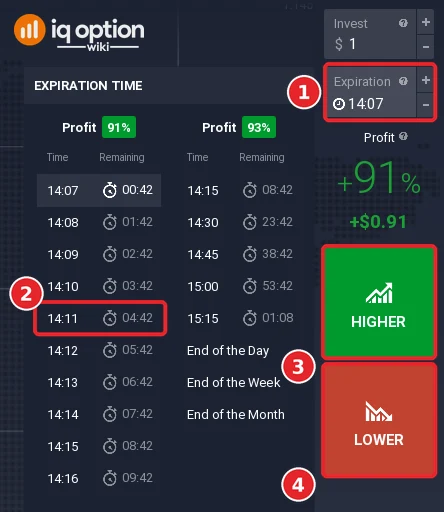
Click the + in the top bar (1), open Options and choose Binary (2). Then look at the order panel on the right. The Expiration box (1) above the Higher button shows a clock time; clicking it opens the Expiration time list, where every option is a clock time shown with the time remaining. Pick the time that is five minutes after the current minute (2): at 14:06 that is 14:11, shown with 04:42 remaining at the moment of the screenshot. The Higher (3) and Lower (4) buttons place the order once a signal appears. A binary option closes at its expiry; it has no stop loss and no take profit. For how expiry times work, see the expiry guide.
Signals of 5 minute trading strategy on IQ Option
Pairs of moving averages with different periods are a standard way to read a chart: the fast average follows recent price, the slow one the longer drift, and their crossings are often used as signals. IQ Option’s blog says a crossover can catch early trend changes but can also be late or false when price moves sideways, so traders look for extra confirmation. This strategy takes the cross and adds one requirement: after the cross, price must come back to the SMA 4. The rules below spell the strategy out in exact terms, and the tested box repeats them so that you can disagree and rerun them.
Which trading strategy has highest win rate?
This guide cannot name a strategy with the highest win rate, and the tested box below is the only win-rate figure it reports. What decides whether a binary option rule makes money is whether its win rate stays above the break-even rate for the payout. At an 85% payout a trade needs to win more than 54% of the time (1 ÷ 1.85), and at 87% about 53.5%. A rule that wins half of its trades loses money at either payout.
IQ Option’s blog says relying only on crossovers can give late or false signals in slow markets, so traders need extra confirmation. A long average such as the SMA 200 can be used as a filter (buy only above it, sell only below it). That is an idea to test, not a result, and this guide does not test it.
5 minute trading strategy BUY signal
The buy signal has four conditions, all checked on closed one-minute candles:
- The cross. On one candle the SMA 4 closes above the SMA 30 after being at or below it on the candle before.
- The return. After that candle, wait for the first bullish candle (one that closes above its open) whose range, from its low to its high, touches the SMA 4. The SMA 4 must still be above the SMA 30 on that candle. If the SMA 4 crosses back below the SMA 30 first, the setup is cancelled.
- The entry. At the close of that candle, open a Higher option.
- The expiry. Five minutes.
The rule waits for the first bullish candle that touches the SMA 4, even if a bullish candle before it missed the SMA 4. That fits the requirement that price must come back to the SMA 4. A stricter reading would take only the first bullish candle after the cross and skip the setup if that candle does not touch the SMA 4; this guide does not use it.
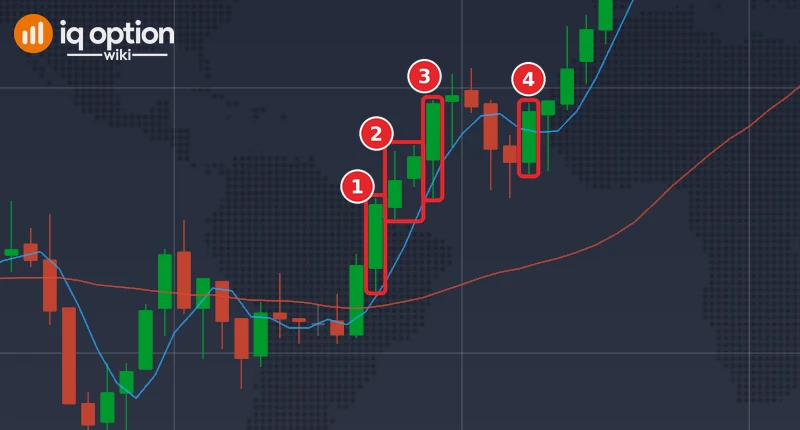
Example on EUR/USD, 2 October 2026 (times in UTC, with the platform clock, UTC-3, in brackets). The SMA 4 crossed above the SMA 30 on the candle that opened at 19:10 (16:10) (1). The next two candles, 19:11 and 19:12, were bullish but did not touch the SMA 4: it stood at 1.12520 and 1.12529, below their lows of 1.125255 and 1.125315 (2), so there was no entry yet. The candle that opened at 19:13 (16:13) was bullish and its range, 1.125295 to 1.125475, contained the SMA 4 at 1.12536 (3). The Higher option opened at its close, 1.12547, and expired at 19:19 (16:19) at 1.125455, 0.000015 lower (4): a loss. The second Higher signal in the same replay, at 20:33 (17:33), entered at 1.125535 and expired at 1.125215: also a loss.
5 minute trading strategy SELL signal
The sell signal is the mirror image: the SMA 4 closes below the SMA 30 after being at or above it; wait for the first bearish candle (one that closes below its open) whose range touches the SMA 4 while the SMA 4 is still below the SMA 30; at its close open a Lower option with a five-minute expiry. The colour of a candle is a chart setting, so this guide defines a candle by its open and close.
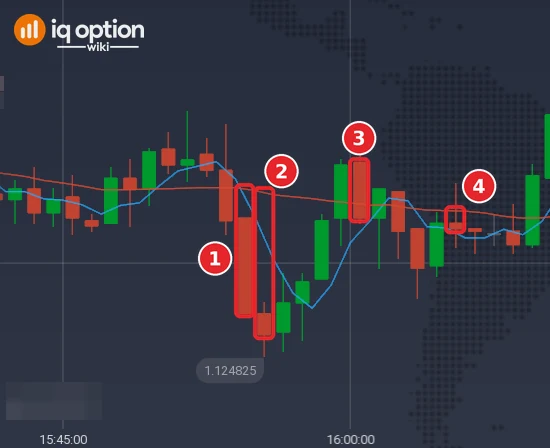
Example on EUR/USD, 2 October 2026 (UTC, platform clock in brackets). The SMA 4 crossed below the SMA 30 on the candle that opened at 18:54 (15:54) (1). The next candle, 18:55, was bearish but stayed below the SMA 4, which stood at 1.125006 while the high of that candle was 1.124925 (2). Four bullish candles followed, which a Lower setup ignores. The candle that opened at 19:00 (16:00) was bearish and its low, 1.125075, touched the SMA 4 at 1.125079 (3), only just. The Lower option opened at its close, 1.125085, and expired at 19:06 (16:06) at 1.125065, 0.00002 lower (4): a win. The second Lower signal, at 19:05 (16:05), entered at 1.125065 and expired at 1.12528: a loss. Of the four example signals, one won and three lost, which is what a short sample looks like.
Tested on IQ Option: 2 to 5 October 2026
| Asset and candles | EUR/USD (binary), one-minute candles recorded from IQ Option’s Practice traderoom, from 2 October 2026 18:23 UTC to 5 October 2026 19:29 UTC: 1,505 candles in two unbroken runs (Friday evening, then Sunday evening to Monday), about 25 hours. |
|---|---|
| Rule tested | On one-minute candles, with SMA(4) and SMA(30) of the closing price. Higher: after SMA(4) closes above SMA(30) on a candle, having been at or below it on the candle before, the first later bullish candle (close above open) whose low-to-high range touches SMA(4), while SMA(4) is still above SMA(30); the option opens at the close of that candle. Lower: the mirror, with a bearish candle and SMA(4) below SMA(30). Each cross gives at most one entry, and a cross the other way cancels it. Expiry: five minutes (five candles) after the entry. A Higher option wins if the close five candles later is above the entry price, a Lower option if it is below; an equal close is a tie. A stricter reading, in which only the first bullish candle after the cross counts, would give fewer signals. |
| Signals | 55 signals: 25 Higher and 30 Lower. Signals are not de-duplicated, and with a five-candle expiry neighbouring trades overlap in time. |
| Outcomes | 31 wins, 23 losses, 1 tie. Win rate of decided trades: 57.4% (31 of 54). Net result per dollar staked at an 85% payout, assumed because the replay placed no orders: +$0.06 (a tie returns the stake). |
| Break-even | At an 85% payout a trade needs to win about 54.1% of the time (1 ÷ 1.85); at 87%, 53.5%; the platform showed 91% on EUR/USD binary on 5 October 2026, which makes it 52.4%. The replay’s win rate is 3.3 percentage points above 54.1%, a gap smaller than the margin of a sample of 54 decided trades (one standard error is about seven points), so it does not show that the rule has an edge. |
A replay on recorded candles shows what one fixed rule did on those candles. The candles were recorded from IQ Option’s Practice traderoom; the replay used no real money and placed no order, and it ignores spread and delays. A short test proves nothing about the future: another asset, another hour or another week can give a different result. IQ Option’s own blog says most strategies need dozens, and often hundreds, of trades before a result means anything. No profit and no win rate is promised here.
Is 5-minute chart good for trading?
This strategy does not use a five-minute chart. It reads a one-minute chart and holds each trade for five minutes.
IQ Option’s blog says the one-minute chart “can help experienced scalpers refine entries, but it is usually too noisy for beginners”, and that it “can make every tiny move look like a signal”. The candle size and the expiry are two separate settings. This strategy fixes both: one-minute candles and a five-minute expiry. If you change either, the results in the tested box no longer apply.
The platform’s asset menu lists Options (Blitz, Binary and Digital), Margin and Trending. This guide uses a Binary option with a five-minute expiry (step 7). For the difference between the option types, see binary and digital options.
Pros and Cons of the 5-Minute Trading Strategy
| Pros | Cons |
|---|---|
| It uses IQ Option’s own Moving Average indicator twice, so no script is needed. | Both lines are simple moving averages of past prices, so they lag. IQ Option’s blog calls a moving average a lagging indicator. |
| The rule is mechanical: a cross, then a touch by a bullish candle (or a bearish one for a Lower signal). It can be replayed on past candles and tried on a Practice balance. | Crossovers can be late or false when price moves sideways, and a sideways market can cross the two lines again and again (IQ Option’s blog). |
| Candle size and expiry are fixed in advance, so the stake is the most you can lose on each trade. | IQ Option’s blog says the one-minute chart is usually too noisy for beginners, and each trade here is decided on one-minute candles. |
| You can put the two lines on any asset’s chart; the replay in the tested box covers EUR/USD only. | In the replay the rule won 57.4% (31 of 54) of its decided trades. At an 85% payout it needs more than 54%. |
Learning and developing the 5 minute trading strategy
No source or test shows that this strategy works better in trending markets or after news releases, so this guide makes no such claim. Developing a rule is slow and plain:
- Change one thing at a time and rerun the whole test. IQ Option’s blog on backtesting says that changing rules during a test invalidates it, and that adjusting rules until they fit past data gives results that rarely hold up.
- Try the EMA instead of the SMA. IQ Option’s blog says the EMA follows price more closely and also gives more false signals, so treat it as a change to test, not as an upgrade. Our EMA guide shows the setup.
- Add a filter and test it on its own. Two examples are the SMA 200 filter and a session filter. IQ Option’s blog on indicator combinations says that more indicators do not automatically improve results and can give different indications and confuse a trader. For session hours see when to trade on IQ Option.
- Count enough trades. IQ Option’s blog says most strategies need dozens, and often hundreds, of trades before a result means anything.
Common mistakes
- Entering before the candle closes. Every condition is read on a closed candle. A candle can touch the SMA 4 for a moment and close somewhere else.
- Changing the candle size or the expiry. The rule and the tested box cover one-minute candles with a five-minute expiry. Anything else is a new strategy that needs its own test.
- Taking every cross in a sideways market. When the two lines keep crossing, each cross starts a new setup. IQ Option’s blog says that when price crosses a moving average repeatedly the market has no clear direction, and that crossovers can give false signals in sideways markets.
- Forgetting that a binary option has no stop loss. The trade closes at its expiry. Choose a stake you can lose in full before you start.
Related guides
- 1-minute binary options strategy with SMA 8/21
- How to trade with the EMA indicator on IQ Option
- Moving average on IQ Option, the simple moving average and trading with the SMA 20
- Expiry times, time frames and Japanese candlesticks
- All indicator guides and all strategy guides
Frequently Asked Questions
Q: Which candle size and expiry does the 5-minute strategy use?
A: One-minute candles and a five-minute expiry. The five minutes are the length of the trade, not the candle size.
Q: What do SMA 4 and SMA 30 mean?
A: They are simple moving averages over the last 4 and the last 30 candles. The SMA 4 follows price closely and the SMA 30 is much slower, so a cross shows the short-term average moving above or below the longer one.
Q: Can the 5-minute trading strategy be used with other time frames?
A: The rule and the tested box here cover one-minute candles with a five-minute expiry only. If you change either setting, treat the result as a new strategy and test it again on the Practice balance.
Q: Is the strategy suitable for all types of assets?
A: We have no result that shows it suits all types of assets. The replay in the tested box covers EUR/USD only.
Q: How can I improve the accuracy of the strategy?
A: No source shows that adding indicators improves accuracy. IQ Option’s blog says that more indicators do not automatically improve results and that they can give different signals and confuse a trader. If you add a filter, test it on its own and with the whole rule.
Q: Can I use the Exponential Moving Average (EMA) instead of the SMA?
A: You can test it. IQ Option’s blog says the EMA gives bigger weights to recent prices, so it follows price more closely, and that it also gives more false signals than the SMA unless you have a method of sorting them out.
Q: How can I manage risk while using the strategy?
A: A binary option has no stop loss: the trade closes at its expiry, and the most you can lose is the stake. Choose the stake before the session, and compare your win rate with the break-even rate: more than 54% at an 85% payout.