
Last updated: 8 October 2026. Every screenshot below was recorded on 8 October 2026 on an IQ Option Practice account registered in Brazil, on one-minute candles. We placed no real-money trade. The tested box has two parts: ten one-dollar orders that we placed on a Practice account on 2 October 2026 while recording our strategy videos, and a replay of the same rule on EUR/USD candles. Neither says anything about what the rule will do next.
The CCI EMA strategy reads the direction from the 50-period exponential moving average (EMA) and the timing from the 14-period Commodity Channel Index (CCI). When price closes above the EMA and stays above it, the first CCI close above +100 is a Higher signal; when price closes below the EMA and stays below it, the first CCI close below -100 is a Lower signal, with one entry for each cross of the EMA. This guide shows how to set up both indicators on IQ Option, how the entries work, and what the rule did in ten Practice orders and in a replay on candles.
Quick answer
- Rule: price closes above EMA 50 and stays above it; the first CCI(14) close above +100 is Higher. The mirror, below EMA 50 and -100, is Lower. One entry for each cross of the EMA.
- Settings: Moving Average with type EMA and period 50; Commodity Channel Index with period 14 and levels at +100 and -100.
- Expiry: three minutes on one-minute candles in our test; the replay also scores a four-minute expiry.
- Practice orders, 2 October 2026: 10 one-dollar orders, 6 won, 4 lost, net +$1.12. Ten orders are too few to say whether the rule has an edge.
- Replay on recorded candles: on 1,505 recorded one-minute EUR/USD candles (2 and 4 to 5 October 2026) the rule as written gave 36 signals. With a three-minute expiry 20 of 36 won (55.6%), a little above the 54.1% break-even rate at an 85% payout (a net of +$0.03 per $1 staked); with a four-minute expiry 19 of 36 won (52.8%), a little below it. The difference is one trade.
- Break-even: at an 85% payout a trade needs to win about 54.1% of decided trades (1 ÷ 1.85).
Chart preparations for CCI EMA strategy
These steps use the web traderoom on a Practice balance. The numbers in each screenshot match the numbers in the text. Choose the asset first (see choosing a trading asset), and if you do not have an account yet, start with our registration guide.
Step 1: Open Chart analysis
Click the indicators button (1), the wave icon in the toolbar at the bottom left of the chart. It opens the Chart analysis panel, which has the tabs Indicators, Templates, Widgets and Scripts.

Step 2: Find the Moving Average indicator
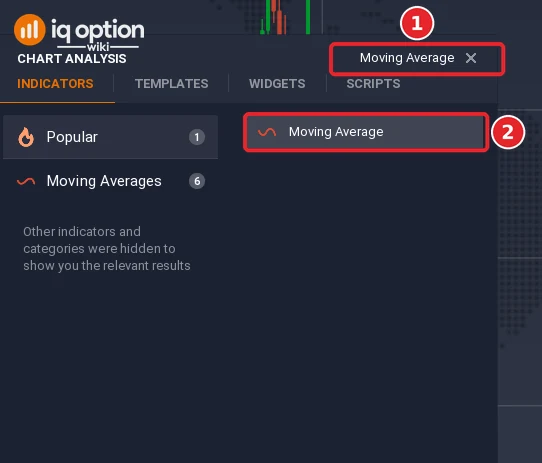
On the Indicators tab, type “Moving Average” in the search box (1) and click Moving Average in the results (2). IQ Option’s blog also lists it among the popular indicators. It is one indicator with a Type setting, so the same entry gives a simple average (SMA), an exponential average (EMA) and the other types.
Step 3: Set the type to EMA and the period to 50
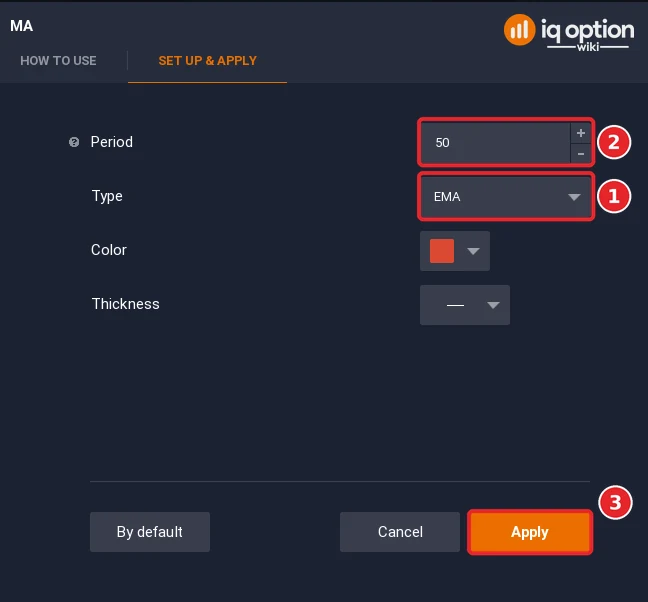
In the dialog, open Set up & apply. Set Type to EMA (1) and Period to 50 (2), then click Apply (3). An EMA gives more weight to recent prices than a simple average does, and a period of 50 means the last 50 candles, which is 50 minutes on one-minute candles. The line is drawn over the price candles.
Step 4: Add the Commodity Channel Index with period 14
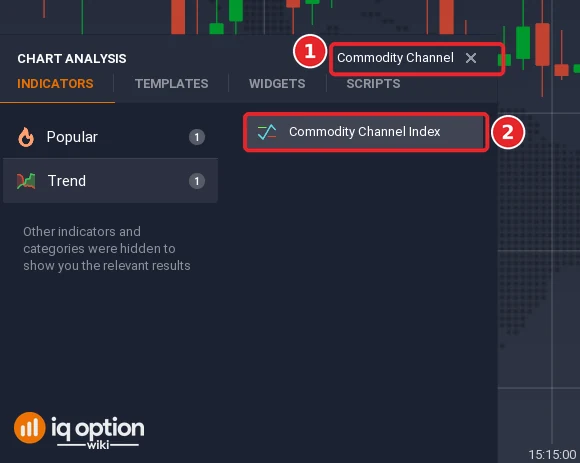
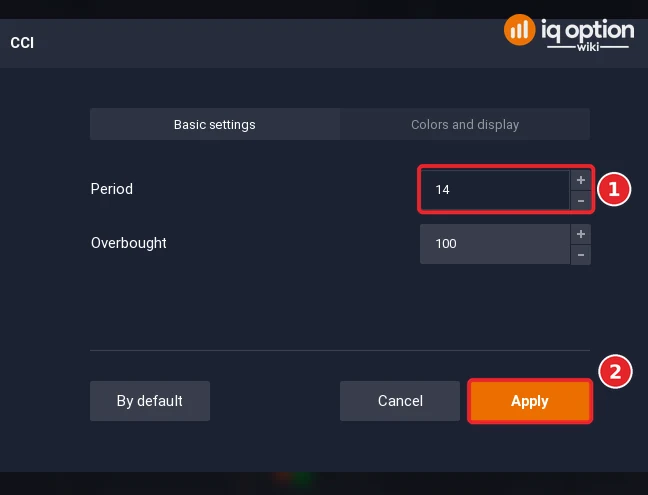
Open Chart analysis again, type “Commodity Channel” in the search box (1) and click Commodity Channel Index (2). The dialog (second picture) opens on Basic settings with Period 14 and Overbought 100, the two values the rule uses. Check that the Period reads 14 (1), leave the other field as it is and click Apply (2). The CCI opens in a panel under the price chart.
Step 5: Use one-minute candles
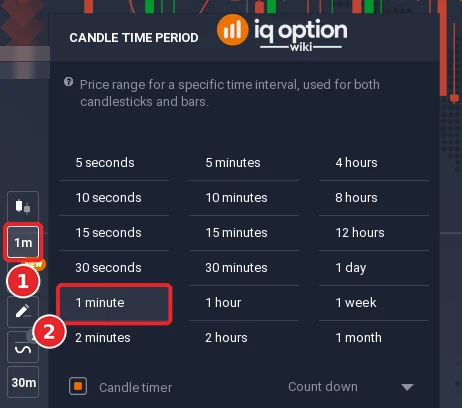
The Practice orders and the replay below used one-minute candles. Click the candle time period button in the toolbar at the bottom left (1) and choose 1 minute (2). Our guide to time frames on IQ Option covers the other sizes.
Step 6: Read the chart
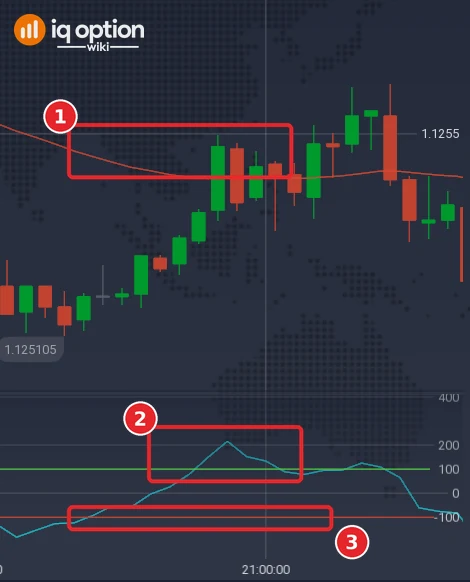
The EMA 50 (1) runs over the candles. The CCI line (2) moves in the panel below, and the lines at +100 and -100 (3) mark the levels the rule uses.
The CCI EMA strategy
The EMA is used for trend identification, and the CCI gives the signal to enter. IQ Option’s blog says that when price stays above a moving average the market often holds a bullish structure, and when it stays below, a bearish one. The rule below uses closed candles only, and it is the rule tested in the box further down.
Opening the long position with CCI EMA strategy
A long position is a Higher option on a binary option and a buy on a CFD. The example below numbers the same three items.
- Trend: a candle closes above the EMA 50 after closing on or below it, and price stays above the line.
- Signal: the CCI closes above +100 for the first time since that cross.
- Entry: open Higher at the close of that candle. The Practice orders used a three-minute expiry on one-minute candles, and the replay also scores a four-minute expiry.
Do not open a second position until price crosses the EMA again, even if the CCI is still above +100.
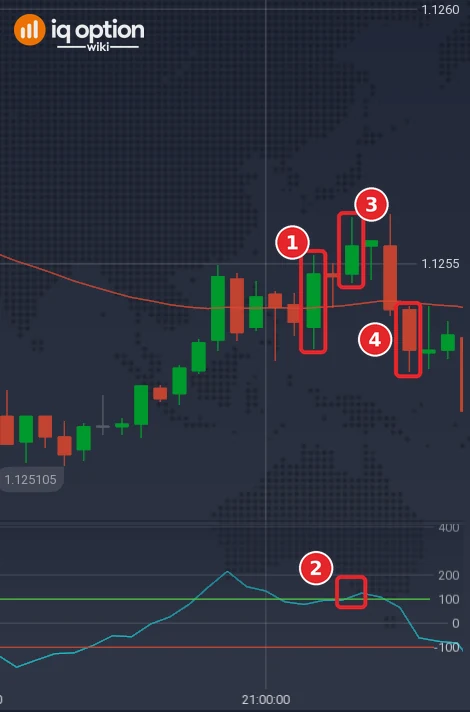
The first Higher signal in the candles we recorded came on 5 October 2026 (the platform clock, which runs three hours behind UTC, still showed 4 October). The candle that opened at 00:01 UTC (21:01 platform time) closed below the EMA 50, and the candle at 00:02 UTC (21:02) closed above it (1); price stayed above the line. The CCI had not closed above +100 since that cross, and the candle at 00:04 UTC (21:04) took it from about 96 to about 125 (2). The entry is the close of that candle (3), 1.125535 at 00:05 UTC (21:05). With a three-minute expiry the exit was the close of the candle that opened at 00:07 UTC (4), 1.12533 at 00:08 UTC (21:08). That is below the entry, so this Higher order lost. The second Higher signal (04:31 UTC) won. Neither this example nor the one below comes from the ten Practice orders; both are read on the recorded candles.
Opening the short transaction with CCI EMA strategy
A short position is a Lower option on a binary option and a sell on a CFD. The rule is the mirror image:
- Trend: a candle closes below the EMA 50 after closing on or above it, and price stays below the line.
- Signal: the CCI closes below -100 for the first time since that cross.
- Entry: open Lower at the close of that candle, with the same expiry.
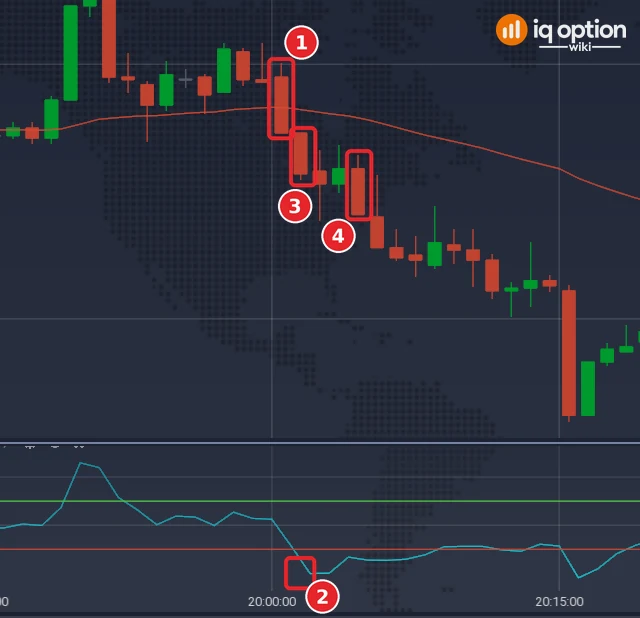
The first Lower signal that is visible in our chart picture came on 4 October 2026. The candle that opened at 23:00 UTC (20:00 platform time) closed at 1.125865, below the EMA 50, after a close above it (1), and price stayed below the line. The CCI closed below -100 for the first time since that cross at 23:01 UTC (20:01): from about -85 to about -200 (2). The entry is the close of that candle (3), 1.125785 at 23:02 UTC (20:02). The exit is the close of the candle that opened at 23:04 UTC (4), 1.125705 at 23:05 UTC (20:05). That is below the entry, so this Lower order won. This signal lies in the first 150 candles of the recorded stretch, which the replay in the box skips so that its EMA can settle, so it is not one of the replay’s 36 signals; the first Lower of the replay (00:10 UTC on 5 October, a win) falls past the right edge of this picture.
Tested on IQ Option: Practice orders of 2 October 2026 and a replay run on 8 October 2026
| Asset and candles | Practice orders: ten one-dollar orders on a Practice account, placed one at a time when the rule marked a closed one-minute candle, while we recorded our strategy videos: EUR/GBP (2 orders), USD/JPY (4), AUD/CAD (2), AUD/USD (1) and GBP/USD (1). The scans that found them started between 13:37 and 14:58 UTC on Friday 2 October 2026. Replay: EUR/USD binary (regular, not OTC), 1,505 one-minute candles recorded from IQ Option’s Practice traderoom in two stretches: 2 October 2026, 18:23 to 20:59 UTC (157 candles), and 4 October 2026, 21:01 to 5 October 2026, 19:28 UTC (1,348 candles). The replay places no orders; it only scores the rule on those closed candles, at an 85% payout. Signals start 150 candles into each stretch, so that the EMA has settled; that leaves only the last 7 candles of the 157-candle stretch. |
|---|---|
| Rule tested | On one-minute candles, after price closes above EMA 50 (and stays above), the first CCI(14) close above +100 is Higher; the mirror below EMA 50 and -100 is Lower; one entry per EMA cross (a first CCI break that falls inside the warm-up counts as that cross’s entry, so no later signal is taken in the same run); expiry three minutes after that close. |
| Signals | Practice orders: 10, of which 4 Higher and 6 Lower. Replay: 36 (17 Higher, 19 Lower) for the rule as written, with the same 36 entries for the three-minute and the four-minute expiry. As a documented alternative, the library script IQOW EMA50 CCI 100 (first CCI break within 15 candles of the EMA cross) marked 49 (23 Higher, 26 Lower) on the same candles. |
| Outcomes | Practice orders: 6 won, 4 lost, none refunded; net +$1.12 on $10 staked. Higher: 3 of 4 won. Lower: 3 of 6 won. The five wins on EUR/GBP, AUD/CAD, AUD/USD and USD/JPY paid 85%; the GBP/USD win paid 87%. Replay: three-minute expiry: 20 won, 16 lost, none refunded; 55.6% of 36 decided trades; net +$0.03 per $1 staked (Higher 9 of 17 won, Lower 11 of 19). Four-minute expiry: 19 won, 17 lost; 52.8%; net −$0.02 (Higher 10 of 17, Lower 9 of 19). Library script, three minutes: 26 won, 23 lost; 53.1% of 49; net −$0.02 per $1. The rule as written ended 1.5 points above the break-even rate with a three-minute expiry and 1.3 points below it with four minutes; the two results differ by one trade, so the replay shows no edge either way. |
| Break-even | At an 85% payout a trade needs to win more than 54% of decided trades (1 ÷ 1.85); at 87%, 53.5%. Six wins in ten orders is 60%. |
Ten orders on five currency pairs are too few to tell a rule that works from luck: a coin that wins half of its tosses still gives six or more wins in ten about 38% of the time. The replay placed no real orders and is limited to the candles it was run on: about 25 hours of candles of one pair, with 36 signals, where a win rate anywhere from roughly 40% to 70% would fit the result (95% interval). Neither result says what the rule will do on the next candle, and nothing here is a promise of profit or of any win rate.
How do traders use the CCI?
The CCI compares the current price with its recent average: above zero, price is higher than that average, and below zero it is lower. The line has no fixed limits, so it can go far past +100 and -100. IQ Option’s CCI guide gives two readings. It says that Donald Lambert, who created the indicator in the 1970s, assumed that price moves within certain intervals and is likely to bounce back soon after it leaves them. It also describes a CCI line that crosses +100 as a possible sign of a bullish market, and one that crosses -100 as a possible sign of a bearish market, a moment when some traders consider an entry. This strategy uses the second reading and adds the EMA, so it only takes the crossing that points the same way as the trend.
That is why the strategy opens a Lower option when the CCI falls below -100, a reading that the bounce-back approach would treat as a reason to expect a rise. A market can keep falling while the CCI is below -100, and keep rising while it is above +100. The CCI can also show divergence, which IQ Option’s guide says may point to a weakening trend. This strategy does not use it, but our CCI divergence strategy does.
Which indicator works best with CCI?
IQ Option’s sources do not rank partners for the CCI, and we tested no other pairing, so we cannot say which one works better. They do give a general rule: combine indicators from different groups instead of several of one type, because two indicators that do the same thing add “information overload”. The EMA follows the trend and the CCI is an oscillator, so this pair follows that rule. IQ Option’s blog gives a simple moving average with the Stochastic Oscillator as another example of a moving average paired with an oscillator. Our guide to the EMA indicator covers the moving average side.
Pros and Cons of the CCI EMA Strategy
| Pros | Cons |
|---|---|
| The rule is short and uses two common indicators that are built into the platform. | When price moves sideways it crosses the EMA often, so each run on one side is short and the trend filter flips often. |
| The EMA sets the side and the CCI times the entry, so each indicator has one job. | A CCI break can come late in a move that is already extended. |
| Only one entry is allowed for each cross of the EMA, which limits how often the rule fires. | The rule gives no exit beyond holding the option to its expiry, and a binary option has no stop loss or take profit. |
Common mistakes
- Entering before the candle closes. The CCI line keeps moving while a candle forms, so a cross of +100 can appear and vanish within the candle. The rule and the library script use closed candles.
- Taking a CCI signal against the EMA side. A CCI close above +100 while price is below the EMA is not a signal in this rule.
- Entering twice in the same run. The rule allows one entry for each cross of the EMA, even if the CCI stays beyond the level.
- Changing the periods between trades. A different EMA or CCI period is a different rule. The Practice orders and the replay cover EMA 50 and CCI 14 only.
- Expecting a stop loss on a binary option. A binary option has no stop loss and no take profit; you choose the direction, the stake and the expiry. A CFD (margin) trade has both.
Final words
The strategy comes down to two observations on closed candles: which side of the EMA 50 price is on, and whether the CCI(14) has just closed beyond +100 or -100 on that side. Changing the periods makes a different rule, and the test above covers only EMA 50 and CCI 14. The Practice balance uses virtual money, starts at $10,000 and has a “Refill to $10,000” button, so you can count your own results there before you risk money. Count many more trades than ten, and compare your win rate with the break-even rate for the payout you see.
Related guides
- How to trade with the EMA indicator on IQ Option
- Woodies CCI on IQ Option, which combines two CCI lines in one panel
- CCI divergence strategy at IQ Option
- MACD, Parabolic SAR and EMA strategy
- Strategy with 3 consecutive candles
- Identifying a trend at IQ Option
- IQ Option scripts library, with the IQOW EMA50 CCI 100 script that marks this rule on your chart
- All indicator guides and all strategy guides
Frequently Asked Questions
Q: How do I identify an uptrend with the EMA?
A: In this strategy an uptrend is present when price closes above the EMA 50 and stays above it. IQ Option’s blog on moving averages says that price which stays above the line often goes with a bullish structure.
Q: How do I identify a downtrend with the EMA?
A: In this strategy a downtrend is present when price closes below the EMA 50 and stays below it. The same blog says that price which stays below the line usually goes with a bearish structure.
Q: What are the recommended settings for the EMA and CCI?
A: The rule uses an EMA with period 50 and a CCI with period 14, with the levels at +100 and -100. We tested no other values, and a different setting makes a different rule.
Q: How long should I hold a trade open?
A: The rule holds the trade for three minutes, which is three candles on a one-minute chart; the Practice orders used that expiry. The replay also scores a four-minute expiry, and the two results differ by one trade.
Q: Can I combine the CCI EMA strategy with other indicators?
A: You can put more indicators on the chart, but this rule and its tests use only the two. IQ Option’s blog advises against overdoing it: it says that having many indicators on a chart does not automatically improve results.
Q: What win rate does the strategy need to make money?
A: At an 85% payout a trade needs to win more than 54% of decided trades to break even (1 ÷ 1.85); at 87%, 53.5%. Read the payout next to the asset when you trade, because it changes.
Q: Can I add the rule as a script?
A: Yes. The IQ Option scripts library has IQOW EMA50 CCI 100, which marks the rule on the chart. It also asks for the first CCI break to come within 15 candles of the EMA cross, which the rule as written does not require. Import it as shown in our scripts guide.

