
Last updated: 8 October 2026. Every screenshot below was recorded on 8 October 2026 on an IQ Option Practice account registered in Brazil, on EUR/USD 5-minute candles; the Chart analysis picture in Step 1 was recorded on 5 October 2026. We placed no real-money trade. The tested box shows what one reading of the rule did on EUR/USD candles recorded between 29 September and 5 October 2026. No candle size and no expiry is given, so those are ours; the result says nothing about what will happen next.
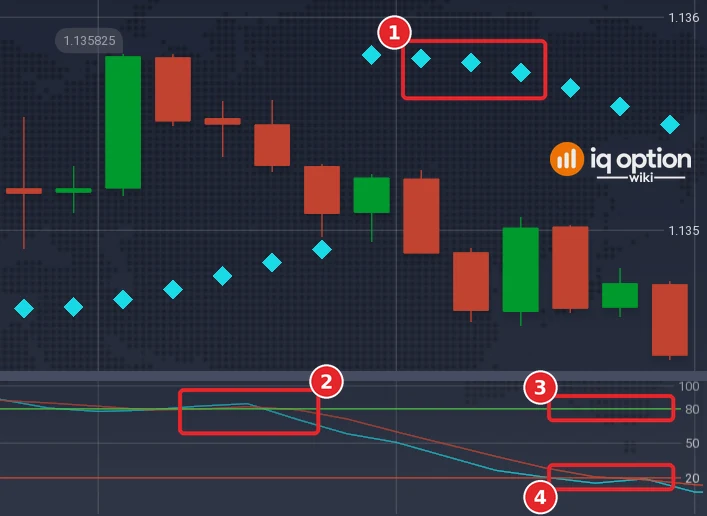
The strategy asks for three things at once. For a call (Higher) option, both Stochastic lines are under 20, the %K line crosses the %D line from below, and the Parabolic SAR dots are below the candles. For a put (Lower) option, both lines are over 80, %K crosses %D from above, and the dots are above the candles. The setup is rare: on the five-minute EUR/USD candles recorded between 29 September and 5 October 2026 (1,214 checked, after the first 60 candles of each unbroken stretch, which the indicators need to warm up) the Stochastic lines crossed inside the 20 zone 53 times and the 80 zone 46 times, but the SAR dots were on the matching side only 3 times, all of them Lower. Those three 15-minute trades won 1 and lost 2, and on 1-minute candles the 5 signals won 2, lost 2 and tied 1. That is far too few trades to judge the strategy.
Quick answer
- Stochastic Oscillator: the platform’s defaults, Period K 13, Smoothing 3, Period D 3, with the lines at 80 and 20.
- Parabolic SAR: default settings, an acceleration step of 0.02 and a maximum of 0.2.
- Higher (call): %K and %D both under 20, %K crosses above %D, and the SAR dots are below the candles.
- Lower (put): %K and %D both over 80, %K crosses below %D, and the SAR dots are above the candles.
- Candles and expiry: not prescribed; we replayed 5-minute candles with a 15-minute trade and 1-minute candles with a 5-minute trade.
- Tested: 3 signals on 5-minute candles (1 won, 2 lost) and 5 on 1-minute candles (2 won, 2 lost, 1 tied). Break-even is 54.1% at an 85% payout, and a few days of one pair prove nothing.
How do you set up the Stochastic and Parabolic SAR strategy?
Set the chart
Choose the asset, the chart type and the candle size first: the indicators are calculated from the candles on the chart. The examples in this guide use 5-minute candles on EUR/USD. These steps use the web traderoom on a Practice balance, and the numbers in each screenshot match the numbers in the text. If you do not have an account yet, see how to register.
Step 1: Open Chart analysis
Click the indicators button (1), the wave icon in the chart toolbar at the bottom left of the chart. The Chart analysis panel opens with the tabs Indicators, Templates, Widgets and Scripts. Stay on Indicators.

Step 2: Find the Stochastic Oscillator
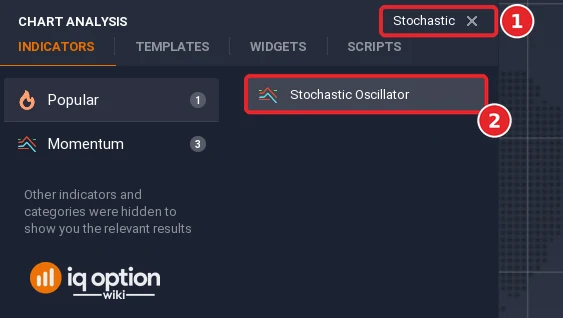
Type “Stochastic” in the Search for indicators box (1) and click Stochastic Oscillator (2), the entry in the Popular list. The search also lists other indicators under Momentum; choose the one called Stochastic Oscillator, not the Stochastic RSI.
Step 3: Check the Stochastic settings
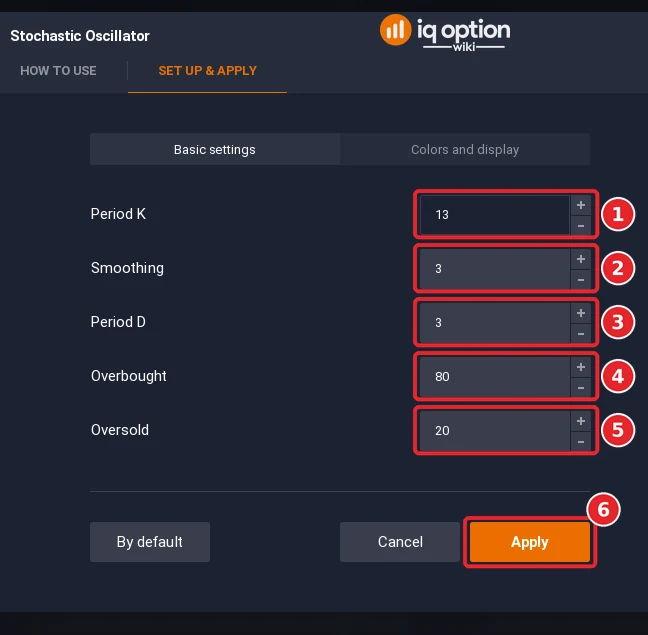
The dialog opens on the Set up & apply tab, on Basic settings, with Period K 13 (1), Smoothing 3 (2), Period D 3 (3), Overbought 80 (4) and Oversold 20 (5). The strategy does not change them; click Apply (6).
Step 4: Add the Parabolic SAR with its default settings
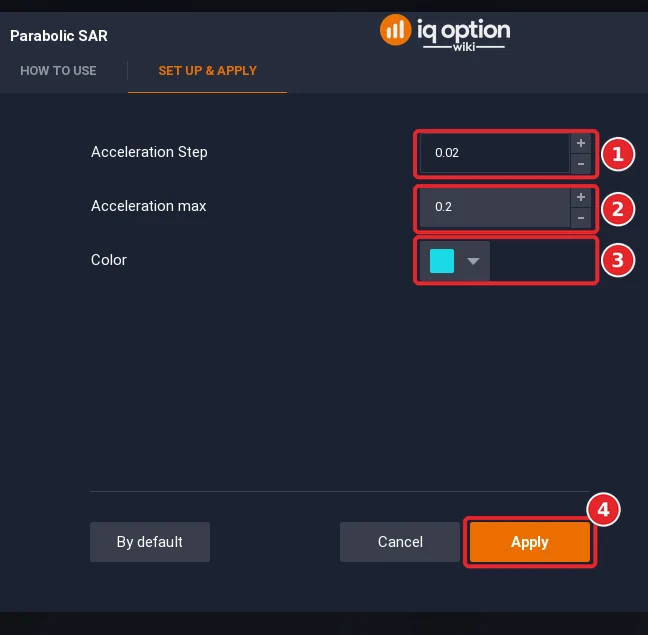
Open Chart analysis again, search for “Parabolic” and click Parabolic SAR. The dialog opens with the Acceleration Step at 0.02 (1), the Acceleration max at 0.2 (2) and the Color (3); the strategy keeps them. Click Apply (4).
Step 5: Use 5-minute candles
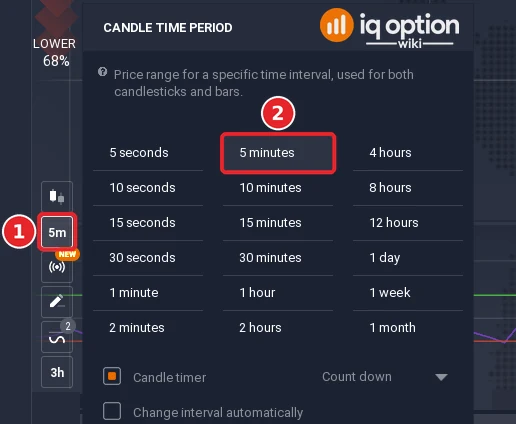
Click the candle time period button (1) in the toolbar at the left of the chart; it shows the current period, 5m in the picture. In the menu that opens, choose 5 minutes (2). Use the candlestick chart type.
Step 6: Read the chart
The SAR dots are drawn on the price chart (1). The Stochastic panel sits under it, with the %K line, in cyan, and the %D line, in red-orange (2), and the lines at 80 (3) and 20 (4); the scale at the right edge gives 100, 80, 50 and 20.
What does each indicator add?
The Stochastic Oscillator compares the latest close with the highest high and the lowest low of the last candles (13 by default on the platform), and smooths the result into two lines, %K and %D, between 0 and 100. It is credited to Dr George Lane in 1950; the area under 20 is read as oversold and the area over 80 as overbought, and a crossing of %K over %D as the moment the market gains or loses speed.
The Parabolic SAR puts a dot under each candle in an uptrend and over it in a downtrend. On its own the SAR works only in strong long-term trends, and its dots can also serve as a moving stop-loss level. In this strategy the Stochastic gives the confirmation of the entry.
What are the entry rules?
The strategy describes two pictures, a call and a put, without numbers for the candle size or the expiry. Written so that every condition is checked on closed candles:
| Part | Rule |
|---|---|
| Higher (call) signal | On the candle, %K crosses above %D, both lines are under 20, and the SAR dot is below the candle |
| Lower (put) signal | On the candle, %K crosses below %D, both lines are over 80, and the SAR dot is above the candle |
| Entry | At the close of the signal candle |
| Expiry | Not given; 15 minutes on 5-minute candles, 5 minutes on 1-minute candles in our replay |
The distance between %K and %D is also watched: when the gap grows the trend builds up, and when it narrows the trend will probably reverse. That is a thing to observe, not a rule, so we did not test it.
Why is the setup so rare?
The two indicators answer the same question at different speeds. When the price has fallen far enough to push both Stochastic lines under 20 and %K turns up through %D, the Parabolic SAR dots are normally still above the candles, because the dots flip only after the price has touched them. Among the 1,214 five-minute candles checked, %K crossed above %D inside the oversold zone 53 times and the dots were below the candles on none of those candles. At the top, %K crossed below %D inside the overbought zone 46 times and the dots were above the candles on 3. Among the 1,385 one-minute candles checked the counts were 54 with 3 matching and 56 with 2 matching.
This is a fact about the recording, not a flaw of the rule as written, but it means that a trader waiting for this picture will wait a long time.
An example of the put setup, step by step
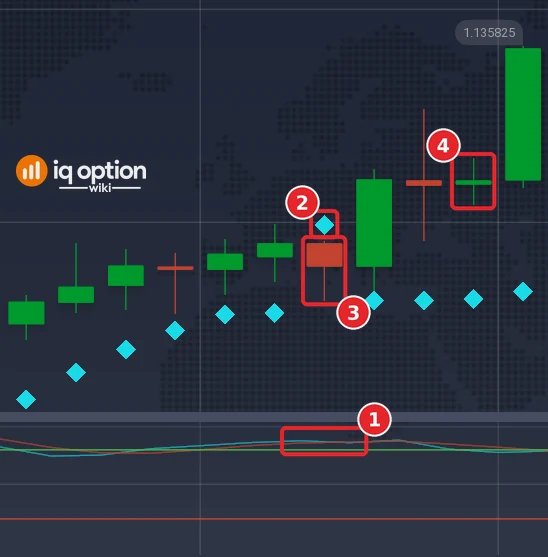
The first signal of the rule on 5-minute candles was a Lower signal; the Higher setup did not occur on 5-minute candles in our recording. All times are the platform clock, which is UTC minus three hours; the date is 29 September 2026.
The Stochastic lines were over 80 and the SAR dots were above the candles. At the close of the candle before the signal %K stood at 87.87 and %D at 85.91, %K over %D. The signal candle (3) opened at 08:40 and closed at 08:45 at 1.134795. At that close %K was 86.23 and %D 86.79: %K had crossed below %D (1) with both lines over 80, and the SAR dot (2), at 1.134990, lay above the candle, 0.8 pip over its high. All three conditions held, so the rule says Lower and the trade opens at that close. A 15-minute trade ends at 09:00, when the candle (4) closes at 1.135195, 4 pips higher: it lost. The cross is a hair’s breadth, 0.56 of a point, and the lines had been close together for an hour, which is typical of a market that stays in the zone.
The Stochastic and Parabolic SAR rule, tested
We scored the rule on the 1,334 five-minute candles of our recording and on the 1,505 one-minute candles, entering at the close of every signal candle.
Tested on IQ Option: the Stochastic and Parabolic SAR rule, EUR/USD candles of 29 September to 5 October 2026
| Asset and candles | EUR/USD binary (regular, not OTC): 1,334 five-minute candles (2026-09-29 01:55 to 2026-10-02 20:55 UTC and 2026-10-04 21:00 to 2026-10-05 17:00 UTC); 1,505 one-minute candles (2026-10-02 18:23 to 2026-10-02 20:59 UTC and 2026-10-04 21:01 to 2026-10-05 19:28 UTC). The candles were recorded from IQ Option’s Practice traderoom. The replay places no orders; it only scores the rule on those closed candles, at an 85% payout. |
|---|---|
| Rule tested | The rule on closed candles, the option opening at the close of the signal candle: Higher when %K crosses above %D with both lines under 20 and the SAR dot is below the candle, Lower when %K crosses below %D with both lines over 80 and the dot is above the candle. Stochastic (13, 3, 3) and Parabolic SAR (0.02, 0.2) as the platform draws them. The box lists 5-minute candles with a 15-minute trade and 1-minute candles with a 5-minute trade. |
| Signals | Stochastic 13,3,3 in the zones and SAR, 5-minute candles, 15-minute trade: 3 signals (0 Higher, 3 Lower) same, 1-minute candles, 5-minute trade: 5 signals (3 Higher, 2 Lower) |
| Outcomes | Stochastic 13,3,3 in the zones and SAR, 5-minute candles, 15-minute trade: 1 won, 2 lost, 0 tied; 33.3% of the 3 decided trades won; net −$0.38 per $1 staked at 85% (−$0.36 at 91%) same, 1-minute candles, 5-minute trade: 2 won, 2 lost, 1 tied; 50.0% of the 4 decided trades won; net −$0.06 per $1 staked at 85% (−$0.04 at 91%) |
| Break-even | At an 85% payout a trade needs to win more than 54.1% of its decided trades to break even (1 ÷ 1.85); at 91%, more than 52.4% (1 ÷ 1.91). |
A replay is only a look back at candles recorded on the dates above: it placed no real orders, covers about four and a half days of one pair, and counts overlapping trades as if they were independent. A short test proves nothing about the future, and no profit and no win rate is promised here. IQ Option’s own blog on backtesting says that most strategies need dozens, and often hundreds, of trades before a result means anything.
On 5-minute candles the rule gave 3 signals, all Lower: 1 won and 2 lost. On 1-minute candles it gave 5 signals (3 Higher, 2 Lower): 2 won, 2 lost and 1 tied. With so few trades the 95% intervals run from 6% to 79% and from 15% to 85%. The numbers neither support nor contradict the strategy; they show that a test of this strategy needs weeks of candles, not days.
Pros and Cons of the Stochastic and Parabolic SAR strategy
| Pros | Cons |
|---|---|
| Two indicators that must agree, so false signals are filtered out. | They rarely agree: 3 matching signals in 1,334 five-minute candles. |
| Clear picture for a call and for a put. | No candle size, no expiry and no stop rule for binary options is given. |
| Both indicators are on the platform and take their defaults. | The strategy needs a thorough understanding of both indicators and is not for beginners. |
Common mistakes
- Entering on the %K cross alone. The SAR dots have to be on the matching side too.
- Entering when only one Stochastic line is in the zone. The put picture has both lines over 80, and our rule asks for both lines in the zone on both sides.
- Reading the cross on an unfinished candle. The lines move until the candle closes.
- Choosing the Stochastic RSI by mistake. It is a different indicator that sits next to the Stochastic Oscillator in the list.
- Waiting for the SAR to flip first. Then the Stochastic has usually left the zone.
Related guides
- Stochastic on IQ Option and Parabolic SAR on IQ Option
- RSI, Stochastic and EMA 200 and Double Stochastic
- MACD and Parabolic SAR
- All indicator guides and all strategy guides
Frequently Asked Questions
Q: What is the Stochastic and Parabolic SAR strategy?
A: A strategy that waits for a crossing of the two Stochastic lines in the oversold or overbought area while the Parabolic SAR dots show the matching side.
Q: What are the call and put rules?
A: Call: both Stochastic lines under 20, %K crossing above %D, SAR dots below the candles. Put: both lines over 80, %K crossing below %D, SAR dots above the candles.
Q: What settings does the Stochastic have on IQ Option?
A: The dialog opens with Period K 13, Smoothing 3 and Period D 3, and the lines at 80 and 20.
Q: How long should the trade last?
A: No expiry is given. We tried 15 minutes on 5-minute candles and 5 minutes on 1-minute candles.
Q: Does the strategy win?
A: We could not tell. The setup came up 3 times on 5-minute candles and 5 times on 1-minute candles in our recording, which is too few trades.
Q: Is it suitable for beginners?
A: It is not, without a solid understanding of both indicators. Try it on a Practice balance first.

