Last updated: 8 October 2026. Every screenshot below was recorded on 8 October 2026 on an IQ Option Practice account registered in Brazil, on EUR/USD 5-minute candles; the Chart analysis picture in Step 1 was recorded on 5 October 2026. We placed no real-money trade. The settings come from the platform’s dialog. The tested box shows what the flip signal did on EUR/USD candles recorded between 29 September and 5 October 2026. The indicator is said to work best on longer time frames, which our recording of 5-minute and 1-minute candles cannot test; the result says nothing about what will happen next.
The Parabolic SAR (SAR stands for Stop And Reverse) draws a series of dots on the price chart: below the candles while the price rises and above them while it falls. When the price touches the dots, they jump to the other side, and the rule treats that jump as the start of a reversal: after the dots break below the price it looks at the first candle that develops, and if it is bullish it buys; after they break above the price, a bearish candle is a sell. The platform opens the indicator with an acceleration step of 0.02 and a maximum of 0.2. On 5-minute EUR/USD candles recorded between 29 September and 5 October 2026 the rule gave 55 signals; the 5-minute trades won 32 and lost 23 (58.2%), the 15-minute trades 24 and 31 (43.6%), and the 30-minute trades 26 and 29 (47.3%). The three expiries disagree, so the sample shows no clear result.
Quick answer
- What it plots: dots on the price chart, below the candles in an uptrend and above them in a downtrend.
- Settings on the platform: Acceleration Step 0.02 and Acceleration max 0.2.
- Flip: the dots jump to the other side of the candles; in our recording that happened 117 times in 1,332 five-minute candles, a run of 11 candles on average.
- Higher: the dots break below the price and the first candle after the break is bullish (green).
- Lower: the dots break above the price and the first candle after the break is bearish (red).
- Tested: 55 signals; 5-minute trades 58.2% of the decided trades, 15-minute trades 43.6%, 30-minute trades 47.3%. Break-even is 54.1% at an 85% payout, and a few days of one pair prove nothing.
How do you add the Parabolic SAR on IQ Option?
Set the chart
Choose the asset, the chart type and the candle size first: the indicator is calculated from the candles on the chart. The examples in this guide use 5-minute candles on EUR/USD. These steps use the web traderoom on a Practice balance, and the numbers in each screenshot match the numbers in the text. If you do not have an account yet, see how to register.
Step 1: Open Chart analysis
Click the indicators button (1), the wave icon in the chart toolbar at the bottom left of the chart. The Chart analysis panel opens with the tabs Indicators, Templates, Widgets and Scripts. Stay on Indicators.

Step 2: Find the Parabolic SAR
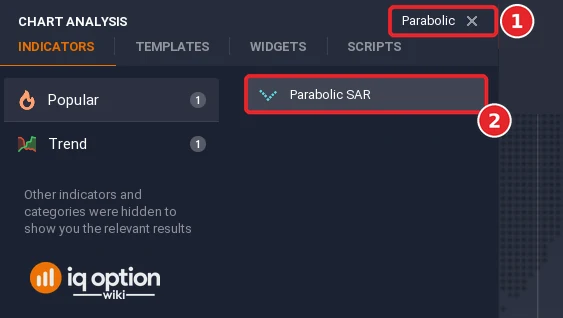
Type “Parabolic” in the Search for indicators box (1) and click Parabolic SAR (2). It is listed under Popular and under Trend.
Step 3: Check the settings
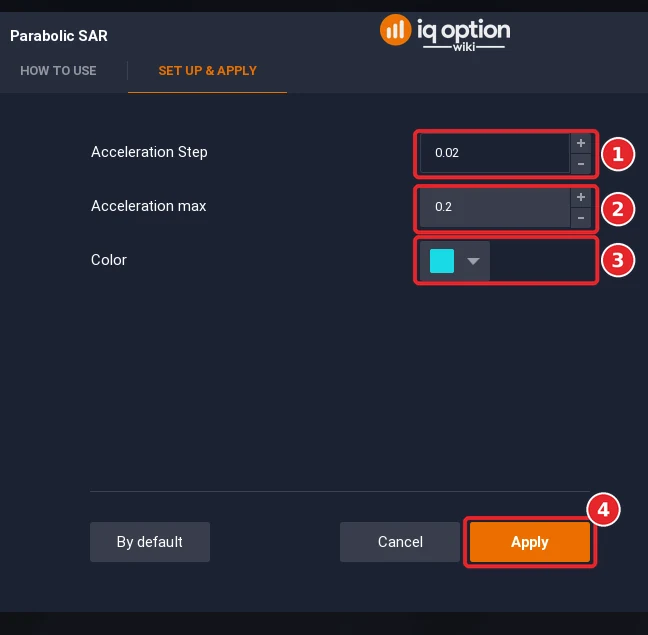
The dialog opens on the Set up & apply tab with the Acceleration Step at 0.02 (1), the Acceleration max at 0.2 (2) and the Color (3), cyan by default. Leave them as they are and click Apply (4).
Step 4: Use 5-minute candles
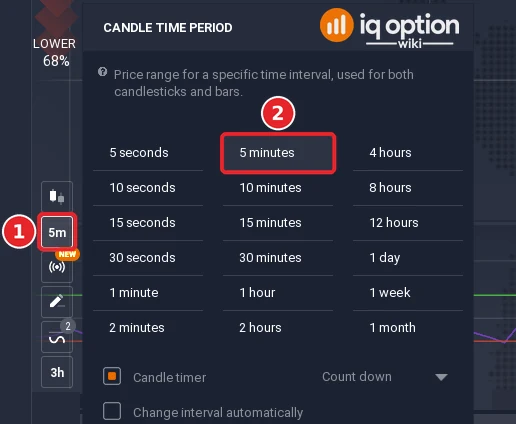
Click the candle time period button (1) in the toolbar at the left of the chart; it shows the current period, 5m in the picture. In the menu that opens, choose 5 minutes (2). The indicator is said to work best on longer time frames, 15-minute or hourly charts, and not on 1-minute charts; our examples use 5-minute candles.
Step 5: Read the dots
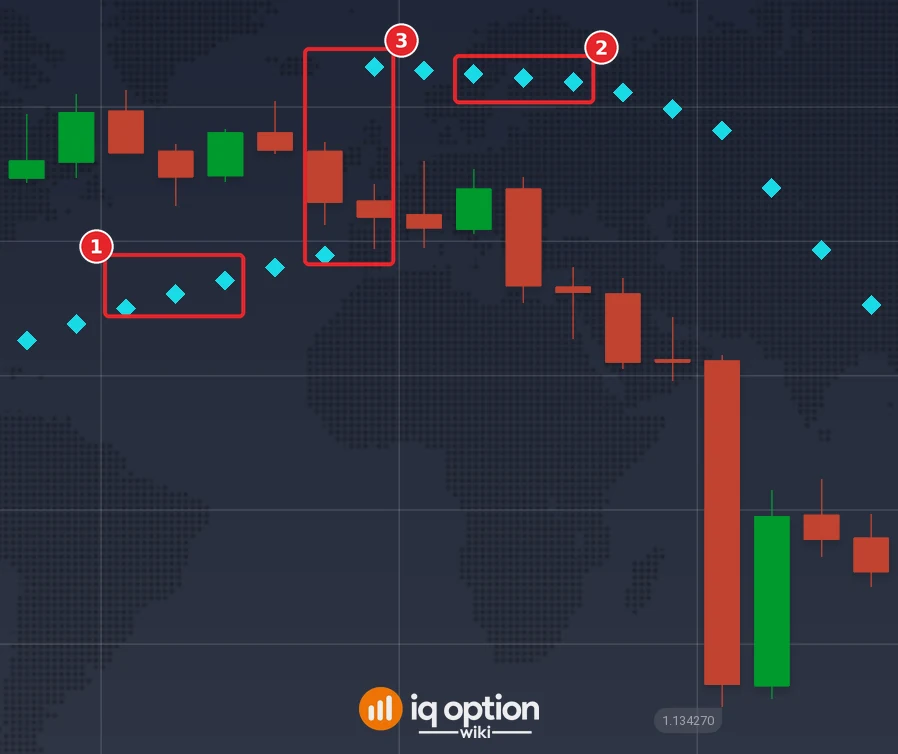
The dots are drawn on the price chart, one for each candle: below the candles while the price rises (1) and above them while it falls (2). When the price touches the dots, they jump to the other side (3).
How does the Parabolic SAR work?
The Parabolic SAR is a price-and-time indicator. Each dot is placed from the previous dot and the extreme price of the current trend, and moves toward the price by a fraction of the distance. The fraction, the acceleration, starts at the step (0.02) and grows by the step each time the price makes a new high in an uptrend (or a new low in a downtrend), up to the maximum (0.2). That is why the dots curve toward the price, like a parabola. When a candle touches the dot, the indicator stops and reverses: the next dot appears on the other side of the candles, and the acceleration starts again.
The dots can also serve as a moving stop-loss level, and the indicator is most reliable on longer time frames.
What is the flip signal?
The rule trades the reversals: enter early, before the trend is exhausted. Watch the first dot that appears after the indicator breaks the price, then the first candle that develops. Written so that every condition is checked on closed candles:
| Part | Usual rule | Our rule for the replay |
|---|---|---|
| Flip | The dots break the price and appear on the other side | The dots are on the other side of the candles on candle j-1 |
| Higher signal | The trend was down, the SAR breaks below the price, and the first candle that starts developing is bullish | The dots jumped below the price on candle j-1 and candle j is bullish and the dots are still below it |
| Lower signal | The trend was up, the SAR breaks above the price, and the first candle after the break is bearish | The mirror |
| Entry | Not stated exactly | At the close of candle j |
| Expiry | Not stated; short trades are said to lose most of the time | 5, 15 and 30 minutes on 5-minute candles |
When the dots stay on one side the trend is sustained; a long trade then most likely ends a winner, while short trades will mostly lose.
Two signals of the recording, step by step
The first Lower signal and the first Higher signal of the rule on 5-minute candles, in time order, not picked by outcome. All times are the platform clock, which is UTC minus three hours; the date is 29 September 2026.
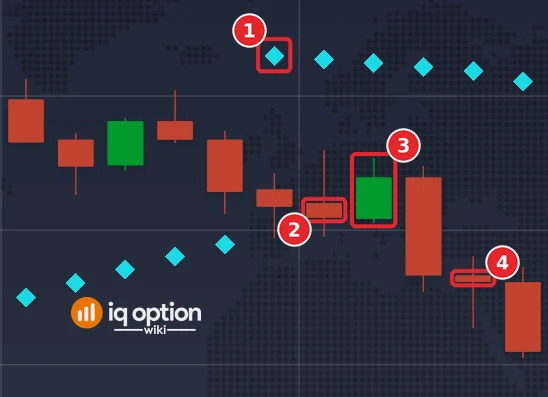
Lower signal, 04:00
The dots had been below the candles while the price rose. On the candle that opened at 03:55 the first dot appeared above the candles (1), at 1.13665: the dots had jumped. The next candle (2) opened at 04:00 and closed at 04:05 at 1.13605, a bearish candle by half a pip with the dots still above it, so the rule says Lower, and the trade opens at that close. A 5-minute trade ends at 04:10, when the candle (3) closes at 1.136195, 1.45 pips higher: it lost. A 15-minute trade ends at 04:20, when the candle (4) closes at 1.13581, 2.4 pips lower: it won, and so did the 30-minute trade (exit 1.13435 at 04:35).
Higher signal, 10:50
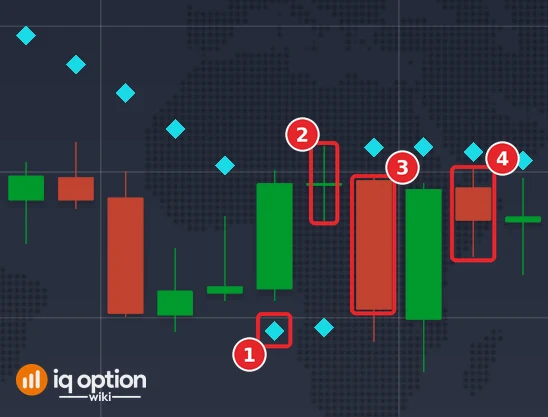
The dots had been above the candles while the price fell. On the candle that opened at 10:45 the first dot appeared below the candles (1), at 1.133955. The next candle (2) opened at 10:50 and closed at 10:55 at 1.13446, a bullish candle by 0.05 pip with the dots still below it, so the rule says Higher, and the trade opens at that close. A 5-minute trade ends at 11:00, when the candle (3) closes at 1.13403, 4.3 pips lower: it lost. A 15-minute trade ends at 11:10, when the candle (4) closes at 1.134335, 1.25 pips lower: it lost too, and so did the 30-minute trade (exit 1.13429 at 11:25). The dots jumped back above the candles on the next candle, so this trend lasted two candles.
The flip signal, tested
We scored the rule on the 1,334 five-minute candles of our recording with trades of 5, 15 and 30 minutes, and for comparison on the signal without the candle-colour condition and on 1-minute candles. Trades start at the close of the signal candle.
Tested on IQ Option: the Parabolic SAR flip with a candle of the new colour, EUR/USD candles of 29 September to 5 October 2026
| Asset and candles | EUR/USD binary (regular, not OTC): 1,334 five-minute candles (2026-09-29 01:55 to 2026-10-02 20:55 UTC and 2026-10-04 21:00 to 2026-10-05 17:00 UTC); 1,505 one-minute candles (2026-10-02 18:23 to 2026-10-02 20:59 UTC and 2026-10-04 21:01 to 2026-10-05 19:28 UTC). The candles were recorded from IQ Option’s Practice traderoom. The replay places no orders; it only scores the rule on those closed candles, at an 85% payout. |
|---|---|
| Rule tested | The flip rule on closed candles, the option opening at the close of the signal candle: the dots (0.02 and 0.2) jump to the other side of the candles on candle j-1; if candle j has the colour of the new trend (bullish after a jump below the price, bearish after a jump above it) and the dots are still on that side, the signal is at the close of candle j: Higher after a jump below, Lower after a jump above. The box lists trades of 5, 15 and 30 minutes on 5-minute candles, the flip without the colour condition (15 minutes) and the rule on 1-minute candles (5 minutes). |
| Signals | SAR flip and a candle of the new colour, 5-minute candles, 5-minute trade: 55 signals (26 Higher, 29 Lower) same, 15-minute trade: 55 signals (26 Higher, 29 Lower) same, 30-minute trade: 55 signals (26 Higher, 29 Lower) SAR flip alone (no colour condition), 5-minute candles, 15-minute trade: 109 signals (54 Higher, 55 Lower) SAR flip and a candle of the new colour, 1-minute candles, 5-minute trade: 60 signals (31 Higher, 29 Lower) |
| Outcomes | SAR flip and a candle of the new colour, 5-minute candles, 5-minute trade: 32 won, 23 lost, 0 tied; 58.2% of the 55 decided trades won; net +$0.08 per $1 staked at 85% (+$0.11 at 91%) same, 15-minute trade: 24 won, 31 lost, 0 tied; 43.6% of the 55 decided trades won; net −$0.19 per $1 staked at 85% (−$0.17 at 91%) same, 30-minute trade: 26 won, 29 lost, 0 tied; 47.3% of the 55 decided trades won; net −$0.12 per $1 staked at 85% (−$0.10 at 91%) SAR flip alone (no colour condition), 5-minute candles, 15-minute trade: 58 won, 50 lost, 1 tied; 53.7% of the 108 decided trades won; net −$0.01 per $1 staked at 85% (+$0.03 at 91%) SAR flip and a candle of the new colour, 1-minute candles, 5-minute trade: 29 won, 31 lost, 0 tied; 48.3% of the 60 decided trades won; net −$0.11 per $1 staked at 85% (−$0.08 at 91%) |
| Break-even | At an 85% payout a trade needs to win more than 54.1% of its decided trades to break even (1 ÷ 1.85); at 91%, more than 52.4% (1 ÷ 1.91). |
A replay is only a look back at candles recorded on the dates above: it placed no real orders, covers about four and a half days of one pair, and counts overlapping trades as if they were independent. A short test proves nothing about the future, and no profit and no win rate is promised here. IQ Option’s own blog on backtesting says that most strategies need dozens, and often hundreds, of trades before a result means anything.
With the colour condition the rule gave 55 signals. The 5-minute trades won 32 and lost 23 (58.2%, with a 95% interval of 45% to 70%); the 15-minute trades won 24 and lost 31 (43.6%); the 30-minute trades 26 and 29 (47.3%). Longer trades are expected to be the better ones; in our sample the shortest was the best and the other two were below 50%. Without the colour condition there were 109 signals and the 15-minute trades won 58 of 108 decided (53.7%). On 1-minute candles there were 60 signals and the 5-minute trades won 48.3%. Nothing here separates the rule from chance.
Pros and Cons of the Parabolic SAR
| Pros | Cons |
|---|---|
| Dots that show the side of the trend at a glance, and a built-in stop level. | The side changes often: on 5-minute candles the dots jumped about every 11 candles. |
| A clear flip signal for early reversals. | The three expiries gave 58.2%, 43.6% and 47.3%, so the result depends on the expiry chosen. |
| Combines with moving averages and oscillators: the SMA 50, 100 or 200, the MACD and the Stochastic are the usual partners. | It gives false signals during consolidation and is not suited to short time frames. |
Common mistakes
- Trading every jump of the dots. The rule wants the first candle after the jump to confirm the colour.
- Using it on 1-minute candles. A small fluctuation can turn the trend against you.
- Changing the acceleration without a reason. The usual settings are the defaults, 0.02 and 0.2.
- Ignoring the higher trend. A moving average (SMA 50, 100 or 200) shows it.
- Choosing the expiry after the fact. A different expiry gave a different answer in our recording.
Related guides
- MACD and Parabolic SAR and Stochastic and Parabolic SAR
- MACD, Parabolic SAR and EMA and ADX and EMA
- Trading with trend lines
- All indicator guides and all strategy guides
Frequently Asked Questions
Q: What is the Parabolic SAR?
A: An indicator that puts dots below the candles in an uptrend and above them in a downtrend. SAR stands for Stop And Reverse.
Q: What are the Parabolic SAR settings on IQ Option?
A: Acceleration Step 0.02 and Acceleration max 0.2.
Q: How do I trade the flip?
A: When the dots jump below the price, the rule buys if the first candle after the jump is bullish; when they jump above the price, it sells if the first candle is bearish.
Q: Which time frame suits the Parabolic SAR?
A: Longer time frames such as 15 minutes or 1 hour, and not 1 minute. Our recording has only 5-minute and 1-minute candles.
Q: Does the Parabolic SAR strategy win?
A: We could not tell. On 5-minute candles the 5-minute trades won 58.2% of 55 decided trades, but the 15-minute and 30-minute trades won 43.6% and 47.3%.
Q: Can I use the SAR as a stop?
A: The dots can serve as a moving stop-loss level. Binary options have no stop; the trade ends at the expiry.