
Last updated: 8 October 2026. Every screenshot below was recorded on 5 and 8 October 2026 on an IQ Option Practice account registered in Brazil. We placed no real-money trade. This guide explains the indicator and tests no trading rule: how MACD is read comes from IQ Option’s own blog, which we read on 5 October 2026, and from the published source code of the platform’s built-in indicator (the Quadcode Script library). Nothing here is a promise of profit.
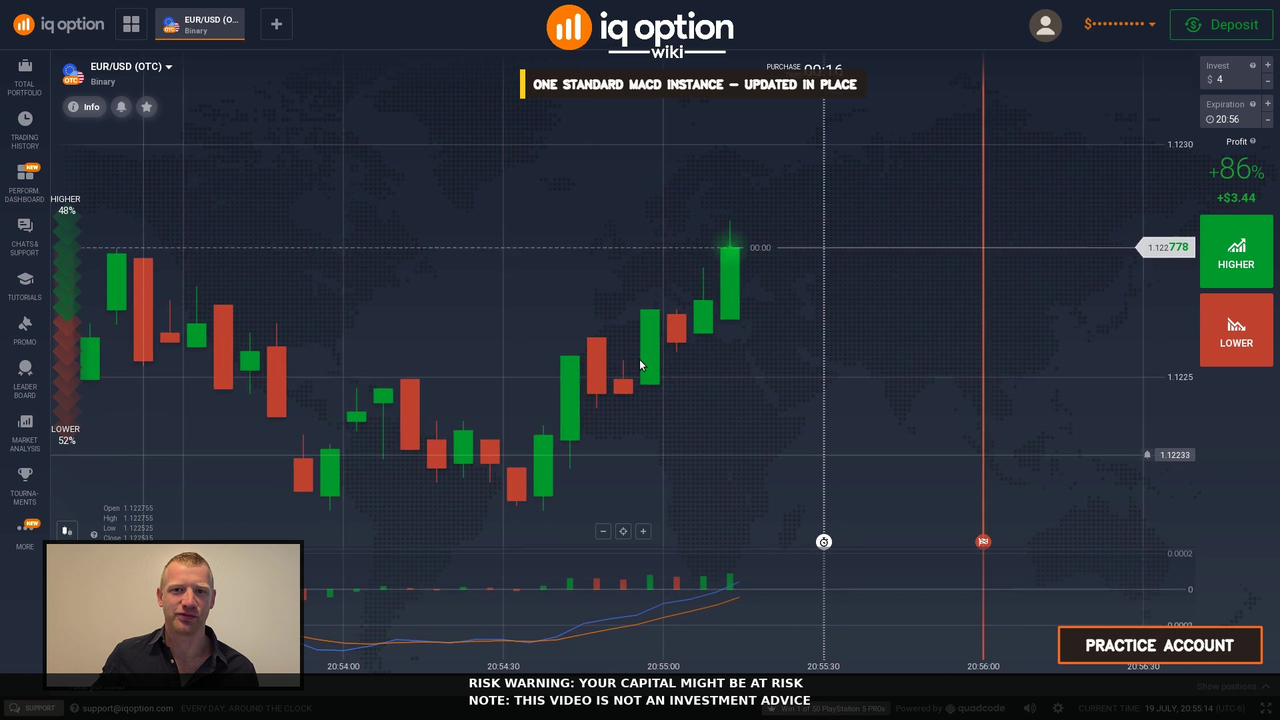
MACD is a trend and momentum indicator that compares two exponential moving averages of the closing price; in IQ Option’s built-in version the dialog opens with a fast period of 12, a slow period of 26 and a signal period of 9. IQ Option’s own blog calls these numbers a useful starting point, says that faster settings make MACD more sensitive and not more accurate, and describes it as a lagging indicator. This guide shows how to add MACD to the chart, what its three parts measure and what the sources do and do not support.
Video tutorial
Quick answer
- Defaults: Fast Period 12, Slow Period 26 and signal line Period 9, from the published source of IQ Option’s built-in MACD.
- What it plots: the MACD line (12-period EMA minus 26-period EMA of the close), a signal line (9-period EMA of the MACD line) and a histogram (MACD line minus signal line).
- Settings: IQ Option’s blog calls 12, 26 and 9 a useful starting point. Faster settings make MACD more sensitive, not more accurate.
- Crossovers: the signal-line crossover is the faster one and the zero-line crossover (12 EMA crossing 26 EMA) is slower. The histogram changing sign is the same event as the signal-line crossover, not a second confirmation.
- Limits: MACD is a lagging indicator, it has no overbought or oversold level, and in a range it crosses its signal line again and again.
- Tested: this guide tests no trading rule. A binary option has no stop loss, so any price level that would prove a trade wrong has to be checked before you buy.
Setting up the MACD indicator on IQ Option
These steps use the web traderoom on a Practice balance. The numbers in each screenshot match the numbers in the text. The formulas come from the Quadcode Script library, which publishes the source code of the platform’s built-in indicators.
Step 1: Open Chart analysis
Click the indicators button (1), the wave icon in the chart toolbar at the bottom left of the chart. It opens the Chart analysis panel, which has the tabs Indicators, Templates, Widgets and Scripts and the lists Added, Popular, Momentum, Trend, Volatility, Moving Averages, Volume and Other.

Step 2: Find MACD
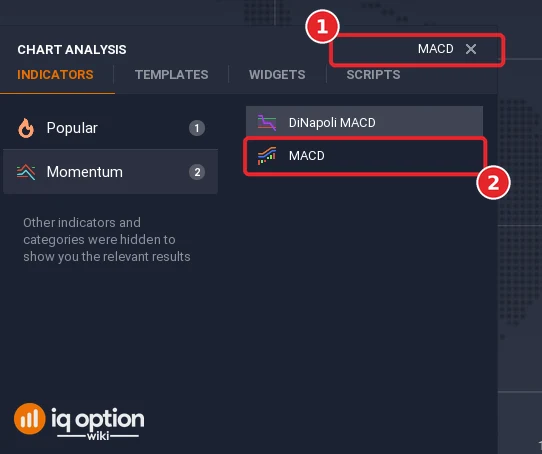
Type MACD in the Search for indicators box (1). The results include DiNapoli MACD, a different indicator, and MACD; click MACD (2). It is also in the Momentum list.
Step 3: Check the three settings and apply
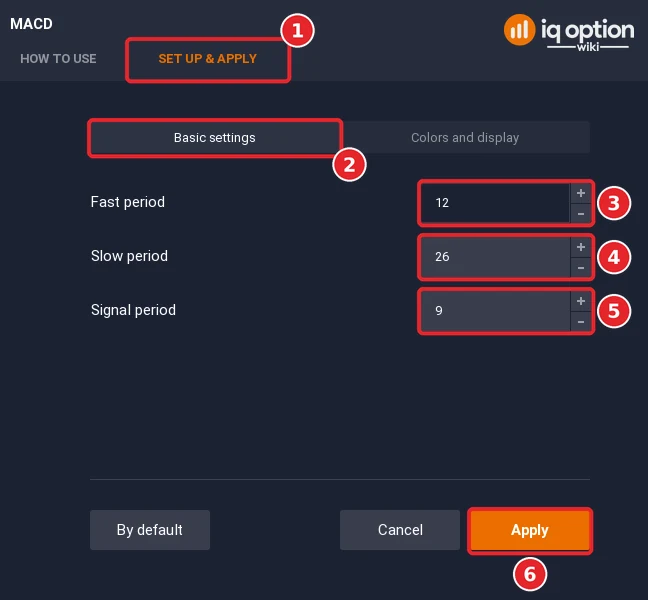
The indicator’s dialog has two tabs, How to use and Set up & apply. Open Set up & apply (1). Basic settings (2) holds the three periods: Fast period (3), Slow period (4) and Signal period (5). They open at 12, 26 and 9. In the published source each takes a whole number from 1 to 250. Leave them as they are and click Apply (6). The Colors and display tab holds the line colours.
Step 4: Find the three parts on the chart
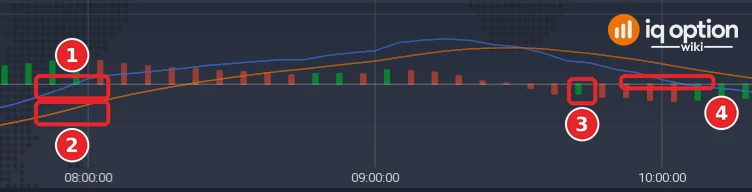
MACD opens in its own panel under the price chart, headed MACD (12, 26, 9). It draws the MACD line (1) in blue, the signal line (2) in orange, the histogram bars (3) in green and red and a zero line (4).
Best settings for MACD indicator
IQ Option’s blog does not single out one set. It calls 12, 26 and 9 a useful starting point because most chart examples and platform defaults use them, and its author changes them only when the same entry, invalidation and exit rules can be tested across enough trades, including spreads and slippage. The three numbers count candles, not fixed units of time: on a five-minute chart the 12 means 12 five-minute closes.
| Setting | Default | What changes when you shorten it |
|---|---|---|
| Fast period | 12 | MACD reacts more quickly to recent price changes. |
| Slow period | 26 | The comparison window becomes shorter. |
| Signal period | 9 | Crossovers appear sooner and more often. |
The last column follows IQ Option’s blog; the defaults are the ones in the published source. The blog adds that faster settings do not make MACD more accurate. They make it more sensitive, which can help when a strategy needs earlier information but also creates more crossovers in ordinary price noise.
What is the best MACD setting for day trading?
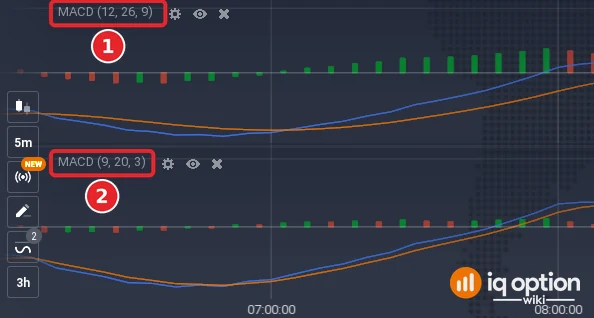
IQ Option’s blog names no day-trading set either. It says MACD can be calculated on intraday candles, but that shorter time frames contain more price noise and trading costs matter more, so the settings, the market condition and the price trigger need to be tested on the same time frame you trade on. A faster set is worth knowing about. IQ Option’s blog on indicators for short-term binary options suggests setting the short average to 9, the long average to 20 and the signal line to 3, which shortens all three numbers. That set has no test behind it in this guide.
The screenshot below puts the default MACD(12, 26, 9) and MACD(9, 20, 3) on the same candles. Over the stretch in the screenshot, 29 September 2026 from 06:20 to 12:00 platform time on 5-minute candles, we counted the crossovers in the recorded candles: the default MACD(12, 26, 9) crossed its signal line 4 times and MACD(9, 20, 3) crossed 10 times. The faster set reacts to more of the small swings, which also means more signals to sort through; the screenshot shows the difference, and a count on one stretch says nothing about which set is better.
Understanding how the MACD indicator works
MACD is the gap between a faster and a slower average, plus two ways of reading that gap. The published source of IQ Option’s built-in MACD calculates three things from the closing price:
| Part | How it is calculated | What it shows |
|---|---|---|
| MACD line | 12-period EMA of the close minus 26-period EMA of the close | The gap between the faster and the slower average. It is above zero when the faster average is higher. |
| Signal line | 9-period EMA of the MACD line | MACD smoothed by its own average. It smooths MACD, not price. |
| Histogram | MACD line minus signal line | The gap between MACD and its signal line. It is positive when MACD is above the signal line. |
The two lines on the chart are the MACD line and the signal line, not the two moving averages themselves: the MACD line is the difference between those two averages, which is why it swings above and below the zero line.
What the chart shows
| What you see | What it means |
|---|---|
| MACD line above zero | The 12-period EMA is above the 26-period EMA. |
| MACD line below zero | The 12-period EMA is below the 26-period EMA. |
| MACD above its signal line | The histogram is positive: recent momentum has turned up relative to its own average. |
| MACD below its signal line | The histogram is negative: recent momentum has turned down relative to its own average. |
| Histogram bars growing | The distance between MACD and its signal line is increasing. |
| Histogram bars shrinking | The distance is decreasing. A crossover may follow, but price has not necessarily reversed. |
| Green or red histogram bar | In the published source a bar is green when it is at least as high as the bar before it and red when it is lower. The colour shows rising or falling, not above or below zero, so a green bar can sit below the zero line. |
Signal-line crossover and zero-line crossover
A signal-line crossover happens when the MACD line crosses its signal line. It is the faster signal and can appear while MACD is still below zero in a downtrend or above zero in an uptrend, so it can also fire during an ordinary pullback. A zero-line crossover happens when the 12-period EMA crosses the 26-period EMA. It is slower, because price has to move far enough to reverse the order of the two averages, and IQ Option’s blog uses it more as a trend filter than as an entry trigger. The histogram moving above or below zero is the signal-line crossover shown a second way. It is the same event, so counting both counts one event twice.
IQ Option’s blog does not turn either crossover into an entry order. It checks price first:
- Is price making higher highs and higher lows, lower highs and lower lows, or neither?
- Is MACD holding mostly on one side of zero?
- Did the crossover come after a pullback in an existing trend or in the middle of a range?
- Is there a price level that proves the idea wrong?
A binary option has no stop loss and no take profit: it pays or loses at its expiry. For a binary option the last question is therefore a check you make before you buy, not an order you can place. A CFD (margin) trade has both a stop loss and a take profit.
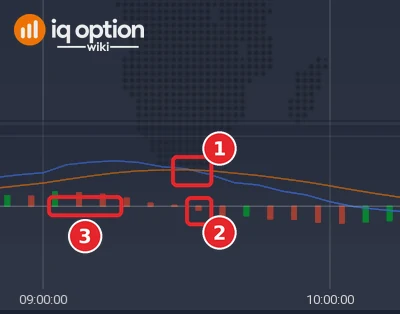
In the screenshot the crossover at (1) and the histogram bar at (2) are one event. On the candle that opened at 09:30 platform time (12:30 UTC) the MACD line fell below its signal line: it had been at 0.00027 against 0.00026 on the candle before, and it closed at 0.00023 against 0.00025. The histogram bar on that candle was the first one below zero, at about -0.00002 (the values are rounded to five decimals). In the screenshot the bar is small and the lines were already close, which shows how little a crossover can mean on its own: price had already fallen from the 09:00 high by then, and MACD only confirmed it later.
MACD divergence
Divergence compares the swings of price with the swings of MACD. It is a disagreement between the two, not a crossover of the lines.
| Type | Price | MACD |
|---|---|---|
| Bullish divergence | Makes a lower low | Makes a higher low |
| Bearish divergence | Makes a higher high | Makes a lower high |
IQ Option’s blog says the new price extreme was reached with a weaker gap between the two averages. That can matter, but it does not say when price will turn. The blog wants a price event after the divergence, such as a failed breakout, a close through a swing level or a break in the existing sequence of highs and lows. Without that it calls divergence an observation, not an entry rule. For the same idea on other indicators, see our divergence guide.
Pros and Cons of Using MACD Indicator
| What it gives you | Where it falls short |
|---|---|
| One calculation answers three questions: is the faster average above or below the slower one, is the gap growing or shrinking, and has short-term momentum changed direction. | It is a lagging indicator: it is calculated from moving averages of past prices, so it follows the move it describes. |
| Three settings, and the numbers count candles on whatever candle size you chart. | In a range it crosses its signal line again and again. In IQ Option’s blog example, daily gold futures gave seven signal-line crossovers from 6 June to 15 August 2025 while the close changed by 0.4%. |
| A faster reading (the signal line) and a slower one (the zero line) from the same calculation. | It has no overbought or oversold boundary, and raw values are not normalised: a reading of 20 can be small for one asset and impossible for another. |
MACD Indicator: Key Features and Usage
| Key features | How IQ Option’s blog uses them |
|---|---|
| Trend context | Which side of zero the MACD line is on, and whether it stays there, shows whether the 12-period EMA is above or below the 26-period EMA. |
| Momentum shifts | A signal-line crossover shows the MACD line changing direction against its own 9-period average. It is the faster signal and it can fail during a pullback. |
| Strength of the gap | The height of the histogram bars shows how wide the gap is. Shrinking bars mean the gap is closing, not that price has reversed. |
| Divergence | A price extreme that MACD does not match. It is an observation until price gives a trigger. |
Is MACD reliable?
None of the sources we read gives MACD a success rate. IQ Option’s blog calls MACD a lagging indicator, says its author reads it as a compact view of trend and momentum, “not as a prediction of the next candle”, and says that neither a signal-line crossover nor a move above zero means price will keep rising. It shows both sides with daily gold futures. MACD crossed above its signal line on 23 February 2024, and the close on 18 April was about 16.9% higher than on 23 February. From 6 June to 15 August 2025 the same market produced seven crossovers while the close changed by 0.4%. The blog adds that it would not use the first result to claim that every bullish crossover works.
What decides the outcome is the rule built around the indicator: the market, the candle size, the settings, the entry, the expiry and the costs. That has to be measured over many trades. Practise on the Practice balance and count your own results against the break-even rate before you risk money. At an 85% payout a binary option has to win more than 54% of the time to break even (1 ÷ 1.85).
Common mistakes
- Counting the signal-line crossover and the histogram crossing zero as two confirmations. They are the same event.
- Reading MACD as overbought or oversold. It has no fixed upper or lower boundary, so no value means the same thing on every asset.
- Comparing raw MACD values between assets. They depend on each asset’s price scale.
- Switching direction at every crossover in a range, where the lines cross again and again without a trend.
- Changing the settings without a fixed rule to test them on. IQ Option’s blog changes them only when it can test the same entry, invalidation and exit rules across enough trades.
Related guides
- MACD, Parabolic SAR and EMA strategy
- Binary options strategy with MACD and Parabolic SAR
- Vortex and MACD binary options strategy
- How to trade with the EMA indicator on IQ Option
- Leading and lagging indicators
- Identifying the trend on IQ Option
- All indicator guides and all strategy guides
Frequently Asked Questions
Q: What are the default MACD settings on IQ Option?
A: The dialog opens with a fast period of 12, a slow period of 26 and a signal period of 9, written MACD(12, 26, 9), which is also how the panel header reads.
Q: Which MACD settings should I use?
A: IQ Option’s blog treats 12, 26 and 9 as a starting point. Shorter settings make MACD more sensitive, which brings more crossovers, not more accurate ones. Change them only if you can test the same rule with the new numbers across enough trades.
Q: How can I avoid false signals from the MACD indicator?
A: You cannot remove them. IQ Option’s blog suggests checking price before you use a crossover: whether price is making higher highs and higher lows, lower highs and lower lows, or neither, whether MACD is holding on one side of zero, and whether the crossover came after a pullback in a trend or in the middle of a range. When price structure is mixed and MACD keeps crossing near zero, the blog treats the indicator as noise until the market picks a direction.
Q: Can MACD be used for both short-term and long-term trading?
A: MACD can be calculated on any candle size, and its three numbers count candles. IQ Option’s blog says shorter time frames contain more price noise and trading costs matter more, so test the settings and the rule on the time frame you trade.
Q: Can I use MACD as a standalone trading strategy?
A: IQ Option’s blog does not present it that way. It calls MACD most useful when it compresses information you can already check on price, and it does not let the indicator overrule the chart when the two tell different stories. This guide does not test a MACD rule.
Q: Is the MACD indicator suitable for beginners?
A: It has three settings and three parts to read. An IQ Option blog article calls it well suited to beginners because of its simplicity, but MACD is a lagging indicator and a crossover is not a prediction. Practise on the Practice balance first.
Q: Is MACD a leading or a lagging indicator?
A: Lagging, according to IQ Option’s blog: it is calculated from moving averages of past prices. The histogram, the gap between the MACD line and its signal line, can turn before the MACD line crosses zero, but it is still derived from completed price data.
Q: Can MACD show overbought and oversold levels?
A: Not in the way RSI or Stochastic can. MACD has no fixed upper or lower boundary, so no value means overbought or oversold on every asset.