
Last updated: 8 October 2026. Every screenshot below was recorded on 8 October 2026 on an IQ Option Practice account registered in Brazil, on EUR/USD 1-minute candles; the Chart analysis picture in Step 1 was recorded on 5 October 2026. We placed no real-money trade. The tested box shows what the rule did on EUR/USD candles recorded between 29 September and 5 October 2026; it says nothing about what will happen next.
This strategy asks two indicators to agree. The MACD is set to a fast period of 7, a slow period of 14 and a signal period of 5, and the Parabolic SAR keeps its default settings. When the MACD line crosses zero upward and the SAR dots are below the candles the rule buys; when it crosses zero downward and the dots are above the candles, it sells. It uses 1-minute candles and a trade of 5 minutes. On 1,505 one-minute EUR/USD candles recorded between 2 and 5 October 2026 the rule gave 55 signals, and the 5-minute trades won 29 and lost 26, 52.7%, a little under the break-even rate of 54.1% at an 85% payout and well inside the margin of error (the 95% interval runs from 40% to 65%).
Quick answer
- MACD: fast period 7, slow period 14, signal period 5 (the platform opens it at 12, 26 and 9).
- Parabolic SAR: default settings, an acceleration step of 0.02 and a maximum of 0.2.
- Higher: the MACD line crosses zero from below while the SAR dot is below the candles; enter at the close of that candle.
- Lower: the MACD line crosses zero from above while the SAR dots are above the candles; enter at the close of that candle.
- Candles and expiry: 1-minute candles, a 5-minute trade.
- Tested: 55 signals on 1-minute candles; 5-minute trades won 52.7% of the decided trades (break-even 54.1% at an 85% payout).
How do you set up the MACD and Parabolic SAR strategy?
Set the chart
Choose the asset, the chart type and the candle size first: the indicators are calculated from the candles on the chart. The examples in this guide use 1-minute candles on EUR/USD. These steps use the web traderoom on a Practice balance, and the numbers in each screenshot match the numbers in the text. If you do not have an account yet, see how to register.
Step 1: Open Chart analysis
Click the indicators button (1), the wave icon in the chart toolbar at the bottom left of the chart. The Chart analysis panel opens with the tabs Indicators, Templates, Widgets and Scripts. Stay on Indicators.

Step 2: Find the MACD
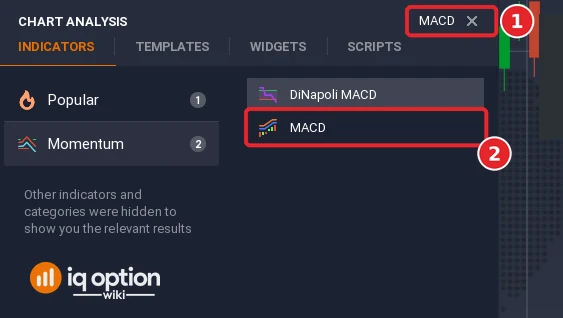
Type “MACD” in the Search for indicators box (1) and click MACD (2), the second entry of the list; the first one, DiNapoli MACD, is a different indicator.
Step 3: Set 7, 14 and 5
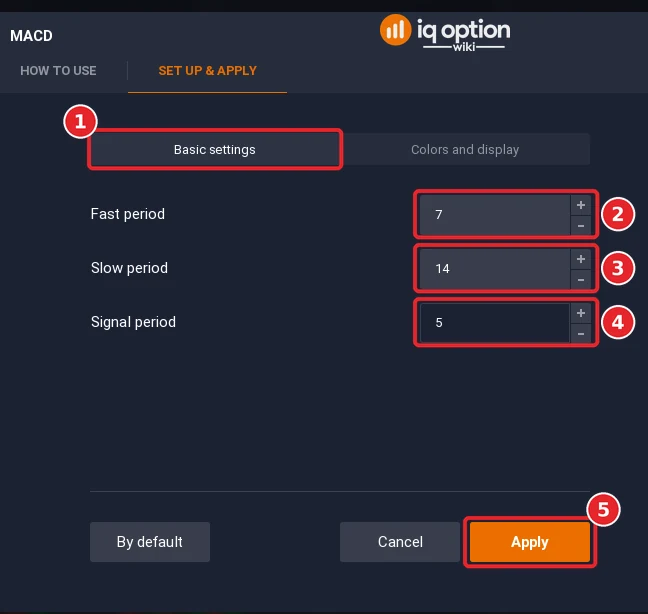
The MACD dialog opens on the Set up & apply tab, on Basic settings (1), with the Fast period 12 (2), the Slow period 26 (3) and the Signal period 9 (4). Type 7, 14 and 5 in them and click Apply (5).
Step 4: Add the Parabolic SAR with its default settings
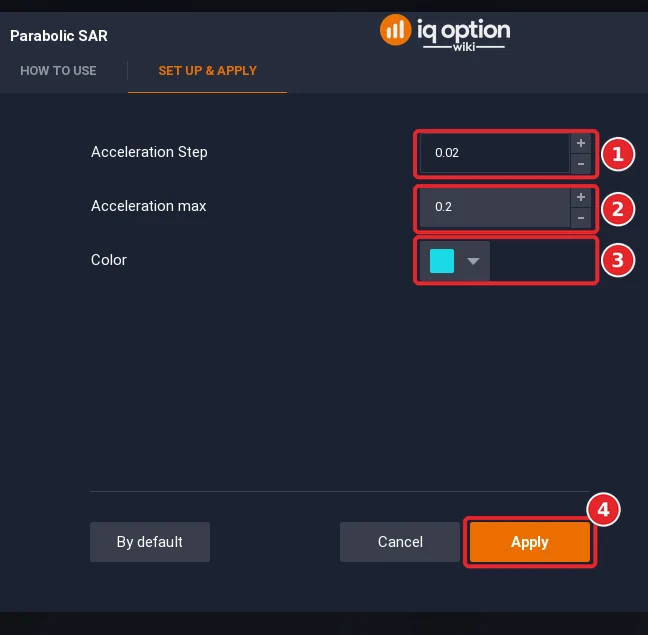
Open Chart analysis again, search for “Parabolic” and click Parabolic SAR. The rule leaves its parameters as they are: an acceleration step of 0.02 (1) and a maximum of 0.2 (2); the Color (3) is cyan. Click Apply (4).
Step 5: Use 1-minute candles
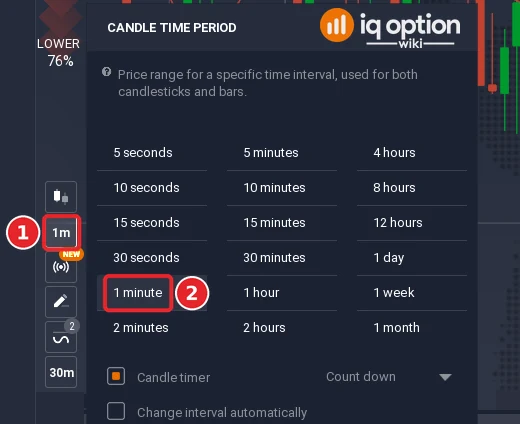
Click the candle time period button (1) in the toolbar at the left of the chart; it shows the current period. In the menu that opens, choose 1 minute (2). The strategy uses a Japanese candlestick chart with 1-minute candles.
Step 6: Read the chart
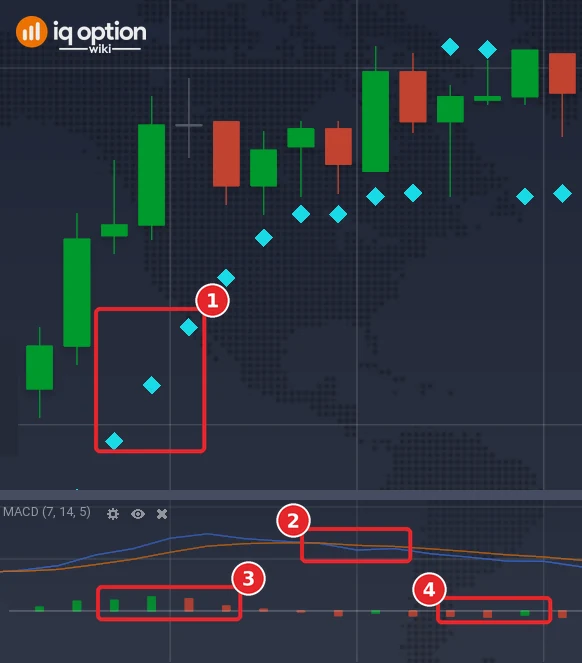
The SAR dots are drawn on the price chart (1), above or below the candles. The MACD panel sits under it, titled MACD (7, 14, 5): the MACD line (2) is the blue one, the signal line the orange one, and the bars are the histogram (3) around the zero line (4).
What do the two indicators show?
The MACD line is the difference between a fast and a slow exponential moving average of the close. With the platform’s 12 and 26 it crossed zero 36 times in 1,385 one-minute candles of our recording, after a warm-up of 60 candles in each stretch (2.6 per 100 candles); with 7 and 14 it followed the price more closely and crossed 73 times (5.3 per 100). The signal line is a moving average of the MACD line (period 5 here), and the histogram is the gap between the two. Zero is the point where the fast average equals the slow one.
The Parabolic SAR draws a dot on each candle: below the candle in an uptrend and above it in a downtrend. The dot moves toward the price and speeds up each time the price makes a new high or low, up to a maximum; when the price touches the dot, the indicator reverses and the dots jump to the other side of the candles. The rule uses only the side of the dots at the time of the MACD cross.
We read the MACD line, the signal line and the dots off the platform’s chart over 41 to 42 candles of one window and compared them with the calculation: the median difference was 0.003 pip for the MACD line, 0.002 pip for the signal line and 0.09 pip for the dots. The platform draws the lines at the close of a candle and the dots at its centre.
What are the entry rules?
The combination catches the point where a trend reverses or continues. Written so that every condition is checked on closed candles:
| Part | Rule |
|---|---|
| Chart | 1-minute candles, MACD 7, 14, 5 and Parabolic SAR with its defaults |
| Higher signal | The MACD line crosses zero from below on the candle, and that candle’s SAR dot is below the candle |
| Lower signal | The MACD line crosses zero from above on the candle, and that candle’s SAR dot is above the candle |
| Entry | At the close of the signal candle |
| Expiry | 5 minutes |
The payout is usually 80% to 90%, so a binary options strategy has to win more than half of its trades to pay: at an 85% payout the break-even rate is 54.1%, and a rule needs a margin above it to be worth the risk.
Two signals of the recording, step by step
The first Lower signal and the first Higher signal of the rule on 1-minute candles, in time order, not picked by outcome. All times are the platform clock, which is UTC minus three hours; the date is 2 October 2026. On a 1-minute chart the MACD values are tiny: the line crosses zero by a fraction of a pip, so in both pictures it runs along the zero line at the crossing.
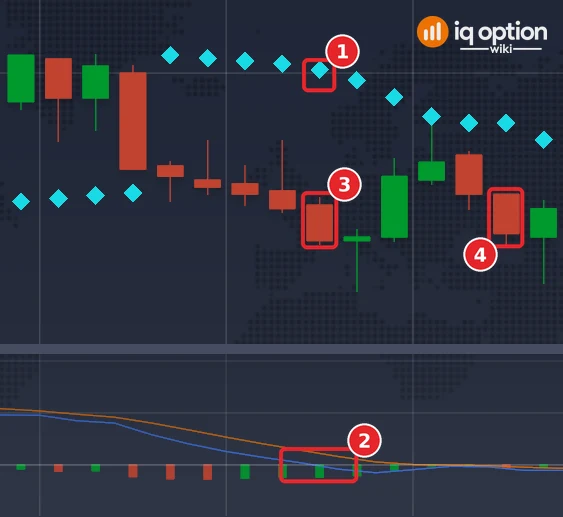
Lower signal, 16:42
The candle (3) that opened at 16:42 and closed at 16:43 at 1.125765 had the SAR dot (1) above it, at 1.125997, 1.72 pips over its high, so the trend side is down. The MACD line (2) stood at +0.04 pip at the close of the candle before and at -0.08 pip at the close of this one: it crossed zero downward. Both conditions held, so the rule says Lower, and the 5-minute trade opens at that close. It ends at 16:48, when the candle (4) that opened at 16:47 closes at 1.125775, 0.1 pip higher: it lost.
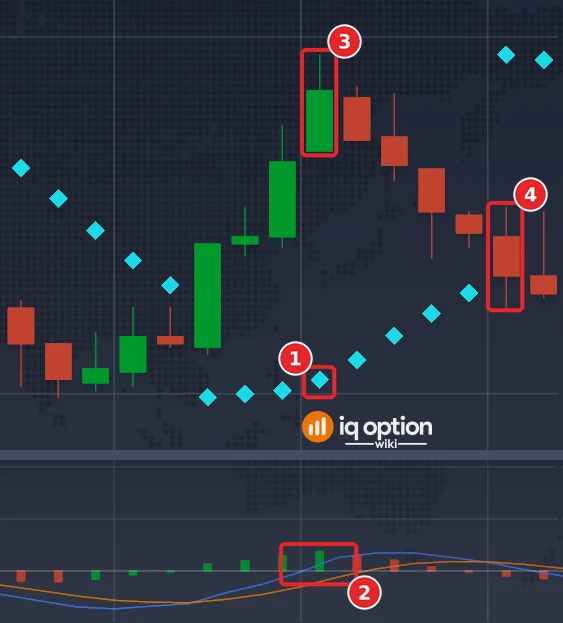
Higher signal, 17:00
The candle (3) that opened at 17:00 and closed at 17:01 at 1.125925 had the SAR dot (1) below it, at 1.125515, 3.25 pips under its low, so the trend side is up. The MACD line (2) stood at -0.01 pip at the close of the candle before and at +0.26 pip at the close of this one: it crossed zero upward. Both conditions held, so the rule says Higher, and the 5-minute trade opens at that close. It ends at 17:06, when the candle (4) that opened at 17:05 closes at 1.125665, 2.6 pips lower: it lost.
The MACD and Parabolic SAR rule, tested
We scored the rule on the 1,505 one-minute candles of our recording (2 October, 157 candles, and 4 to 5 October, 1,348 candles), entering at the close of every signal candle and scoring the trade 5 minutes later. For comparison the box also shows the same rule on 5-minute candles with a 5-minute trade.
Tested on IQ Option: the MACD and Parabolic SAR rule, EUR/USD candles of 2 to 5 October 2026
| Asset and candles | EUR/USD binary (regular, not OTC): 1,505 one-minute candles (2026-10-02 18:23 to 2026-10-02 20:59 UTC and 2026-10-04 21:01 to 2026-10-05 19:28 UTC); 1,334 five-minute candles (2026-09-29 01:55 to 2026-10-02 20:55 UTC and 2026-10-04 21:00 to 2026-10-05 17:00 UTC). The candles were recorded from IQ Option’s Practice traderoom. The replay places no orders; it only scores the rule on those closed candles, at an 85% payout. |
|---|---|
| Rule tested | The rule on closed candles, the option opening at the close of the signal candle and lasting 5 minutes: Higher when the MACD (7, 14, 5) line crosses above zero on the candle while the Parabolic SAR dot (0.02, 0.2) is below the candle; Lower when it crosses below zero while the dot is above the candle. MACD and Parabolic SAR as the platform draws them. The box lists 1-minute candles first, then 5-minute candles. |
| Signals | MACD(7,14,5) and SAR, 1-minute candles, 5-minute trade: 55 signals (27 Higher, 28 Lower) same, 5-minute candles, 5-minute trade: 58 signals (30 Higher, 28 Lower) |
| Outcomes | MACD(7,14,5) and SAR, 1-minute candles, 5-minute trade: 29 won, 26 lost, 0 tied; 52.7% of the 55 decided trades won; net −$0.03 per $1 staked at 85% (+$0.01 at 91%) same, 5-minute candles, 5-minute trade: 28 won, 29 lost, 1 tied; 49.1% of the 57 decided trades won; net −$0.09 per $1 staked at 85% (−$0.06 at 91%) |
| Break-even | At an 85% payout a trade needs to win more than 54.1% of its decided trades to break even (1 ÷ 1.85); at 91%, more than 52.4% (1 ÷ 1.91). |
A replay is only a look back at candles recorded on the dates above: it placed no real orders, covers about four and a half days of one pair, and counts overlapping trades as if they were independent. A short test proves nothing about the future, and no profit and no win rate is promised here. IQ Option’s own blog on backtesting says that most strategies need dozens, and often hundreds, of trades before a result means anything.
On 1-minute candles the rule gave 55 signals (27 Higher, 28 Lower): 29 won and 26 lost, 52.7%. Higher trades won 13 of 27 and Lower trades 16 of 28. On 5-minute candles it gave 58 signals and won 28 of 57 decided trades, 49.1%. With 55 trades one standard error is about 7 points, so the result is consistent with a coin toss and with a modest edge alike. A claim that this combination wins a high share of its trades is not what this sample shows.
Pros and Cons of the MACD and Parabolic SAR strategy
| Pros | Cons |
|---|---|
| Two independent kinds of information, a momentum line and a trend side. | With MACD 7, 14, 5 the line crosses zero often; the Parabolic SAR side changes only after a reversal, so the two often disagree. |
| A complete rule with candle size, expiry and entry. | In the recording the 5-minute trades won 52.7%, a little under the break-even rate. |
| Both indicators are built into the platform. | False signals are a weak point, and the MACD needs custom settings. |
Common mistakes
- Leaving the MACD at 12, 26 and 9. The rule is written for 7, 14 and 5.
- Entering on the MACD cross alone. The SAR dot has to be on the matching side.
- Reading the dot of the wrong candle. Use the dot on the signal candle, not the one before.
- Using a 1-minute expiry. The rule asks for 5 minutes.
- Believing a “high win rate”. No count of trades supports it; our replay of 55 trades won 52.7%.
Related guides
- MACD on IQ Option and MACD, Parabolic SAR and EMA
- Parabolic SAR on IQ Option and Stochastic and Parabolic SAR
- Vortex and MACD
- All indicator guides and all strategy guides
Frequently Asked Questions
Q: What is the MACD and Parabolic SAR strategy?
A: A binary options strategy that trades the MACD line crossing zero in the same direction that the Parabolic SAR dots show, on 1-minute candles with a 5-minute trade.
Q: What MACD settings does it use?
A: A fast period of 7, a slow period of 14 and a signal period of 5. The platform opens the MACD at 12, 26 and 9.
Q: What Parabolic SAR settings does it use?
A: The defaults: an acceleration step of 0.02 and a maximum of 0.2.
Q: How long should the trade last?
A: 5 minutes on 1-minute candles. In our replay 5-minute trades won 52.7% of the decided trades.
Q: Does the strategy win?
A: Not clearly. On 1-minute candles 29 of 55 trades won, 52.7%, under the 54.1% needed to break even at an 85% payout but well within the margin of error.
Q: Can I use it on other assets?
A: It applies to various assets; liquid ones such as EUR/USD are the usual suggestion. Our replay used EUR/USD only.

