Last updated: 8 October 2026. Every screenshot below was recorded on 8 October 2026 on an IQ Option Practice account registered in Brazil, on 5-minute EUR/USD candles, and no real-money trade was placed. The candles in the two example pictures are from the night of 28 to 29 September 2026, scrolled back on the same chart. The descriptions of candles and candlestick patterns come from IQ Option’s own blog, which we read on 5 October 2026. The tested box points to the replay of the candle-colour rule in our trading candles guide; it says nothing about what the next candle will do.
A candle on IQ Option shows one period of time, and its colour only compares the closing price with the opening price: green when the close is above the open and red when it is below. The candle-colour method turns that colour into a trade: wait for a candle with a large body to close, then open a Higher option after a green one or a Lower option after a red one, with an expiry of one candle. IQ Option’s own blog says candle patterns on their own may be misleading, so this guide treats the method as a rule to test, not as a way to make money; the rule and its test are in our trading candles guide.
Quick answer
- What the colour means: a candle is green when it closes above its open and red when it closes below it. The traderoom lets you change the colours (IQ Option’s blog).
- The method: wait for a candle with a large body to close, then open a Higher option after a green one or a Lower option after a red one, with an expiry of one candle.
- Setup: the candlestick chart type, the 5-minute candle period and a 5-minute expiry; the trade closes at the solid red line (IQ Option’s Help).
- Evidence: no source we read shows that a candle’s colour predicts the next candle. The rule and its test are in our trading candles guide: In a replay on EUR/USD 5-minute candles from 29 September to 5 October 2026, the rule gave 331 signals and won 47.1% of its 323 decided trades, below the 54.1% break-even rate at an 85% payout.
- No stop loss: a binary option has no stop loss or take profit; it closes at its expiry time.
- Break-even: at an 85% payout a trade has to win about 54.1% of the time (1 ÷ 1.85); at 87%, 53.5%. A martingale ladder does not change that.
How do you use candlesticks in IQ Option?
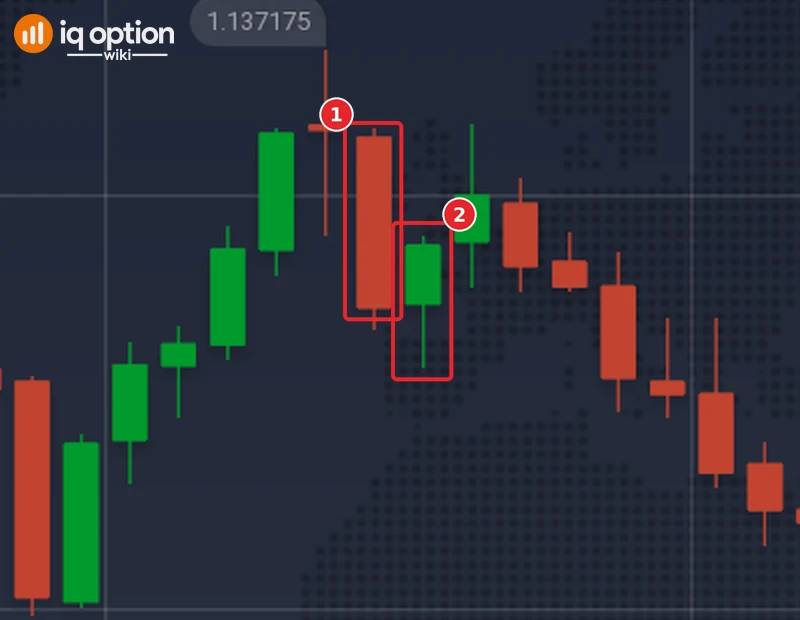
A candlestick chart draws one candle for each period you choose; the candle period button in the chart toolbar offers 5 seconds to 1 month. Each candle records the open at the start of the period, the close at the end, and the highest and lowest prices in between. The distance between the open and the close is the body, and the thin lines above and below it are the shadows, also called wicks.
The colour comes from the body. IQ Option’s blog says a candle turns green when the closing price is above the opening price and red when it is below, and that the traderoom lets you change the colours, so check which colour your chart uses for a falling candle. On the chart we recorded it was red.
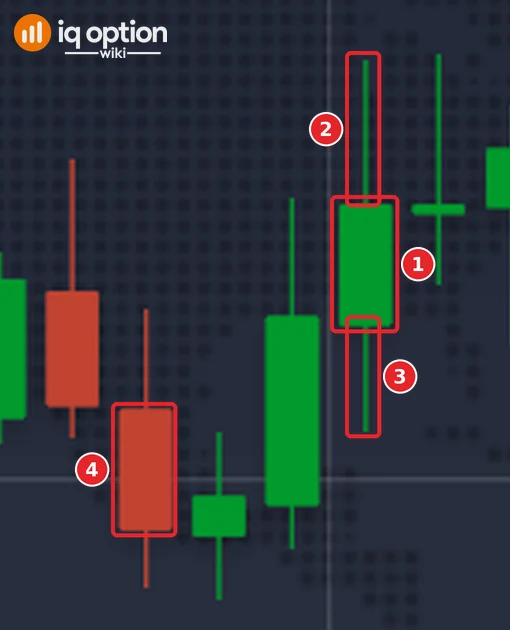
| Shape | What IQ Option’s blog says it shows |
|---|---|
| Long body | Strong momentum in one direction: a long green candle means buyers were aggressive |
| Long shadow | The price moved far and was pushed back, which the blog calls rejection |
| Small body (Doji) | Open and close very close together, which shows indecision; it does not always mean a reversal |
These readings describe what price has already done. The blog says candlestick patterns are formed by “past and current price fluctuations” and so “cannot precisely indicate future price changes”, and that candle patterns on their own may be misleading, so it recommends confirming them with other analysis tools.
The candle-colour method uses one thing from all this: the colour of a candle that has closed. The steps below set the chart up for it on a Practice balance, which starts at $10,000 and has a Refill to $10,000 button, and the numbers in each screenshot match the numbers in the text. The rule and its test are in our trading candles guide, and the money-management side is in the martingale guide.
Step 1: Choose the asset
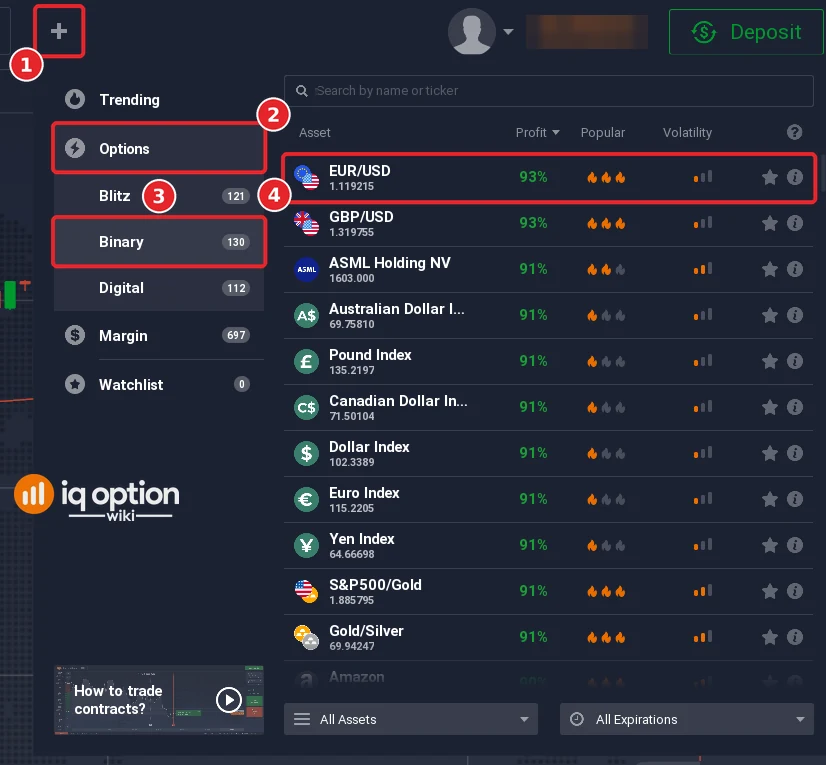
Click + in the top bar (1), open Options (2) and choose Binary (3), then pick EUR/USD from the list (4). The list shows each asset’s payout: on 8 October 2026 EUR/USD showed 93%. The percentage changes by asset and time, so read it next to the asset you choose.
Step 2: Setting up your trading chart to trade candles on IQ Option
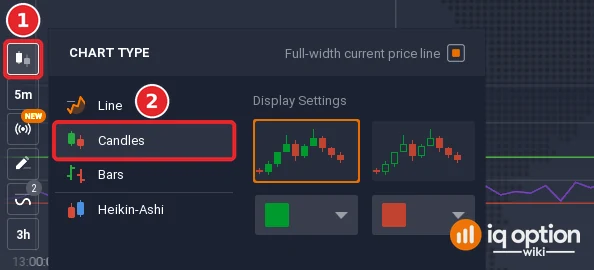
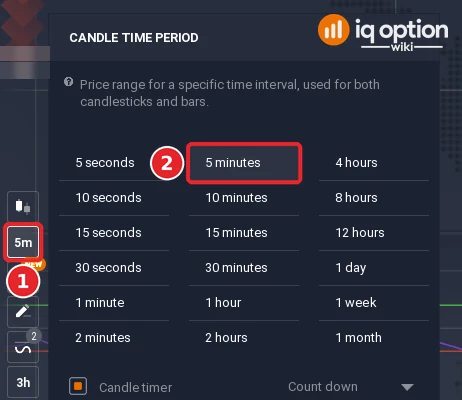
The chart toolbar sits at the bottom left of the chart. Step 2a sets the chart type and step 2b the candle period.
2a. Click the chart type button (1) and choose Candles (2). IQ Option’s blog lists four chart types on the platform: linear, candlestick, bars and Heikin-Ashi. Use the candlestick type for this rule, because Heikin-Ashi calculates its candles from averaged prices and its colours do not match the plain candles.
2b. Click the candle time period button (1) and choose the 5-minute period, listed as 5 minutes (2). Each candle then covers five minutes.
Step 3: Determining how long your trade will last
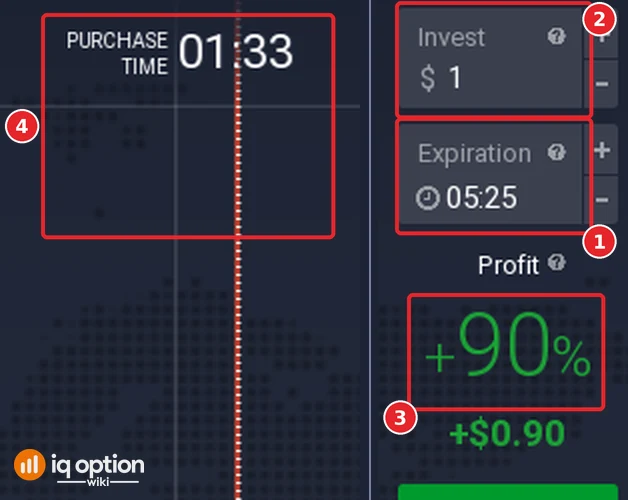
On the right-hand panel the Expiration box (1) shows a clock time, not a number of minutes: in the picture it reads 05:25 while the platform clock reads about 05:23. Click the box to open the list of expiration times, which shows each time with the time remaining beside it. The minute steps carried a payout of 90% and the quarter-hour marks 93% when we looked. For a trade that covers one 5-minute candle, choose the time at which that candle ends, a multiple of five minutes such as 05:25 for the candle that opens at 05:20. Enter the amount in the Invest box (2); the panel shows the payout, +90% in the picture (3). The chart shows a vertical dotted line with a PURCHASE TIME countdown (4). According to IQ Option’s Help, the white dotted line is the time of purchase, the deadline for buying, and the solid red line is the expiration time, where the trade closes automatically and you make a profit or a loss; until you open a trade, the two lines move together to the right. Check the expiration time before you buy: the trade closes there, whatever the candles are doing.
Step 4: Place your trade
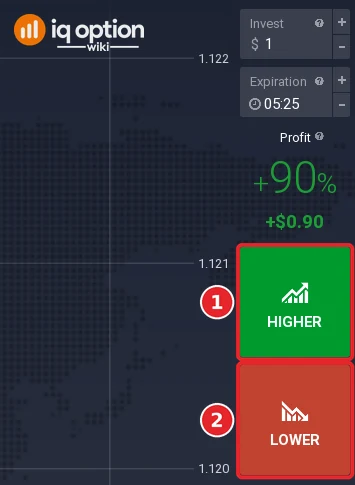
Wait for a signal candle to close; the rule is in the table further down. If it is green, click Higher (1); if it is red, click Lower (2). Click as the next candle opens, so that the option covers that candle. A binary option pays a fixed percentage if it wins and has no stop loss or take profit: it closes at the red line, and you choose the direction, the amount and the expiry.
Is trading candles profitable on IQ Option?
Nothing we read says so. IQ Option’s blog is cautious: candle patterns on their own may be misleading, they cannot precisely indicate future price changes, and no single pattern gives completely accurate information every time. What can be checked is the arithmetic and the record:
- The bar to clear. A binary option pays a fixed percentage if it wins and loses the amount if it does not, so a rule has to win more than 1 / (1 + payout) of its trades to break even: more than 54% at an 85% payout and about 53.5% at 87%. IQ Option’s Help says it may change the payout percentage at any time.
- A reminder from Practice. On 2 October 2026 we placed 70 one-dollar Practice orders from seven indicator strategies in our script library (reported in our strategy test), and 29 won, which is below the break-even rate at every payout we saw. They were other rules, not the candle-colour method, so they say nothing about it; they only show that a rule that reads sensibly can still fall short.
- The test of this rule. In a replay on EUR/USD 5-minute candles from 29 September to 5 October 2026, the rule gave 331 signals and won 47.1% of its 323 decided trades, below the 54.1% break-even rate at an 85% payout. The full test is in our trading candles guide.
Price fluctuations inside a candle
A candle has no final colour until it closes. While it forms, its closing price is just the latest price, so its colour follows the price against the opening price and can change each time the price crosses it. The colour that counts here is the colour of a closed candle, which is why the rule waits for the close and trades as the next candle opens. We checked this on 297 EUR/USD 5-minute candles built from one-minute candles (2 to 5 October 2026; candles with no colour yet are left out of each count): the colour after the first minute was the same as the final colour in 185 of 289 candles (64%), after two minutes in 216 of 291 (74%), after three in 234 of 296 (79%) and after four in 255 of 292 (87%). So about one candle in three had a different colour at its close than after its first minute. That says nothing about what the next candle does.
Placing a single trade at a time
The rule gives one signal at a time: a candle closes, one option opens, and the next signal is looked for only when that option has closed. On 5-minute candles that is at most 12 trades an hour. One trade at a time limits how many trades you can have open and lose together, but it does not make a single trade safer: each can lose its whole amount, and at an 85% payout it still has to win more than 54% of the time to break even.
Easy and simple way to trade Candles on IQ Option
The method needs no indicator: the only input is the candles on the chart. Written as a rule that anyone can repeat, it is this:
| Item | Setting |
|---|---|
| Chart | Regular candles (not Heikin-Ashi), 5-minute period |
| Signal candle | A candle whose body takes up most of its high-low range, so with small or no shadows (70% of the range or more in the test) |
| Direction | A green candle: Higher. A red candle: Lower |
| Entry | When the signal candle closes, which is when the next candle opens |
| Expiry | One candle: 5 minutes |
| Trades at a time | One |
The loose part of the rule is the size of the body. A “real” candle here is one with a large body and small or no shadows. The test turns that into a number so that anyone can repeat it; another reader could choose a different share, and the result could change. How the stake changes after a win or a loss, including the martingale stakes, is in our trading candles guide and the martingale guide.
A green signal candle: open Higher
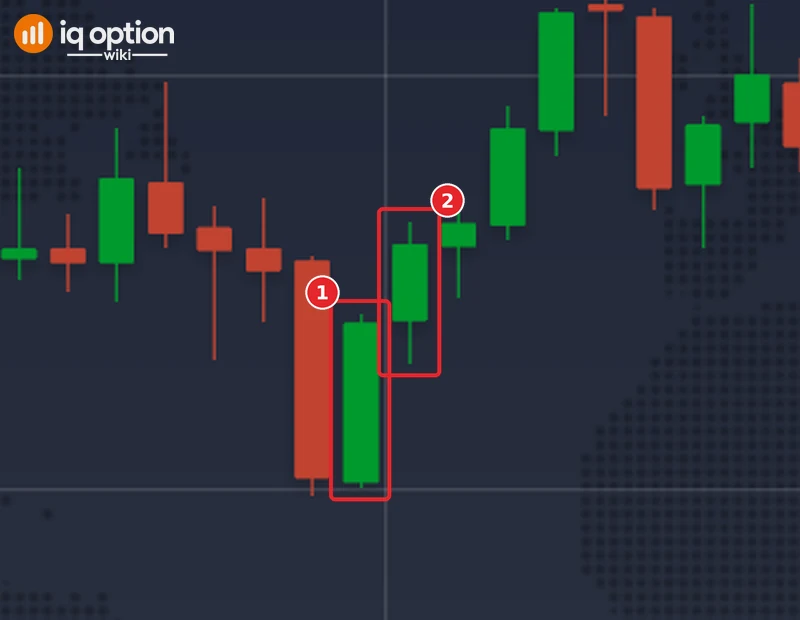
The first real candle of our recorded series was green. It opened at 22:55 on the platform clock on 28 September 2026 (01:55 UTC) at 1.13651 and closed at 1.1367, with a high of 1.13671 and a low of 1.136505, so its body filled 93% of its range. That is a signal under the rule. A Higher option opened at that close, at 1.1367, and expiring five minutes later ended at 1.136795: it won. The next green real candle, at 23:10, won too (entry 1.136935, exit 1.137075). No order was placed: the entry and exit prices come from the recorded candles.
A red signal candle: open Lower
The first red real candle came at 23:25 on the platform clock (02:25 UTC), with an open of 1.13707 and a close of 1.136865; its body filled 85% of its range. A Lower option opened at that close, at 1.136865, and expiring five minutes later ended at 1.13694, above the entry price, so it lost. The next red real candle, at 00:30 on 29 September, won (entry 1.136415, exit 1.13632). Two wins on the green side and one win and one loss on the red side say nothing about the rule: the 331 signals in the test won 47.1%.
Tested on IQ Option: EUR/USD candles of 29 September to 5 October 2026
| Where the test lives | The rule and its full test are in Trading candles on IQ Option. This box repeats its figures. |
|---|---|
| Asset and candles | EUR/USD (binary), 5-minute candles recorded from IQ Option’s Practice traderoom: 1,334 candles in two stretches without gaps, 29 September 01:55 (open of the first candle) to 2 October 21:00 UTC (close of the last candle; 1,093 candles in this stretch) and 4 October 21:00 to 5 October 17:05 UTC (241 candles). The replay places no orders and uses the logged prices. |
| Rule tested | A candle whose body is at least 70% of its high-low range closes: green means Higher, red means Lower. The option opens at that close and runs for one candle (5 minutes), one trade at a time. How the stake changes after a win or a loss is described in the linked guide. |
| Signals | 331 signals: the real candles (body at least 70% of the high-low range) that closed with a green or a red body, one trade at a time, each followed by a 1-candle option. |
| Outcomes | 152 won, 171 lost, 8 refunded. Win rate among decided trades 47.1% (152 of 323); net -$0.126 per $1 staked at an 85% payout. Skipping a real candle that has the same colour as the previous signal gave 152 signals: 64 won, 86 lost, 2 refunded (42.7%). |
| Break-even | At an 85% payout a trade has to win more than 54% of the time (1 / 1.85); at 87%, 53.5%. A martingale ladder does not change these figures. |
The test behind these figures is in our trading candles guide, where the rule is written out and the stake ladder is replayed. A short test proves nothing about the future: it covers one asset over one week of candles recorded from IQ Option’s Practice traderoom, it placed no real orders, a rule that did well in it could lose tomorrow, and one that did badly could do better. No profit or win rate is promised. Compare the win rate with the break-even rate above, and repeat the test on your own Practice balance before you risk money.
Cons of trading candles only
Low profits when trading alongside Martingale system
A martingale ladder raises the stake after each loss so that the first win pays back the earlier losses and the profit of the first trade. At an 87% payout each stake has to be 2.15 times the one before it, that is (1 + payout) ÷ payout, so a $1 first trade is followed by $2.15, $4.62 and $9.93. Whichever step finally wins, the whole sequence earns only the first trade’s profit, $0.87 on a $1 start, while seven stakes in a row add up to $183.54. That is what “low profits” means here: even when the ladder wins, the gain is small next to the amount at risk, and a long losing run costs the sum of the stakes. No part of the candle-colour rule prevents a long losing run. The calculator in the martingale guide shows the ladder for your own balance and payout.
Takes a lot of time to learn trading with candles
Reading a chart is quick to learn and slow to master. IQ Option’s chart-reading guide says you can learn the basics (candles, trends, support and resistance) in a single afternoon, while the nuance and the emotional discipline take months of consistent practice. For timeframes, IQ Option’s support and resistance guide suggests two and no more, for example the 1-hour chart for context when you trade the 5-minute chart. The tested rule uses only the 5-minute chart.
More of a skill than a strategy
A strategy gives rules, and a skill needs judgement. The direction here comes from a rule, the colour, but “large body” is a judgement until it is given a number. With a number, someone else can repeat the result, and you can count how often the rule fires and how often it wins before you rely on it. IQ Option’s beginner guide advises a trade journal to track why you entered and how the trade turned out; without one you cannot tell whether a rule did what you thought. See our trading journal guide.
How do you trade a 1 minute candle?
The same rule can be set on another candle period if the expiry matches it: 1-minute candles with a 1-minute expiry. IQ Option’s chart-reading guide describes the 1-minute chart as “high-speed, very noisy”, and its guide to timeframes says it is usually too noisy for beginners. A 1-minute trade also leaves less time between the signal and the click. We did not test 1-minute candles, so no result is claimed for them.
Pros and Cons of Trading Candles on IQ Option
| Pros | Cons |
|---|---|
| Candles show the open, close, high and low, which is more than a line chart shows (IQ Option’s blog). | Candle patterns on their own may be misleading, according to the same blog. |
| The rule needs no indicator, only the chart. | A single-candle rule ignores trend, support and resistance, which the blog recommends checking. |
| It gives one signal at a time, so it is easy to record and to repeat. | A binary option pays a fixed percentage, so the rule has to win more than 54% of the time at an 85% payout to break even. |
| It can be rehearsed on a Practice balance at no cost. | Some novices find the amount of information on a candle chart overwhelming, and judging a “large body” takes practice. |
Candlestick patterns IQ Option’s blog describes
This table follows IQ Option’s blog. None of these patterns is part of the candle-colour rule.
| Pattern | Shape, as the blog describes it | What the blog says it may suggest |
|---|---|---|
| Hammer | Small body, lower shadow at least twice the body, after a downtrend; the colour does not matter | A bounce, if the next candle closes above the previous low or, better, above its body |
| Hanging Man | The same shape as the hammer, after an uptrend | A bearish trend may start; a declining candle after it confirms the reading |
| Shooting Star | Small body near the low and an upper shadow at least twice the body, after an advance | The uptrend may be losing steam; wait for the next candle to close lower |
| Engulfing | A candle followed by a larger one of the opposite colour that covers its full body; red then green at the end of a downtrend, green then red at the end of an uptrend | A possible reversal, up after the first and down after the second |
| Harami | A small candle of the opposite colour after a larger candle | A lasting trend or a reversal; the next candle shows which |
| Doji | Open and close very close together | Indecision; not always a reversal |
| Three White Soldiers, Three Black Crows | Three green candles after a decline, or three red ones after an advance, each opening within the previous body and closing near its extreme | A possible reversal; the next candle may confirm it |
| Morning Star, Evening Star | Three candles with a middle “star” that does not overlap the first body | A possible long position after a morning star, a possible short position after an evening star |
For every pattern the blog asks for confirmation, such as the next candle, an indicator like MACD or RSI, or trend lines, and it says no pattern is completely accurate. Our guides cover several: bullish engulfing, bearish engulfing, pin bars, three white soldiers, the morning star and the harami.
Troubleshooting and common mistakes
- The colours look different from this guide. The traderoom lets you change candle colours, and the Heikin-Ashi chart type averages the previous period’s prices. Choose the candlestick type in Step 2 and check which colour your chart uses for a falling candle.
- The trade does not close where you expected. The solid red line marks the expiration time. Check its position before you click, and wait for the next candle if it does not sit where the rule needs it.
- The payout is lower than the one you planned with. Recalculate the break-even rate, 1 / (1 + payout), with the figure next to the asset.
- The signal candle has a long shadow or a tiny body, or has not closed yet. Under the rule it is not a signal. Wait for a closed candle with a large body.
- You expect a stop loss. A binary option has none: it closes at the expiry time. IQ Option’s blog says an option can be sold before expiry with the Sell button; see selling options before expiration.
Conclusion
The candle-colour method is a short rule: a candle closes, you read its colour, and you open one option for one candle. It needs nothing but the chart, but in the sources we read it has no evidence behind it. IQ Option’s blog says candle patterns on their own may be misleading, and the test in our trading candles guide covers a replay of 331 signals on EUR/USD 5-minute candles from 29 September to 5 October 2026, in which 47.1% of the decided trades won. Treat this guide as a way to learn the platform and to practise a rule. Use the Practice balance, record every trade, and compare your win rate over a few hundred trades with the break-even rate for the payout you actually get before you risk money. If you add a martingale ladder, decide the last step you will accept before the first trade.
Related guides
- Trading candles on IQ Option: the rule and its test
- Martingale strategy calculator for IQ Option and martingale as money management
- Japanese candlesticks on IQ Option and price action and candlesticks
- Chart types on IQ Option and Heikin-Ashi candles
- Expiry times on IQ Option and chart time frames
- All indicator guides and all strategy guides
Frequently Asked Questions
Q: What do the colours of the candles mean on IQ Option?
A: A candle is green when its closing price is above its opening price and red when the close is below the open, according to IQ Option’s blog. The traderoom lets you change the colours, so check your own chart.
Q: How long should each candle last on my trading chart?
A: This guide uses 5-minute candles with a 5-minute expiry. The candle period button offers 5 seconds to 1 month. IQ Option’s blog calls the 1-minute chart “high-speed, very noisy”; no source we read names a period at which candle colours work better.
Q: Can I rely solely on candle colours to make trading decisions?
A: IQ Option’s blog says candle patterns on their own may be misleading and recommends confirming them with other analysis tools. This guide’s rule uses colour and body size only, and its test in our trading candles guide covers a replay of 331 signals on EUR/USD 5-minute candles from 29 September to 5 October 2026, in which 47.1% of the decided trades won; that is not proof that colour alone is enough.
Q: What win rate does the candle-colour method need to break even?
A: With a fixed payout, more than 1 / (1 + payout): more than 54% at an 85% payout and about 53.5% at 87%. A martingale ladder does not lower those figures.
Q: Is trading candles on IQ Option suitable for beginners?
A: IQ Option’s chart-reading guide recommends the candlestick chart to beginners because it shows the high, low, open and close in a colour-coded way, and says the basics can be learned in an afternoon while mastering them takes months of practice. Start on the Practice balance.
Q: How can I improve my skills in trading candles on IQ Option?
A: IQ Option’s blog suggests a five-step practice plan: pick one asset, lock in a higher timeframe, map the highs and lows, draw zones rather than lines, and wait and watch. Its plan starts on 4-hour or daily charts, not 5-minute ones. It also advises keeping a trade journal; see our trading journal guide.
Q: Should I trade with the Martingale system when using candle colours?
A: A ladder raises the stake after each loss but does not change the chance that a trade wins, and a losing run costs the sum of the stakes. Decide the last step you will accept before you start, and use the calculator in the martingale guide.
Q: Does a binary option have a stop loss?
A: No. A binary option pays a fixed percentage if it wins and closes at its expiry time; only a CFD (margin) trade has a stop loss and a take profit.