
Last updated: 8 October 2026. The calculator is our own tool. The chart screenshots were recorded on 8 October 2026 on an IQ Option Practice account registered in Brazil, and nothing was traded with real money. The candle-colour test below shows what the rule did on EUR/USD 5-minute candles recorded from 29 September to 5 October 2026; it says nothing about the next candle.
Loss-streak risk
Video tutorial
Martingale Risk Calculator
Visualize how a loss-recovery sequence grows, what balance it requires, and where a hard stop changes the exposure.
Important: Martingale can escalate losses very quickly and cannot remove the risk of ruin, platform limits, or losing streaks.
A martingale ladder raises your stake after every lost trade, so that the first win pays back all earlier losses plus the profit of the first trade. The calculator above shows the stake at each step, the total you have at risk and the chance of a long losing run. On a binary option a win pays less than the stake you risked (IQ Option showed 82% to 91% payouts on the assets we looked at), so the stake has to grow by more than 2 times at each step. At an 87% payout the multiplier is 2.15.
Quick answer
- Multiplier: (1 + payout) ÷ payout. At an 87% payout it is 2.15, not 2.
- What a win nets: only the first trade’s profit, at any step: $0.87 on a $1 start at 87%.
- What it risks: seven stakes ($1 first trade, 87% payout) add up to $183.86 in the calculator; the seventh alone is $98.79.
- Candle-colour test: a replay on EUR/USD 5-minute candles (29 September to 5 October 2026, 87% payout, $1 first stake, ladder stopped after six losses) made 272 trades: 123 won, 144 lost, 5 refunded, net -$232.68. Four sequences ended on the sixth loss, each costing $84.92.
- Break-even: a trade needs a win rate of about 53.5% at an 87% payout. A ladder does not change that.
Our martingale strategy calculator
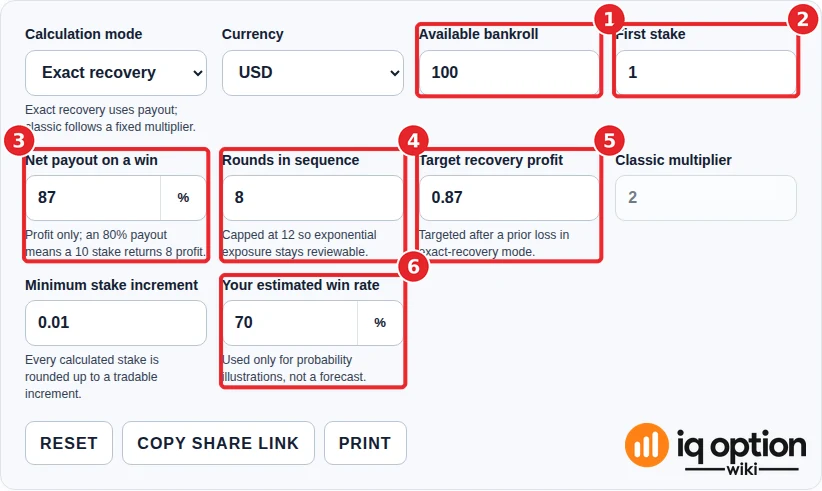
The calculator at the top of this page works in its default Exact recovery mode with six numbers. This is how to fill them in, with an example you can reproduce: a bankroll of $100, a first stake of $1, an 87% payout, eight rounds, a target profit of $0.87 and a 70% win rate. The screenshots are of the calculator as it stood on 8 October 2026.
Step 1: Enter your bankroll, first stake, payout, rounds, target and win rate
Type your available bankroll (1), the size of your first stake (2), the net payout on a win (3) and the number of rounds in sequence (4), which the tool caps at 12. Then set the target recovery profit (5): the tool starts with 8, which fits a $10 stake at an 80% payout, so for a $1 first stake at 87% enter 0.87, the profit of the first trade. Last comes your estimated win rate (6). The payout is the profit on a win as a percentage of the stake, as the trade ticket shows it before you buy (IQ Option showed 82% to 91% on the options we looked at). The win rate is the share of your trades that finished in profit, from your own trading history; the tool uses it only to illustrate probabilities, not as a forecast. Do not guess a high one: a rate you have not measured is the number that makes a ladder look safe. The other fields, calculation mode, currency, classic multiplier and minimum stake increment, can stay as they are: the multiplier is used only in the classic mode, and the increment rounds every stake up to the next cent.
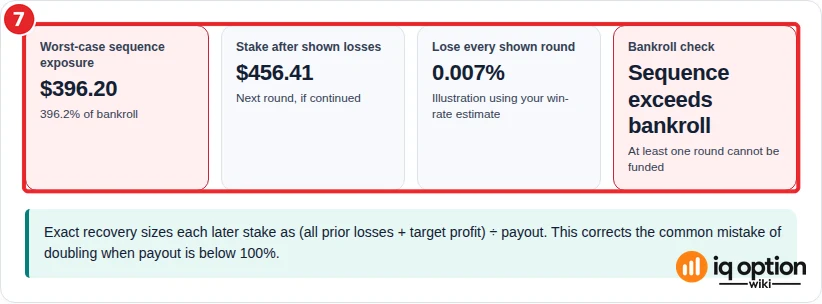
The four cards under the fields (7) summarise the sequence: the worst-case exposure (everything staked if every round loses), the stake after the shown losses, the chance of losing every shown round, and a bankroll check that says whether at least one round cannot be funded. With the example numbers the exposure is $396.20, 396.2% of the bankroll, so the check reads “Sequence exceeds bankroll”.
Step 2: Read the stake sequence
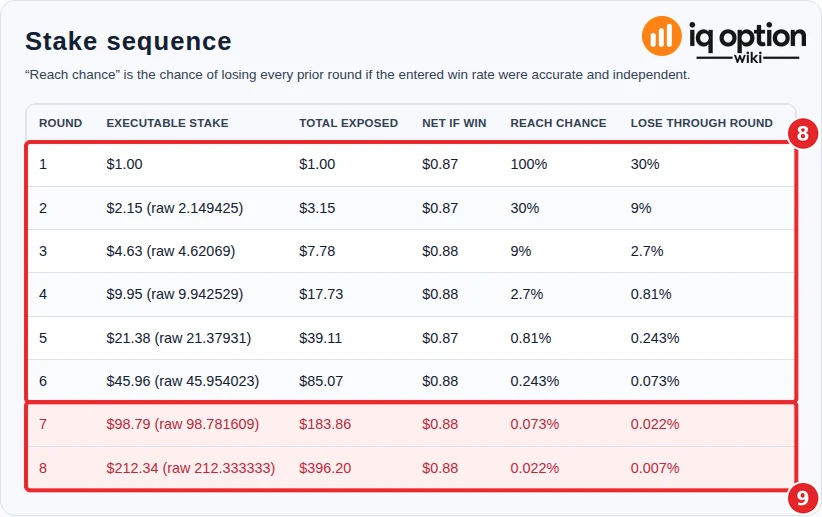
Each row of the stake sequence is one more loss in a row. Executable stake is the stake you would place, rounded up to the minimum increment, with the unrounded figure in brackets. Total exposed is everything staked so far, Net if win is what that round’s win would leave you with, Reach chance is the chance of losing every earlier round at your win rate, and Lose through round is the chance of losing up to and including that round. The rows without a tint (8) are the rounds your bankroll can pay for; the red rows (9) are the rounds it cannot. In the example the sixth stake, $45.96, is the last one affordable, and the seventh, $98.79, would take the total staked to $183.86, more than the $100 bankroll.
How the calculator gets each stake
After a loss, the calculator raises the stake just enough to win back every earlier loss and the profit of the first trade. The multiplier is (1 + payout) ÷ payout. At a 100% payout (an even-money bet) that is 2, classic doubling. At an 87% payout it is 1.87 ÷ 0.87 = 2.15, so the raw stakes in the calculator run $1, $2.15, $4.62, $9.94, $21.38, $45.95 and $98.78 (shown to the cent, each worked out from the rounded stakes before it); the calculator rounds each one up to the cent, which gives $1.00, $2.15, $4.63, $9.95, $21.38, $45.96 and $98.79. Whichever step finally wins, the whole sequence earns only the first trade’s profit: about $0.87 on a $1 start. A sequence of seven trades puts $183.86 at risk for that $0.87.
Trading on IQ Option using candle color only
The replay below uses this set-up: EUR/USD under Options and Binary, 5-minute candles with a 5-minute expiry, one trade per candle, any time of day. Choose the expiration time that ends when the next candle ends, so that the option covers exactly that candle. The payout changes by expiry and time of day. The calculator and the replay use 87%, while on 5 October 2026 the expiration list of the EUR/USD binary option showed 91% for the minute-by-minute times and 93% for the 15-minute ones.
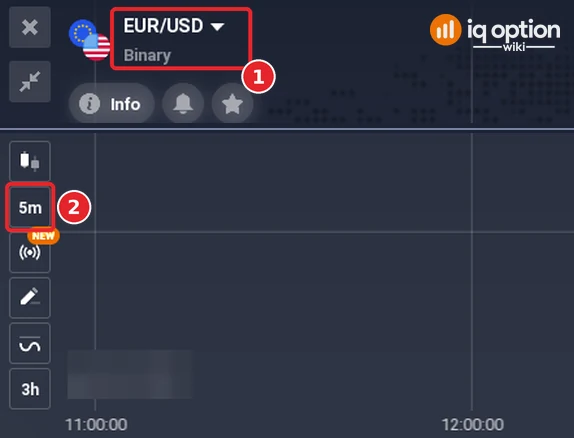
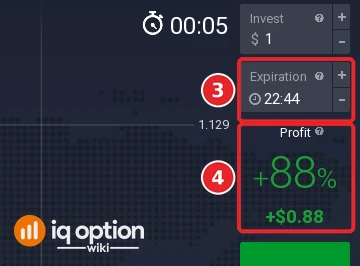
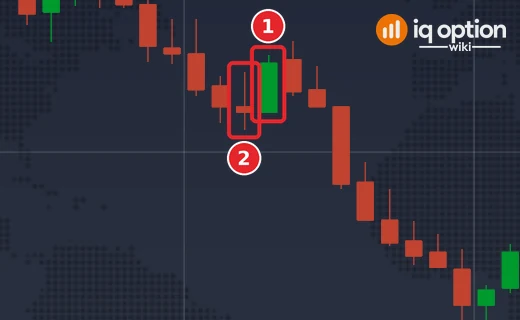
The system trades “true” candles, full-bodied ones, as opposed to special candles such as dojis and pin bars. We turned that into a number: the body, the distance between the open and the close, is at least 70% of the candle’s range, the distance between the high and the low. The system works in four steps. First, wait for a true candle; at the start any colour counts, and after a win only a candle of the opposite colour to the trade just made counts, so the trades alternate between Higher and Lower. Second, when it closes, open an option for the next candle in its colour: Higher after a green candle, Lower after a red one. Third, after a loss open the same direction again at once, with the stake multiplied. Fourth, after a win go back to the first stake. If the closing price ties with the entry price, the stake comes back and the same trade is repeated. The replay stops a sequence after six losses in a row and starts again with the first stake; a second run without that limit is reported as well.
How is Martingale calculated?
The ladder above is the same one a candle-colour trader uses: one trade at a time, and after a loss the same direction again at the open of the next candle with the multiplied stake. Here are the first stakes at an 87% payout, from the calculator (the replay below used the unrounded multiplier, so its dollar figures differ from these by a few cents):
| Round | Stake | Total staked | Net result if this round wins |
|---|---|---|---|
| 1 | $1.00 | $1.00 | +$0.87 |
| 2 | $2.15 | $3.15 | +$0.87 |
| 3 | $4.63 | $7.78 | +$0.88 |
| 4 | $9.95 | $17.73 | +$0.88 |
| 5 | $21.38 | $39.11 | +$0.87 |
| 6 | $45.96 | $85.07 | +$0.88 |
| 7 | $98.79 | $183.86 | +$0.88 |
How the replay went with martingale
The replay covers a week of candles: on EUR/USD 5-minute candles from 29 September to 5 October 2026 it made 272 trades in 127 sequences, of which 123 won, 144 lost and 5 were refunded, so 46.1% of the decided trades won. The break-even rate at an 87% payout is 53.5%. The first sequences show how it goes. On 29 September the first trade, Higher, won. The second sequence lost twice and won on the third trade, at a stake of $4.62. The third lost six times in a row, and a $100 balance, after the $0.87 won in each of the first two sequences, would have been down to $16.82 after the sixth loss. Over the whole replay, a $1 first stake with the six-loss limit ended at -$232.68; the ladder reached six losses in a row four times, and each time cost $84.92. Without the limit the same candles gave a longest losing run of 9, a stake of $979.27 after $851.09 of losses, and a result of +$107.88. The unlimited ladder happened to recover here, but it needed more than eight times the $100 balance of the example.
Tested on IQ Option: EUR/USD candles of 29 September to 5 October 2026
| Asset and candles | EUR/USD (binary), 5-minute candles recorded from IQ Option’s Practice traderoom: 1,334 candles in two stretches without gaps, 29 September 01:55 (open of the first candle) to 2 October 21:00 UTC (close of the last candle; 1,093 candles in this stretch) and 4 October 21:00 to 5 October 17:05 UTC (241 candles). Payout used: 87%. The replay places no orders and uses the logged prices. |
|---|---|
| Rule tested | A real candle has a body of at least 70% of its high-low range. The system waits for a real candle (any colour at the start, the opposite colour to the last trade after a win), opens Higher after a green one or Lower after a red one at its close, with a 1-candle (5-minute) expiry, repeats the same direction after a loss with the stake multiplied by (1 + payout) ÷ payout, 2.15 at 87%, and returns to the first stake after a win. A tie returns the stake and repeats the trade. A sequence stops after six losses in a row. |
| Trades in the replay | 272 trades in 127 sequences: 123 won, 144 lost, 5 refunded. Win rate among decided trades 46.1% (123 of 267), against a break-even rate of 53.5% at an 87% payout. |
| Ladder | $1 first stake; the six steps stake $1, $2.15, $4.62, $9.93, $21.34 and $45.88. Four sequences ended on the sixth loss, each losing $84.92 in total. Net result of the replay: -$232.68. A $100 balance would have been down to $16.82 after the first six-loss sequence (29 September). Without the six-loss limit (second run): 275 trades, 124 won, 146 lost, 5 refunded; longest losing run 9; largest stake $979.27 after $851.09 of losses; net +$107.88. |
This replay uses candles recorded from IQ Option’s Practice traderoom between 29 September and 5 October 2026 and placed no real orders. A week of candles proves nothing about the future: a ladder changes how much is staked, not how likely a trade is to win, and a result above or below zero over 272 trades can come from chance alone. A long losing run can cost a whole balance. No profit or win rate is promised. The six-loss limit and the 70% body share are our own choices, and different choices would give a different result. The replay rounded its stakes step by step, so its dollar figures differ by a few cents from the calculator’s ladder.
Does the Martingale strategy work?
It does what its arithmetic says and nothing more. The ladder changes how much you stake, not how likely a trade is to win. At an 87% payout a trade needs to win 53.5% of the time just to break even (1 ÷ 1.87), and a ladder does not move that figure. What the ladder does change is the shape of the result: many small wins of $0.87, and now and then a long losing run that costs a whole balance. If the first six trades of a sequence lose, you have staked $85.07 and the next stake is $98.79 (the replay’s unrounded figures were $84.92 and $98.61).
Can you get rich with Martingale?
Not by the ladder alone. A martingale needs a win rate above the break-even rate to have any edge, and you only know your win rate after a large number of trades. The risk is in the tail: at a 70% win rate, ten losses in a row has a probability of about 0.0006%, but at a 50% win rate it is about 0.1%, and seven losses in a row (the first stake you cannot afford on a $100 balance) is about 0.8% per sequence. You start a new sequence after every win, so over hundreds of trades the long run does arrive. Decide the number of steps you will accept before you start, and stop there.
Pros and Cons of Using the Martingale Strategy and Candle Color Trading Technique
| Pros | Cons |
|---|---|
| Easy to follow and to test on a Practice balance. | A losing run costs a lot: seven stakes at an 87% payout add up to $183.86 for a $0.87 gain. |
| Candle colours need no indicator, only the price chart. | It does not change the odds of a trade, and a trade needs to win about 53.5% of the time at 87%. |
| The calculator shows the cost of each step before you trade. | Your balance, not the strategy, decides how many losses you can survive. |
Notes for using this simple trading method
- Write the step limit down first. Use the calculator with your real balance and choose the last step you will accept. Stop the session when you reach it; do not add money to continue.
- Use the payout you see. Enter the payout shown on the ticket for the asset and expiry you trade, not 100%.
- Test on Practice. Switch to the Practice balance before you try any ladder, and count your wins over at least a few dozen trades.
- Read the related guides. Is the Martingale strategy suitable for money management in options trading? covers the same ladder from the money-management side, and trading candles on IQ Option tests the candle-colour rules in detail.
Frequently Asked Questions
Q: What is the martingale strategy on IQ Option?
A: A money-management rule: after a losing trade you raise the next stake so that one win recovers the earlier losses and the first trade’s profit. With a payout below 100% the multiplier is (1 + payout) ÷ payout, 2.15 at 87%.
Q: What payout should I enter in the calculator?
A: The profit percentage the trade ticket shows for your asset and expiry. We saw 82% to 91% on the options we looked at; the figure changes by asset and time.
Q: How many losses in a row can my balance cover?
A: Enter your bankroll, first stake, payout and target profit. The stake sequence tints the rounds you cannot fund red, and the bankroll check card says so. With $100, a $1 first stake, an 87% payout and a $0.87 target, six rounds are affordable and the seventh is not.
Q: Does a high win rate make the martingale safe?
A: It makes a long losing run less likely, not impossible. At a 70% win rate, seven losses in a row has a probability of about 0.02% per sequence, and you start a new sequence after each win.
Q: Does the candle-colour rule win often enough?
A: In our replay it did not: 123 of 267 decided trades won (46.1%) on EUR/USD 5-minute candles from 29 September to 5 October 2026, and a trade needs to win about 53.5% of the time at an 87% payout to break even. A week of candles proves nothing about the future, but nothing we read shows that a candle’s colour predicts the next candle.
Q: Can I use these strategies on other platforms?
A: The arithmetic is the same on any platform, but the multiplier depends on that platform’s payout, so use its payout in the calculator.

