The morning star pattern is a three-candle pattern that traders read as a possible bottom of a downtrend. Both trend followers and price action traders watch for it. When it appears at the end of a downtrend, it is a signal to look for a long entry, not a guarantee that the price will rise.
This guide will teach you how to identify a morning star pattern. Then, you’ll learn how to use it to trade on IQ Option.
Key Takeaways🔑
| →The Morning Star pattern is a bullish reversal pattern, signaling the end of a downtrend. |
| →It consists of three candles: a large bearish candle, a doji candle, and a large bullish candle. |
| →Combining the Morning Star pattern with other technical analysis techniques, such as support and resistance levels, can improve its reliability. |
What is the Morning Star pattern?
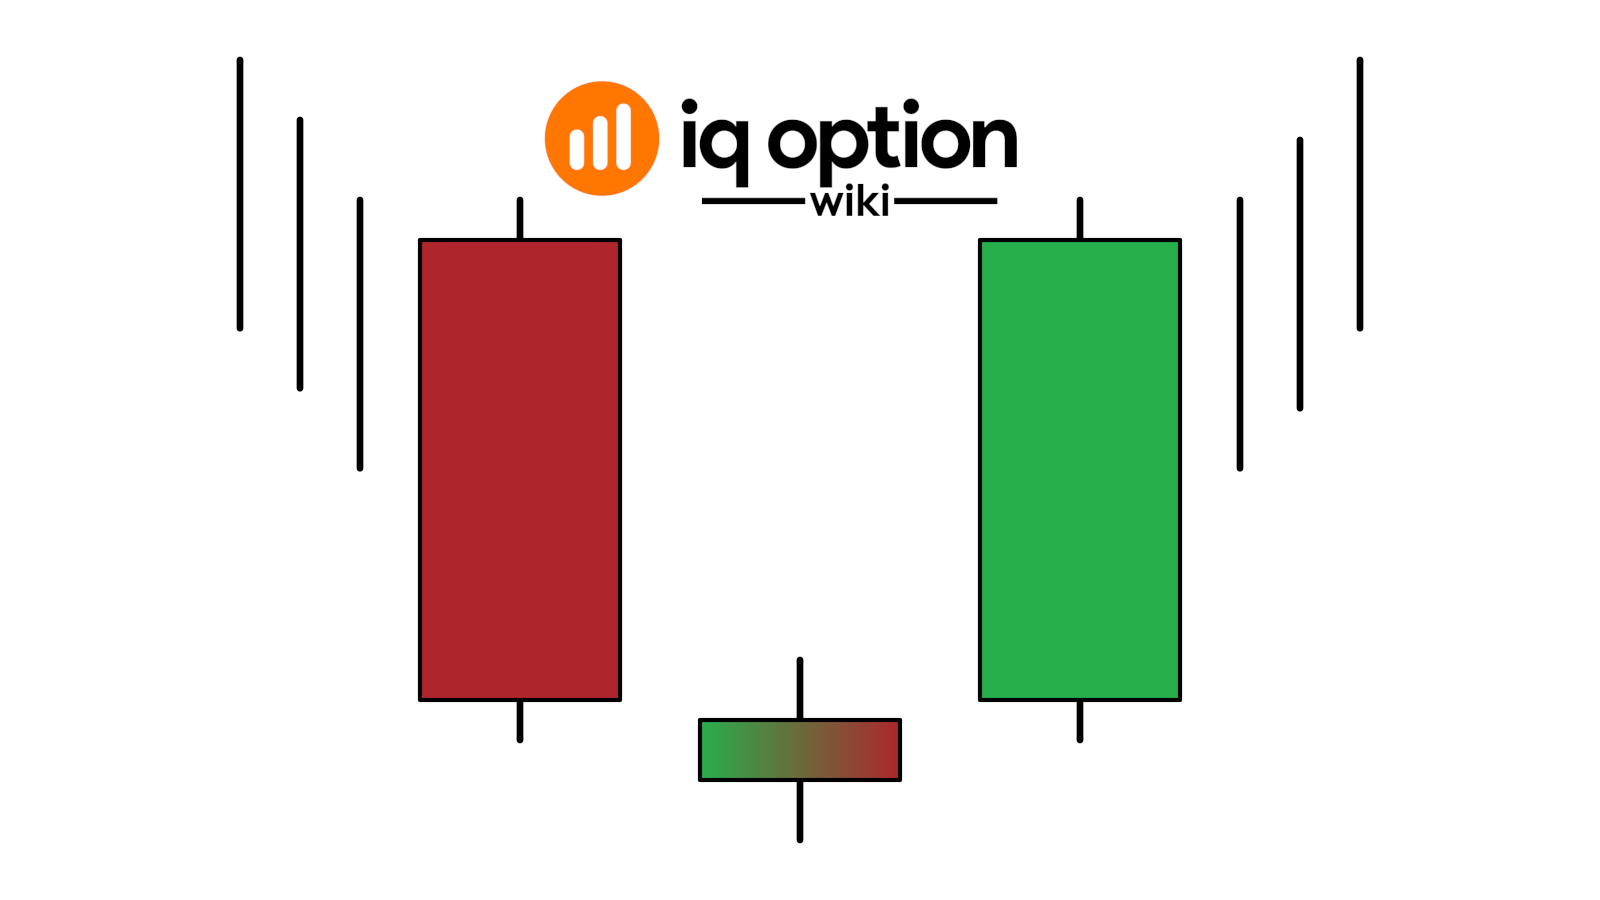
The morning star pattern consists of 3 candles. It forms at the bottom of a downtrend and signals a trend reversal. The first candle is usually a large bearish candle. This shows a large price drop as bears have control of the market.
 Identifying the morning star pattern
The middle candle is a doji. It shows indecision where the bulls step in driving the prices slightly up. What makes this candle unique is that it has a relatively small body with wicks on both ends. The session’s low is usually around the same price level as that of the previous bearish candle.
The next candle is a bullish candle. It’s usually large-bodied signalling that the bulls have finally taken over the markets and are driving prices up.
What does a Morning Star look like in trading?
There is one very important point that we make in all candlestick patterns. This issue is the trend. For any candlestick pattern to exist, there needs to be a trend preceding it. This does not have to be a long term and important trend, but it must exist and precede the pattern. In the case of the morning star pattern, the pattern has to be preceded by a downtrend. This downtrend may be a corrective move down in the main uptrend.
The idea is that there should be a market context for the reversal of the current market trend. If this pattern occurs, for example near the top of an uptrend, it is certainly not a morning star pattern, but only 3 candles that look like it.
What is the difference between Morning Star and Evening Star candlestick patterns?
The opposite pattern to the morning star is the evening star. Look for it in an uptrend. A long uptrend is followed by a doji candle which indicates the presence of sellers who are holding back the price. The 3rd candle in this pattern is usually a long body downtrend candle. The Evening Star formation is a bearish reversal pattern.
Interpreting the morning star pattern
After the bears control the market for some time, the bulls will eventually start getting in to prevent prices from going down further. As both bulls and bears tussle to have control over the markets, an indecision candle forms (doji). The bears lose the battle allowing the bulls to take control of the markets reversing the trend.
 Trading using the morning star pattern on IQ Option
Using the EUR/USD candles pattern above, you’ll notice that the support is suddenly broken by a large bearish candle. However, the bulls step in creating indecision.
The next session begins with a solid bullish candle. Your trade entry should be at the high of the doji candle. Here you should place a long (15 minutes or more) higher trade on your IQ Option interface. Notice that Each candle represents a 5-minute interval so holding the position for 15 minutes or more is recommended.
Pros and Cons of the Morning Star Pattern 📊
Pros: 😃
- Clear three-candle bullish reversal shape
- Can be observed in various timeframes and markets, but results vary
- Can be combined with other technical analysis techniques for improved results
Cons: 😞
- May produce false signals during periods of high market volatility
- Requires a preceding downtrend for proper identification
- Not suitable for short-term trading or scalping
Key Differences between Morning Star and Evening Star Patterns 🌟
| Morning Star | Evening Star |
|---|---|
| Bullish reversal pattern | Bearish reversal pattern |
| Forms at the bottom of a downtrend | Forms at the top of an uptrend |
| Large bearish candle, doji candle, large bullish candle | Large bullish candle, doji candle, large bearish candle |
Trading the Evening Star pattern: the bearish mirror
The Evening Star is the Morning Star turned upside down. It forms at the top of an uptrend from three candles:
- A long bullish candle. The buyers are still in control, but the uptrend may be close to exhaustion.
- A small candle, a doji or a spinning top. Its high is usually above the high of the first candle, but the sellers push the price back down: the market hesitates.
- A long bearish candle. It shows that the sellers have taken over and that the trend may have reversed.
Entry. Wait for the third candle to close completely, then place a sell (Lower) position at its close. Do not trade the pattern while it is still forming. How long to hold the trade depends on your chart interval: on 5-minute candles the earlier Evening Star guide held the position for 10 to 15 minutes, close to the 15 minutes or more suggested above for the Morning Star on that interval.
Context. As with the Morning Star, there must be a trend before the pattern, and the textbook case is an uptrend that has run for some time. Some traders also use the Evening Star in a downtrend: they wait for a rally against the main trend and read an Evening Star at the end of that rally as a sign that the downtrend resumes. Treat it as a filter, not a promise. Confirm it with a support or resistance level or a trend line, and on a margin (CFD) trade place the stop loss above the high of the pattern.
How reliable is the Morning Star pattern?
There are numerous analyses of this candlestick pattern. However, most of them concern studies on daily charts. Some traders assume that patterns that work on daily charts behave the same way on intraday time frames such as the 5-minute, 15-minute or hourly chart. We found no evidence for that, so test the pattern on the time frame you trade. In theory, the Morning Star pattern is a bullish reversal pattern.
We could not find a reliable success rate for the Morning Star. An earlier version of this page said that it heralds a change of trend to an uptrend in 75-80% of cases, but gave no source, so we removed the figure. How often it works depends on the market and the time frame. It is worth knowing as one signal among others, and worth testing on the Practice account before you trade it.
We remind you that all candlestick patterns can work even better if you combine them with other chart analysis techniques. Here, support and resistance levels immediately come to mind. It is not difficult to imagine when the price of an asset falls and reaches an important support level. If the Morning Star pattern then appears at that level, the signal is easier to read, although it can still fail.
That’s the morning star pattern at work. Now, try it out in your IQ Option practice account today and share your results in the comments section below.
If you have not Signed up for a Demo account yet, check here!
📈 Discover More Chart Patterns
Want to recognize patterns like a professional trader?
Q&A: Common Questions about the Morning Star Pattern ❓
- Q: How does the Morning Star pattern signal a bullish reversal?
A: The Morning Star pattern signals a bullish reversal as it shows a shift in market sentiment from bearish to bullish. The large bearish candle is followed by a doji, representing indecision, and then a large bullish candle, indicating that the bulls have taken control.
- Q: Can the Morning Star pattern be used in all timeframes and markets?
A: Yes, the Morning Star pattern can be used in various timeframes and markets, including Forex, stocks, and commodities. However, its reliability may vary depending on the market context and the timeframe used.
- Q: How can I improve the reliability of the Morning Star pattern?
A: Combining the Morning Star pattern with other technical analysis techniques, such as support and resistance levels, can improve its reliability. Also, being mindful of the market context and overall trend can help you avoid false signals.
- Q: Is the Morning Star pattern suitable for short-term trading or scalping?
A: The Morning Star pattern is generally not suitable for short-term trading or scalping due to its longer-term nature. It’s better suited for swing trading or longer-term trading strategies.
- Q: What is the opposite pattern to the Morning Star?
A: The opposite pattern to the Morning Star is the Evening Star, which is a bearish reversal pattern that forms at the top of an uptrend.