Last updated: 8 October 2026. Every screenshot below was recorded on 5 and 8 October 2026 (the Chart analysis panel in Step 6 is from 5 October) on an IQ Option Practice account registered in Brazil, on 5-minute EUR/USD candles. The candles in the three example pictures are from 28 September 2026, scrolled back on the same chart. We placed no real-money trade. The tested box shows what each candle-colour rule did on the candles of 29 September to 5 October 2026; it says nothing about what the rules will do next.
The candle-colour strategy trades the colour of a closed candle. Wait for a real candle, one whose body fills most of its range, and open a Higher option after a green candle or a Lower option after a red one, with an expiry of one candle (5 minutes). A second rule works the other way round: after four candles of the same colour in a row, trade the opposite colour. Both rules need nothing but the chart. Neither is shown to work by any source we read: IQ Option’s blog says candle patterns on their own may be misleading. This guide sets the chart up, writes both rules so that anyone can repeat them, replays them on recorded candles and shows what a martingale ladder costs.
Video tutorial
Quick answer
- Rule 1: after a closed real candle (body at least 70% of its range) open Higher if it is green and Lower if it is red, with a 5-minute expiry.
- Rule 2: after four closed candles of the same colour, trade the opposite colour; an optional EMA 200 filter keeps long trades above it and short trades below it.
- Setup: the candlestick chart type, 5-minute candles and a 5-minute expiry, which is a clock time in the Expiration box; according to IQ Option’s Help the trade closes at the solid red expiration line.
- Test result: in a replay on EUR/USD 5-minute candles from 29 September to 5 October 2026, Rule 1 gave 331 signals and won 47.1% of its 323 decided trades, and Rule 2 gave 170 signals and won 44.8% of its 165 decided trades, both below the 54.1% break-even rate at an 85% payout.
- Break-even: at an 85% payout a trade has to win about 54.1% of the time (1 ÷ 1.85); at 87%, 53.5%. A martingale ladder does not change that, and at 87% a $1 ladder has staked $183.54 by its seventh stake.
Guidelines for trading candle colors on IQ Option
A candle compares the closing price with the opening price of one period. A large body means the price moved a long way in one direction during that period. It does not mean it will continue: a trade after a large green candle can lose, because momentum in one candle does not decide how the next candle closes.
What Colour is a bullish candle?
IQ Option’s blog says a candle is green when it closes above its open and red when it closes below it, and that the traderoom lets you change the colours. On the chart we recorded, a falling candle was red. Green for up and red for down also matches the direction of the trade you open, so this guide uses them. Check which colours your own chart uses before you read any signal.
Which candle does the colour strategy trade?
A “real” candle has a large body and small or no shadows, and candles with small bodies and long shadows are skipped. Those words give no number, so the rule below reads “real” as a body of at least 70% of the candle’s high-low range; another reader could choose another share, and the result could change.
| Item | Rule 1: follow the colour |
|---|---|
| Chart | Regular candles (not Heikin-Ashi), 5-minute period |
| Signal candle | A closed candle whose body is at least 70% of its high-low range |
| Direction | A green candle: Higher. A red candle: Lower |
| Entry | At the close of the signal candle, as the next candle opens |
| Expiry | One candle: 5 minutes |
| After a win | Variant with alternation: wait for a candle of the opposite colour, so that green and red signals alternate |
| After a loss | Variant with a martingale ladder: enter again in the same direction at the next open, with a larger amount (see the martingale section) |
How to set up IQ Option for the candle colours strategy
These steps use the web traderoom on a Practice balance, which starts at $10,000 and has a Refill to $10,000 button. The numbers in each screenshot match the numbers in the text.
Step 1: Choose the asset
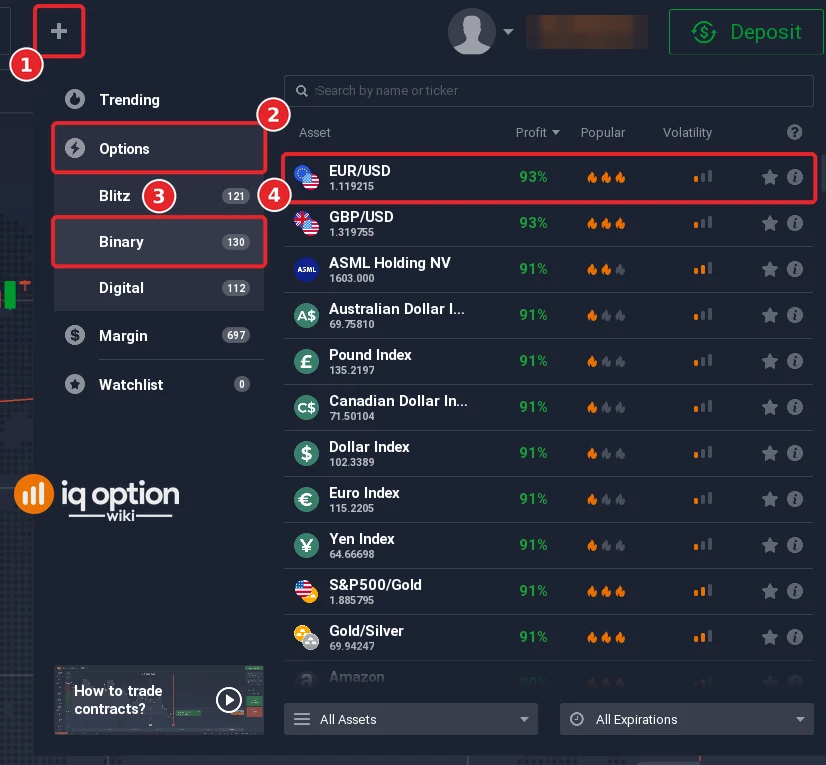
Click + in the top bar (1), open Options (2), choose Binary (3) and pick EUR/USD from the list (4). The list shows each asset’s payout. IQ Option showed payouts of 82% to 91% on options between 2 and 4 October 2026, and the percentage changes by asset and time, so read it next to the asset you choose.
Step 2: Set the candle type and the 5-minute period
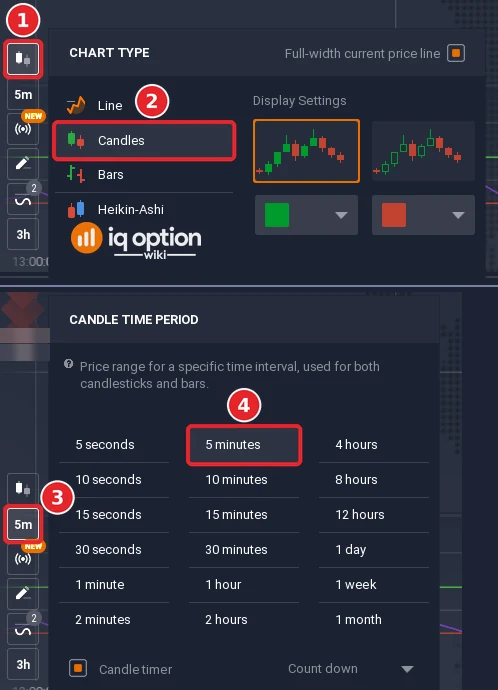
The chart toolbar sits at the bottom left of the chart. Click the chart type button (1) and choose Candles (2); the Heikin-Ashi type averages prices, and its colours do not match plain candles. Then click the candle time period button (3) and choose 5 minutes (4).
Step 3: Set the expiry to 5 minutes
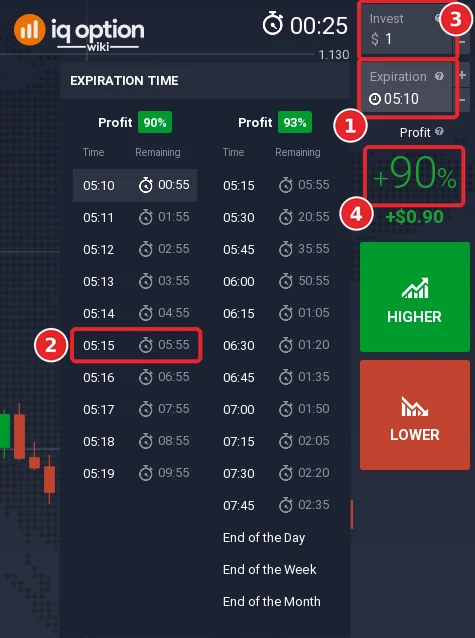
In the right-hand panel the Expiration box (1) shows a clock time, not a number of minutes. Click it to open the list of expiration times, which shows each time with the time remaining beside it. For a trade that covers one 5-minute candle, pick the time at which that candle ends, a multiple of five minutes (2): in the picture the platform clock reads 05:09, the next candle opens at 05:10, and 05:15 is its end, with 05:55 remaining. Enter the amount in the Invest box (3). The panel also shows the payout (4), +90% in the picture; the list shows Profit 90% over the minute steps and Profit 93% over the quarter-hour marks. According to IQ Option’s Help, the chart marks the purchase deadline with a white dotted line and the expiration time with a solid red line, and the trade closes at the red line whatever the candles are doing, so check the expiration time before you buy.
Step 4: Wait for a real candle to close
Look at the last closed candle, not the one that is still forming: a forming candle has no final colour, and its colour can change each time the price crosses its opening level. If the closed candle has a body of at least 70% of its range, it is a signal. A candle with a tiny body or long shadows is not.
Step 5: Open the option
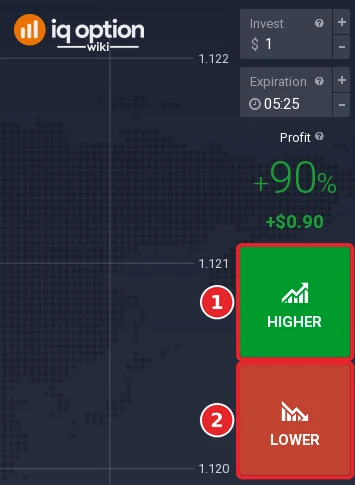
If the signal candle is green, click Higher (1); if it is red, click Lower (2). Click as the next candle opens, so that the option covers that candle. A binary option pays a fixed percentage if it wins and has no stop loss or take profit: it closes at the red line.
Step 6: Optional EMA 200 filter
The four-candle rule below has an optional filter, a 200-period exponential moving average. Click the indicators button (1) to open Chart analysis.

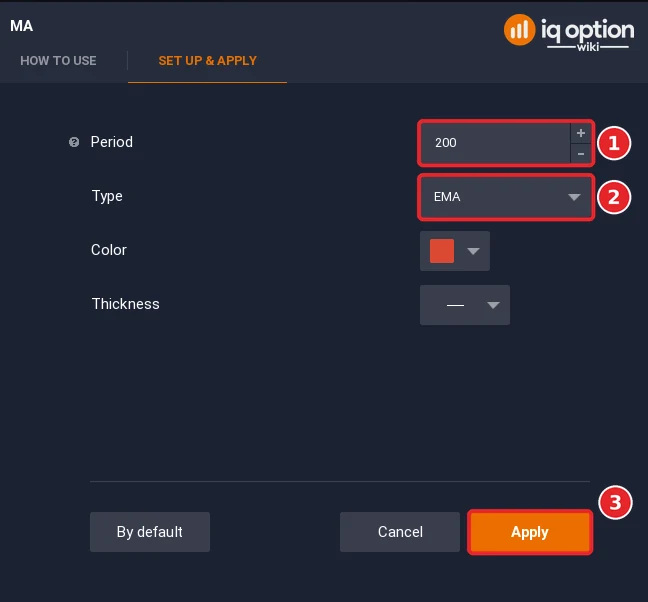
Open the Moving Average indicator and, on Set up & apply, set the period to 200 (1) and Type to EMA (2), then click Apply (3). The default period of the Moving Average in the published source code of the platform’s built-in indicators (Quadcode’s script library) is 14, so the period has to be changed.
How did the trading color candles work out?
The examples below come from the recording and from the replay of the rule, and they are listed whether they won or lost.
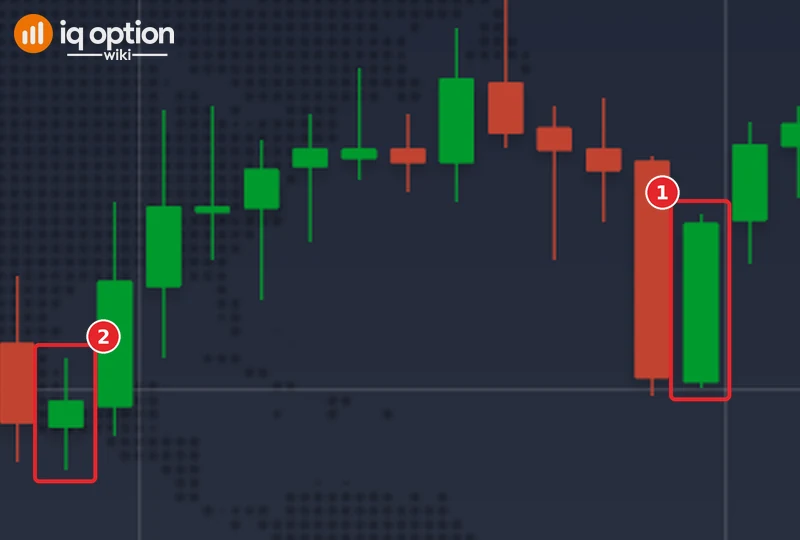
A green real candle: open Higher
The first real candle of our recorded series was green. It opened at 22:55 on the platform clock on 28 September 2026 (01:55 UTC) at 1.13651 and closed at 1.1367; its high was 1.13671 and its low 1.136505, so its body filled 93% of its range and it is a signal under Rule 1. A Higher option opened at that close, at 1.1367, and expiring five minutes later ended at 1.136795: it won. The next green real candle, at 23:10, won as well (entry 1.136935, exit 1.137075). We placed no order: the entry and exit prices come from the recorded candles.
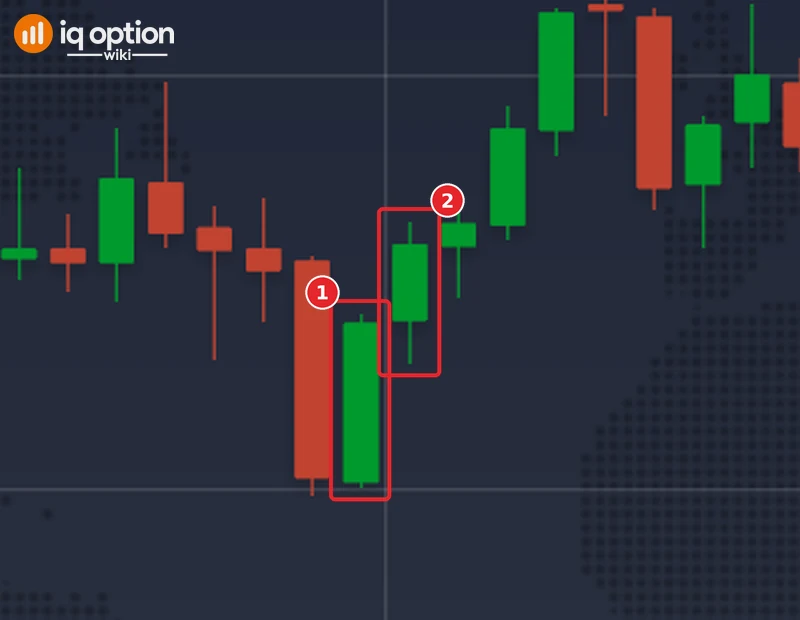
A red real candle: open Lower
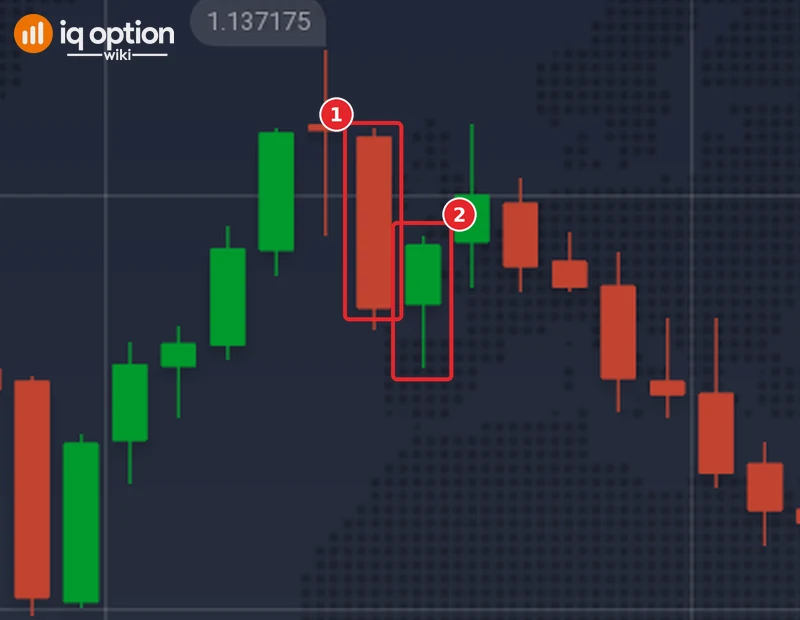
The first red real candle came at 23:25 on the platform clock (02:25 UTC): open 1.13707, close 1.136865, a body of 85% of its range. A Lower option opened at that close, at 1.136865, and expiring five minutes later ended at 1.13694, above the entry price, so it lost. The next red real candle, at 00:30 on 29 September, won (entry 1.136415, exit 1.13632). Of these four signals, three won, which says nothing about the rule: the 331 signals of Rule 1 in the tested box won 47.1%.
A losing trade and the next amount
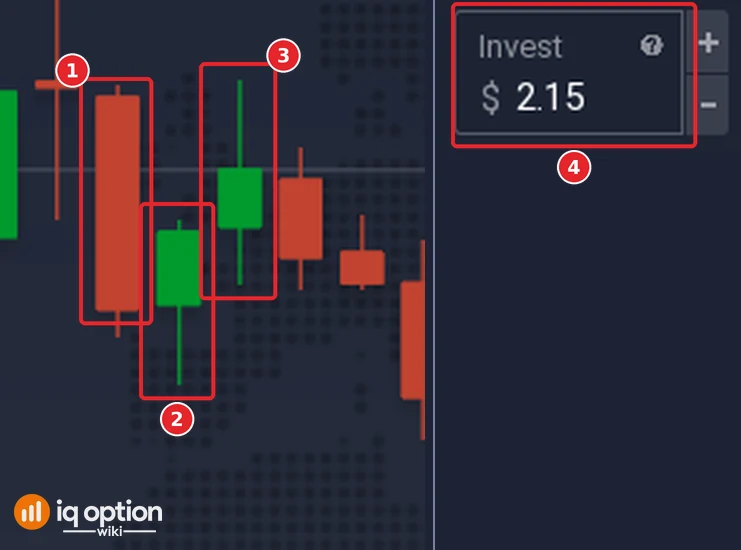
The same Lower signal shows what a loss means for the next amount. The $1 option from 23:25 lost. A ladder at an 87% payout then opens the same direction at the next open with a stake of 2.15 times the last (the Invest box (4) in the picture shows 2.15; we typed it and placed no order): entry 1.13694, exit 1.137, a second loss. The third stake, $4.62, entered at 1.137 and ended at 1.136915, and won: $4.02 of profit against the $3.15 lost before it, a net gain of $0.87, which is the first trade’s profit. The next sequence in the same replay did not end that way. From a signal candle at 00:15 platform time on 29 September, six Higher options in a row lost, at stakes of $1, $2.15, $4.62, $9.93, $21.34 and $45.88, $84.92 in all, and the ladder stopped there.
Tested on IQ Option: EUR/USD candles of 29 September to 5 October 2026
| Asset and candles | EUR/USD (binary), 5-minute candles recorded from IQ Option’s Practice traderoom: 1,334 candles in two stretches without gaps, 29 September 01:55 (open of the first candle) to 2 October 21:00 UTC (close of the last candle; 1,093 candles in this stretch) and 4 October 21:00 to 5 October 17:05 UTC (241 candles). The replay places no orders and uses the logged prices. |
|---|---|
| Rule 1 tested | A closed candle whose body is at least 70% of its high-low range: green means Higher, red means Lower. The option opens at that close and runs for one candle (5 minutes). Also run with alternation, which skips a signal that has the same colour as the previous one. |
| Rule 2 tested | Four closed candles of the same colour in a row: four red means Higher, four green means Lower, opened at the close of the fourth candle for one candle. Run without a filter and with a 200-period EMA filter. |
| Signals | Rule 1 (body at least 70%): 331 signals. With a body of at least 60%: 473; at least 80%: 202; with alternation: 152. Rule 2: 170 signals without a filter and 35 with the EMA 200 filter (the first 200 candles are skipped, so the filter needs the earlier history). |
| Outcomes | Rule 1: 152 won, 171 lost, 8 refunded; 47.1% of the 323 decided trades, a net of -$0.126 per $1 staked at an 85% payout. Body 60%: 217 won, 245 lost, 11 refunded (47.0%); body 80%: 90 won, 109 lost, 3 refunded (45.2%); alternation: 64 won, 86 lost, 2 refunded (42.7%). Rule 2 without a filter: 74 won, 91 lost, 5 refunded (44.8%); with the EMA 200 filter: 17 won, 17 lost, 1 refunded (50.0%). Rule 2 held for three candles instead of one: 78 won, 92 lost (45.9%). |
| Martingale replay | Rule 1 with the ladder at an 87% payout ($1 first stake, each stake 2.15 times the last, a win returns to $1, a sequence stopped after six losses in a row): 272 trades, 123 won, 144 lost, 5 refunded (46.1%), a net of -$232.68; the longest losing run was 6, the largest stake $45.88 and the most open at once $84.92, which happened in 4 sequences. The same replay without the stop ended at +$107.88 after a run of 9 losses, a stake of $979.27 and $851.09 lost before it; one run decided that result. |
| Break-even | At an 85% payout a trade has to win more than 54% of the time (1 / 1.85); at 87%, 53.5%. A martingale ladder does not change these figures. |
The numbers come from replaying candles recorded from IQ Option’s Practice traderoom: no order was placed, and each trade is scored at its expiry from the logged candle closes, with no spread, at an 85% payout (87% for the ladder). A short test proves nothing about the future: it covers one asset over a short stretch of candles, a rule that did well in it could lose tomorrow, and one that did badly could do better. A different body share would give different signals. No profit or win rate is promised. Compare the win rate with the break-even rate above, and repeat the test on your own Practice balance before you risk money.
The candles to avoid when trading using this strategy on IQ Option
The candles the rule trades are the real ones, with a large body and short shadows. The ones it skips have small bodies or long shadows. IQ Option’s blog describes several such shapes and what each may suggest, and none of them is a signal in this strategy.
| Shape | What IQ Option’s blog says | In this rule |
|---|---|---|
| Real candle, large body | Strong momentum in one direction | A signal |
| Doji | Open and close very close together, which shows indecision and is not always a reversal | Skipped |
| Hammer, shooting star | Small body with a long shadow on one side, read as a possible reversal that needs confirmation | Skipped |
| Long shadows on both sides | The price moved far and was pushed back | Skipped |
In this rule every entry is at the open of the next candle, and every trade lasts 5 minutes.
A second rule: trade against a run of four candles of the same color
The first rule follows the colour of one strong candle. The second rule starts from the idea that a run of candles of one colour does not go on forever, so after a run it trades the opposite colour. It needs no indicator, only the chart.
| Item | Rule 2: reverse a run |
|---|---|
| Chart | Regular candles, 5-minute period, trades that last 5 minutes |
| Long | Four closed red candles in a row: open Higher as the fifth candle begins |
| Short | Four closed green candles in a row: open Lower as the fifth candle begins |
| Optional filter | A 200-period EMA: long trades only with the close above it, short trades only with the close below it |
No source we read shows that a run of four candles reverses. The replay in the tested box is the only evidence on this page.
The risk: what a losing run costs
If the fifth candle goes the wrong way, a trader can enter again at the start of the next candle and triple the stake each time. On a $1 first stake with an 87% payout, the stakes run $1, $3, $9, $27 and $81. If the first four lose and the fifth wins, the win pays 81 × 0.87 = $70.47 against $40 lost, a net profit of $30.47 after $121 was staked. If the fifth also loses, $121 is gone and the next stake would be $243. Nothing in the rule makes a long losing run impossible, so decide in advance how many trades you will take.
Trading candles alongside the Martingale system: small returns for a large amount staked
A martingale ladder raises the stake after each loss. The version that wins back every earlier loss plus the first trade’s profit multiplies the stake by (1 + payout) ÷ payout, which at an 87% payout is 2.15 times the one before. A $1 first trade is followed by $2.15, $4.62 and $9.93. Whichever step finally wins, the whole sequence earns only the first trade’s profit, $0.87 on a $1 start.
| After this many losses in a row | Next stake at 87% (2.15 times) | Total staked, including that stake |
|---|---|---|
| 1 | $2.15 | $3.15 |
| 2 | $4.62 | $7.77 |
| 3 | $9.93 | $17.70 |
| 4 | $21.34 | $39.04 |
| 5 | $45.88 | $84.92 |
| 6 | $98.61 | $183.54 |
That is what “small returns for a large amount staked” means: when the ladder wins, the gain is small next to the amount at risk, and a long losing run costs the sum of all the stakes. The calculator in the martingale guide shows the ladder for your own balance and payout, and the anti-martingale approach does the reverse.
Pros and Cons of Trading Candle Colors Strategy
| Pros | Cons |
|---|---|
| It needs only the chart and the candle colours, no indicator. | No source we read shows that a candle’s colour predicts the next candle. |
| It is a short written rule that anyone can repeat and count. | At an 85% payout the rule has to win more than 54% of its trades to break even, and a martingale ladder does not change that. |
| You can rehearse it on a Practice balance at no cost. | A real candle needs a number for its body; without one, the rule is a judgement. |
| It gives one signal at a time. | Small-body candles and long shadows give no signal, and sideways markets give many that fail. |
Troubleshooting and common mistakes
- The colours look different from this guide. The traderoom lets you change candle colours, and the Heikin-Ashi type averages prices. Choose the candlestick type and check which colour your chart uses for a falling candle.
- The trade closes at a different time than you expected. The Expiration box shows a clock time, and according to IQ Option’s Help the solid red line marks the expiration time. Check the time before you click.
- The signal candle has not closed. The rule reads closed candles only.
- The payout is lower than you planned with. Recalculate the break-even rate, 1 / (1 + payout), with the figure next to the asset.
- The next stake is more than you can afford. Decide the last step you will accept before the first trade, and stop there.
- You expect a stop loss. A binary option has none. IQ Option’s blog says an option can be sold before expiry with the Sell button; see selling options before expiration.
Related guides
- Guide to trading candles on IQ Option: candle anatomy and patterns
- Strategy with 3 consecutive candles
- Martingale strategy calculator for IQ Option and martingale as money management
- How to trade with the EMA indicator on IQ Option
- Chart types on IQ Option and Heikin-Ashi candles
- Expiry times on IQ Option
- All indicator guides and all strategy guides
Frequently Asked Questions
Q: What is the main goal of the trading candle colors strategy?
A: To trade the colour of a closed real candle: a Higher option after a green one and a Lower option after a red one, with an expiry of one candle. It is a rule to test, not a method shown to win.
Q: Can this strategy be used on all assets?
A: The rule can be applied to any asset that has a candle chart and an expiry of one candle. The test in this guide covers EUR/USD 5-minute candles of 29 September to 5 October 2026 only, so it says nothing about other assets.
Q: What are the usual candle colours for this strategy?
A: Green for up and red for down, according to IQ Option’s blog. The traderoom lets you change them.
Q: Which candles does the strategy skip?
A: Candles with small bodies or long shadows, such as dojis and pin bars, because their body is below the share the rule needs.
Q: What win rate does the strategy need to break even?
A: More than 1 / (1 + payout): more than 54% at an 85% payout and about 53.5% at 87%. A martingale ladder does not lower those figures.
Q: Can I expect high returns when I add the Martingale system?
A: No source supports that. A ladder that wins earns only the first trade’s profit, and a losing run costs the sum of the stakes.
Q: Does a binary option have a stop loss?
A: No. It pays a fixed percentage if it wins and closes at its expiry time. Only a CFD (margin) trade has a stop loss and a take profit.