
Last updated: 8 October 2026. Every screenshot below was recorded on 8 October 2026 on an IQ Option Practice account registered in Brazil, on 5-minute EUR/USD candles of 1 October 2026 scrolled back on the same chart, and we placed no real-money trade. This guide writes the pin bar rule out so that it can be repeated and counted. The tested box shows what that rule did on a week of recorded candles; it says nothing about what it will do next.
A pin bar is a candle with a small body and one long shadow, the one that points the way the price was rejected. A long lower shadow after a fall is a bullish pin bar; a long upper shadow after a rise is a bearish one. Traders read it as the market testing a price and pushing back, which is why it is often read as a possible reversal. IQ Option’s blog calls it “a candle with a long wick and a small body” that “shows strong rejection of a price level”. We counted: in a week of 5-minute EUR/USD candles the written rule found 71 pin bars, and trading each one at its close for 5, 15 or 25 minutes won 46.5%, 40.8% and 42.9%, all below the 54.1% that a trade needs at an 85% payout.
Quick answer
- What it is: a candle with a small body and one long shadow, at least two thirds of its range in the rule used here. A long lower shadow after a fall is bullish; a long upper shadow after a rise is bearish.
- How to find it: by eye or by measuring: point at a candle and the box at the bottom left of the chart lists its Open, High, Low and Close. There is no pin bar tool.
- Trade: Higher after a bullish pin bar, Lower after a bearish one, at the close of the pin bar candle; or only after the next candle has the matching colour.
- Test result: in a replay on EUR/USD 5-minute candles from 29 September to 5 October 2026 the rule found 71 pin bars. Trading each at its close won 46.5% with a 5-minute expiry, 40.8% with 15 minutes and 42.9% with 25 minutes. Waiting for the colour of the next candle gave 34 signals and 32.4% to 38.2%.
- Break-even: at an 85% payout a trade has to win about 54.1% of the time (1 / 1.85); at 93%, about 51.8%. With 71 trades the win rate has a margin of error of about ±6 points (one standard error), so 46.5% cannot be told from break-even.
What is a pin bar candlestick?
The rule used here gives the pin bar a measurable shape: a small body, one long shadow of at least two thirds of the candle’s range, and a small shadow or none on the other side. A pin bar on its own says what happened inside one candle: the price went one way, was pushed back, and closed near where it opened.
| Feature | Bullish pin bar | Bearish pin bar |
|---|---|---|
| Long shadow | Below the body | Above the body |
| Where the body sits | Near the top of the candle | Near the bottom of the candle |
| Comes after | A fall | A rise |
| What it shows | Sellers pushed the price down and buyers pushed it back | Buyers pushed the price up and sellers pushed it back |
| Trade read from it | Higher | Lower |
A variant of the shape also asks that the open and close of the pin bar lie within the range of the candle before it (the “left eye”). We counted that variant too; see the tested box.
How do you find pin bars on IQ Option?
There is no pin bar tool or indicator: you find them by eye on a candlestick chart, or, as here, by measuring candles. These steps use the web traderoom on a Practice balance. The numbers in each screenshot match the numbers in the text.
Step 1: Choose the asset
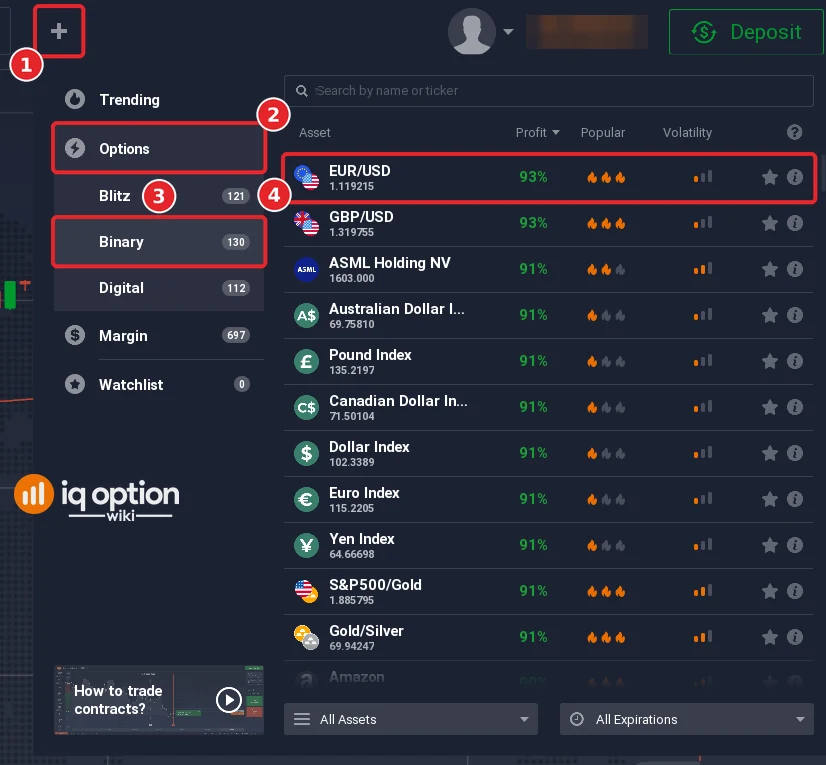
Click + in the top bar (1), open Options (2), choose Binary (3) and pick EUR/USD from the list (4). The list shows each asset’s payout: on 8 October 2026 EUR/USD showed 93%. Read it next to the asset you choose, because it changes by asset and over time.
Step 2: Set 5-minute candles
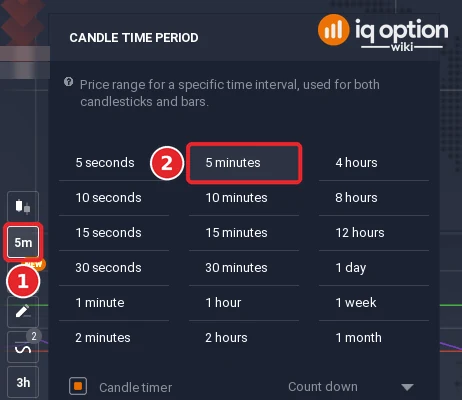
Check that the chart type is candlesticks, then click the candle time period button (1) in the chart toolbar and choose the 5-minute period (2).
Step 3: Measure the candle
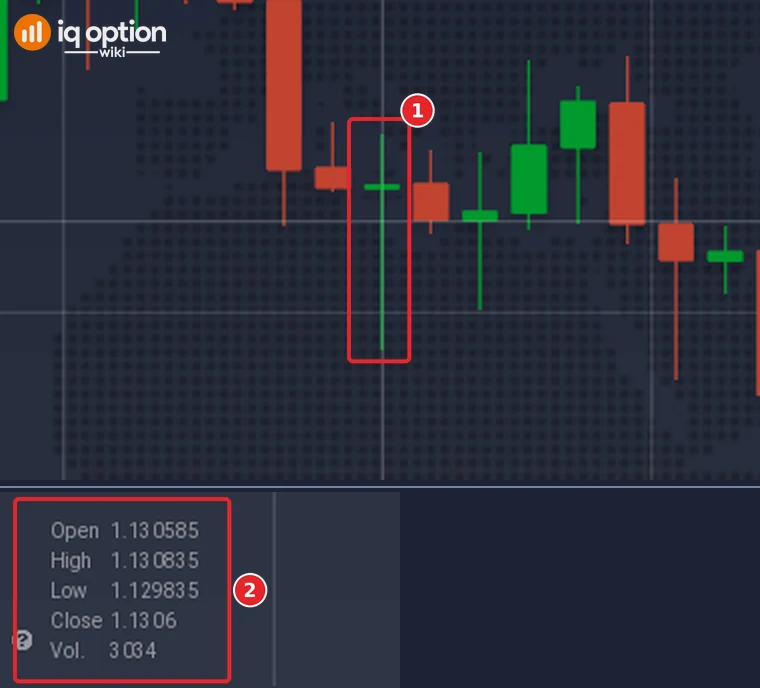
Point at a candle (1): the box at the bottom left of the chart (2) lists its Open, High, Low and Close. The times in this guide are the traderoom clock, which is UTC minus three hours, and a candle is named by the time it opens. Subtract to measure it: the range is the high minus the low, the lower shadow is the lower of the open and the close minus the low, and the upper shadow is the high minus the higher of the open and the close. In the picture the candle that opened at 04:30 on 1 October 2026 opened at 1.130585, reached 1.130835, fell to 1.129835 and closed at 1.130600: a range of 10.0 pips, a lower shadow of 7.5 pips (75% of the range), an upper shadow of 2.35 pips and a body of 0.15 pip.
How do you trade a pin bar?
Two readings of a pin bar are written out and counted here.
Reading 1: trade the reversal at the close of the pin bar
This reading waits until the pin bar is fully developed, which means until its candle has closed, and then enters against the move: Higher after a bullish pin bar, Lower after a bearish one. The rule we tested: the longer shadow is at least two thirds of the candle’s range, the range is at least half of the 14-period average true range (so that a tiny candle does not count), and the close before the pin bar is lower (bullish) or higher (bearish) than the close six candles earlier. Open the option at the close of the pin bar. We counted expiries of 1, 3 and 5 candles, which on 5-minute candles are 5, 15 and 25 minutes.
Reading 2: trade the colour of the next candle
This reading looks at the candle after the pin bar: green after a bullish pin bar means Higher, and the mirror (red) means Lower after a bearish one. Written out: after a pin bar, wait for the next candle; enter in the pin bar’s direction at its close only if that candle closed green (bullish pin bar) or red (bearish pin bar).
Two pin bars from 1 October 2026
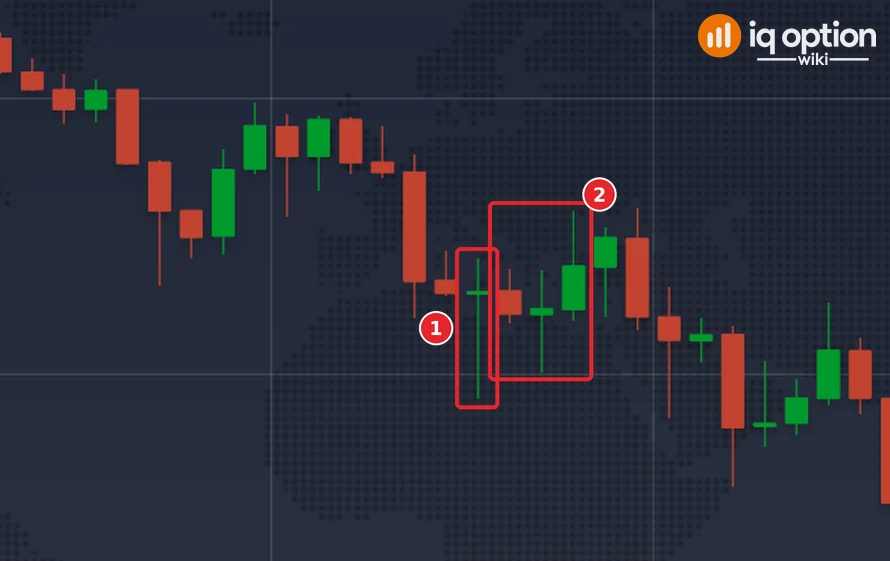
The 04:30 candle is a bullish pin bar after a fall: the close before it, 1.130590, was 12.1 pips under the close six candles earlier, and its lower shadow is 75% of its range (bullish example picture, 1). The rule opened a Higher option at its close, 04:35, at 1.130600. After 5 minutes the price was at 1.130440, a loss; after 15 minutes, at 04:50, at 1.130785, a win; after 25 minutes, at 05:00, at 1.130420, a loss. The 14:30 candle is a bearish pin bar after a rise of 8.2 pips: its upper shadow is 10.95 pips, 72.5% of its 15.1-pip range (bearish example picture, 1). The rule opened a Lower option at 14:35 at 1.123025. After 5 minutes the price was at 1.123220, a loss; after 15 minutes at 1.122795, a win; after 25 minutes at 1.122505, a win. The same pin bars give different results at different expiries, which is why the test counts all three.
Tested on IQ Option: EUR/USD candles of 29 September to 5 October 2026
| Asset and candles | EUR/USD (binary), 5-minute candles recorded from IQ Option’s Practice traderoom: 1,334 candles in two stretches without gaps, 1,093 candles from 29 September 01:55 UTC to 2 October 21:00 UTC and 241 candles from 4 October 21:00 UTC to 5 October 17:05 UTC. The traderoom clock used for the times in the guide is UTC minus three hours. Signals are counted from the 21st candle of each stretch. The replay places no orders and uses the logged prices. |
|---|---|
| Rule tested | Pin bar: the longer shadow is at least two thirds of the candle’s range and the range is at least half of the 14-period average true range. Bullish: the long shadow is the lower one and the close before the pin bar is lower than the close six candles earlier; bearish: the mirror. Reading 1: Higher (bullish) or Lower (bearish) at the close of the pin bar. Reading 2: the same, but only at the close of the next candle and only if it closed green after a bullish pin bar or red after a bearish one. |
| Signals | Reading 1: 71 pin bars (39 bullish, 32 bearish). Reading 2: 34 signals (17 and 17). Each signal is its own trade, and signals can sit on neighbouring candles, so the trades are not independent. |
| Outcomes, reading 1 | 5-minute expiry: 33 won, 38 lost (46.5%), a net of -$0.140 per $1 staked at an 85% payout. 15 minutes: 29 won, 42 lost (40.8%), -$0.244. 25 minutes: 30 won, 40 lost, 1 refunded (42.9%), -$0.204. |
| Outcomes, reading 2 | 5-minute expiry: 12 won, 20 lost, 2 refunded (37.5%). 15 minutes: 13 won, 21 lost (38.2%). 25 minutes: 11 won, 23 lost (32.4%). |
| Other settings | With a shadow of at least 60% of the range (15-minute expiry): 103 signals, 48 won, 54 lost, 1 refunded (47.1%). At least 75% (15-minute expiry): 30 signals, 11 won, 19 lost (36.7%). Without the move before the pin bar (15-minute expiry): 136 signals, 63 won, 73 lost (46.3%). With the open and the close inside the range of the candle before it (the ‘left eye’): 61 signals; 5-minute expiry 24 won, 37 lost (39.3%), 15 minutes 22 won, 39 lost (36.1%), 25 minutes 22 won, 38 lost, 1 refunded (36.7%). |
| Break-even | At an 85% payout a trade has to win about 54.1% of the time (1 / 1.85); at 93%, about 51.8%. |
The numbers come from replaying candles recorded from IQ Option’s Practice traderoom: no order was placed, each trade is scored at its expiry from the logged candle closes, with no spread, at an 85% payout. A short test proves nothing about the future: it covers one asset over a week of candles in which EUR/USD fell 108 pips in the first stretch and 56 pips in the second, which may favour the bearish pin bars, and a rule that did badly in it could do better on other days. The rule is our written version of a description of a shape, and other thresholds give other counts. No profit or win rate is promised. Compare the win rate with the break-even rate above, and repeat the test on your own Practice balance before you risk money.
What to add to a pin bar
IQ Option’s blog describes a reversal setup in which you “wait for a specific ‘reversal candle’ (like a Pin Bar or Engulfing Pattern) to appear at a major support or resistance level”. We did not turn this into a rule, because it needs a judgement about where the level is. Our guides on support and resistance and trendlines show how such lines are drawn, and the guide to pin bars with Bollinger Bands adds one more filter.
Pros and cons of trading pin bars
| Pros | Cons |
|---|---|
| The shape is easy to describe and to measure with the Open, High, Low and Close box. | The pattern describes one candle, and a candle that closed after a rejection does not say what the next ones will do: the reversal rule lost in our week. |
| It needs no indicator and works on any candle size. | A rule needs numbers (how long a shadow, what counts as a move before it) and the results changed with them. |
| It can be read together with a support or resistance level (IQ Option’s blog). | Pin bars appeared often, and the colour reading cut the signals to half and did worse. |
Common mistakes
- Trading a pin bar before its candle has closed. A shadow that is long four minutes into a candle can be short when that candle closes.
- Treating every long shadow as a signal. The rule used here asks for a shadow of at least two thirds of the candle’s range and for a move before the pin bar: a fall before a bullish one, a rise before a bearish one.
- Expecting the next candle to confirm it. In our week waiting for the colour of the next candle halved the signals and lowered the win rate to 32.4% to 38.2%, against 40.8% to 46.5% for trading the pin bar at its close.
- Ignoring the expiry. The same pin bars won 46.5% at 5 minutes and 40.8% at 15 minutes: the choice of expiry is part of the rule.
- Forgetting the break-even rate. At an 85% payout a trade has to win about 54.1% of the time, and at the 93% that EUR/USD showed on 8 October, about 51.8%.
Related guides
- Pin bar candles with Bollinger Bands
- Five entry signals on IQ Option
- Support and resistance lines on IQ Option
- The rebound pattern on IQ Option
- Trendline trading on IQ Option
- Chart patterns on IQ Option
- All indicator guides and all strategy guides
Frequently Asked Questions
Q: What is a pin bar candlestick?
A: A candle with a small body and one long shadow, at least two thirds of its range in the rule used here. A long lower shadow is bullish and a long upper shadow bearish.
Q: How can I tell whether a pin bar is a reliable signal?
A: We could not show that it is. In a week of 5-minute EUR/USD candles the written rule won between 40.8% and 46.5% depending on the expiry, below the break-even rate. IQ Option’s blog says pin bars are commonly used near support or resistance and with confirmation.
Q: Can I trade pin bars on short expiries?
A: Yes, an option can have any expiry that the Expiration box offers. Our test counted 5, 15 and 25 minutes on 5-minute candles; the shortest came closest, and still lost.
Q: Does the colour of the next candle confirm a pin bar?
A: Not in our week: waiting for it cut the signals from 71 to 34 and the win rate to between 32.4% and 38.2%.
Q: Where is the pin bar indicator on IQ Option?
A: There is none that we found: the Chart analysis panel lists indicators, and a pin bar is a candle shape that you find on the chart yourself.

