Key Takeaways🔑
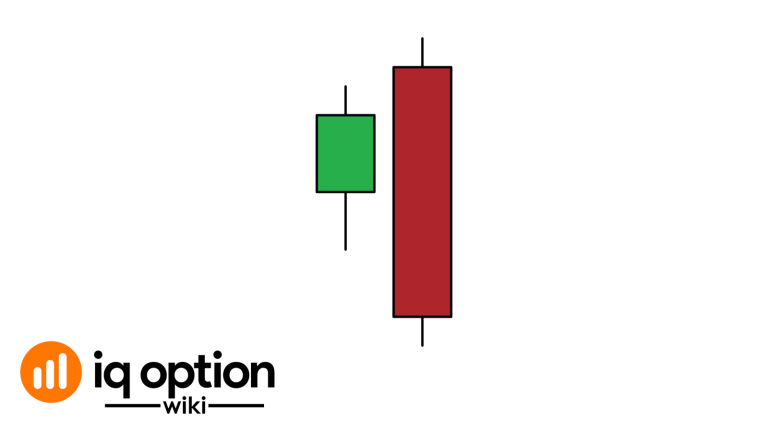
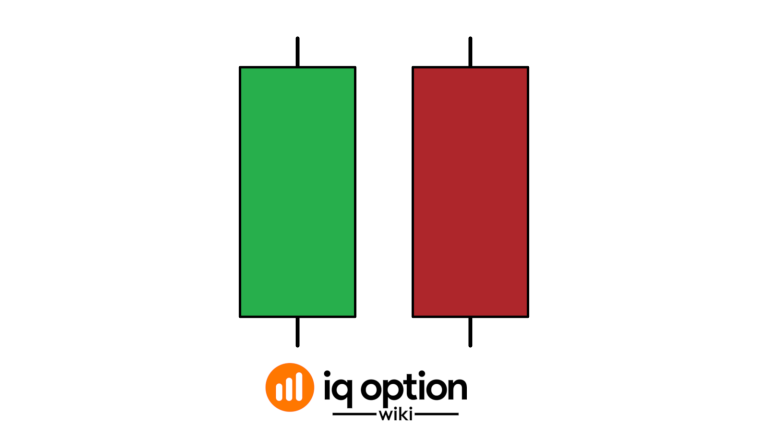
| →The bullish engulfing pattern is a two-candle reversal pattern: a larger bullish candle that engulfs the body of the bearish candle before it, at the end of a downtrend. |
| →Wait for the pattern to complete and confirm it with another tool, such as a support level, before you trade it. |
| →Always perform your own research and analysis before investing on any platform, including IQ Option. |
| →The bullish engulfing candle pattern is a trend reversal pattern that signals a developing uptrend, and it can be used for trading on IQ Option. |
What is a bullish engulfing pattern?
Today we will look at one of the most commonly used candlestick formations which is the Bullish Engulfing pattern. You can see its layout below.
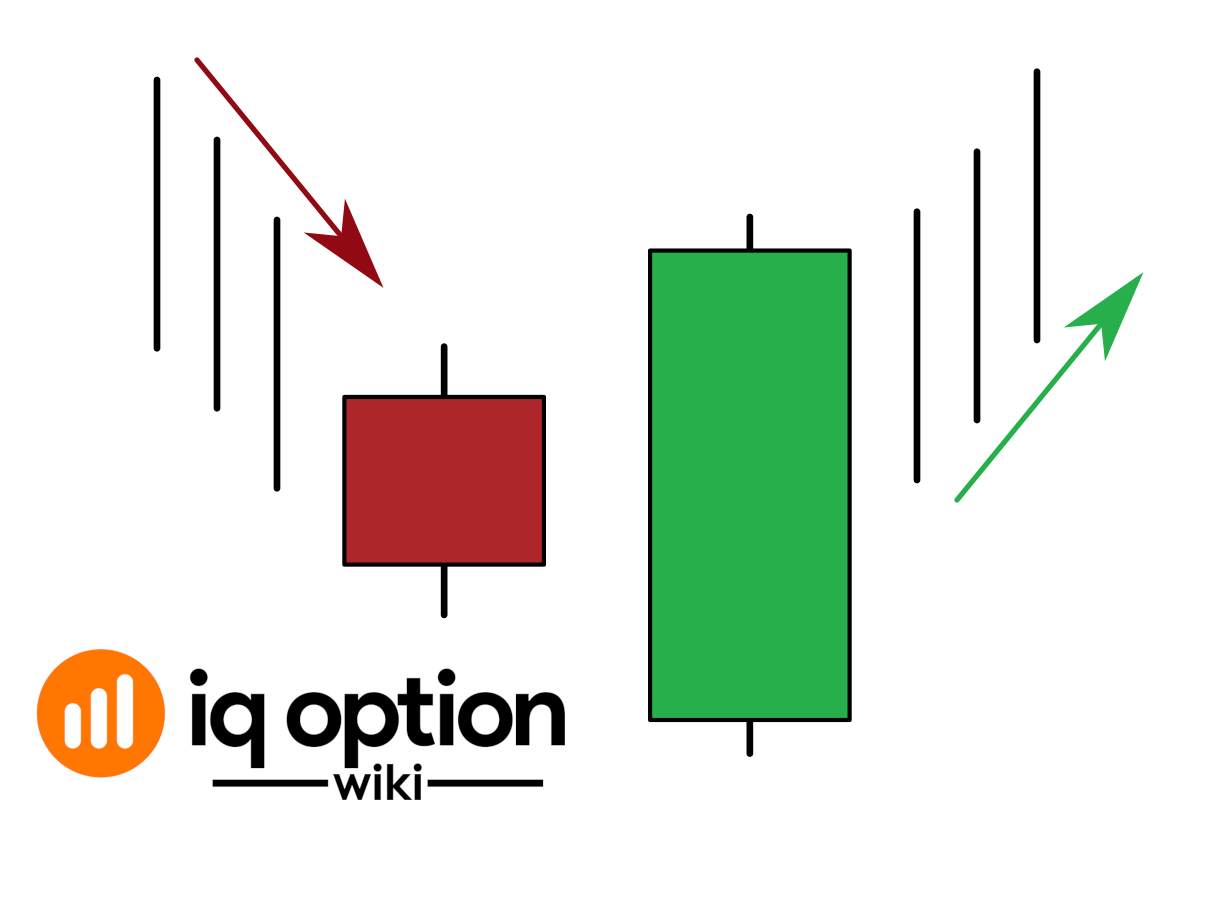 Bullish Engulfing Pattern
The bullish engulfing candle pattern is a trend reversal pattern. In particular, it develops at the end of a downtrend signalling a developing uptrend. It consists of a pair of candles.
The first candle is an orange bearish candle. On the IQ Option platform, it will have short wicks.
Right after this candle is a longer bullish (green candle). What’s special about this candle is that the opening and closing are both lower and higher than those of the previous bearish candle. Thus the engulfing bullish pattern means this candle completely engulfs the previous bearish candle.
What does engulfing pattern indicate?
As the downtrend continues, the sellers are becoming exhausted. The small bearish candle at the end signals this. At the beginning of the next session, prices fall dramatically. But the buyers jump in driving the prices higher. At the end of this session, the trend has reversed and started rising. This is a good time to enter a buy position to take advantage of the rising trend.
📈 Discover More Chart Patterns
Want to recognize patterns like a professional trader?
How do you use the bullish engulfing pattern on IQ Option
 3 consecutive bullish engulfing patterns on AUDUSD chart
As mentioned, this is a trend reversal pattern that signals a change from a bearing trend to a bullish trend. This means that immediately after you spot this pattern, you must enter a buy trade.
Using the AUDUSD chart above, we have a Japanese candle sticks chart with 5-minute candles. There are 3 bullish engulfing patterns. It’s worth noting that in this chart, the green candles don’t completely engulf the orange candles. Their opening prices are at almost the same level as the closes of the orange candles. But what we’re looking for is whether the green candles’ closes are higher than those of the orange ones.
Now, when should you enter a buy position?
As the 5-minute green candle develops, wait until the price reaches the opening of the previous orange candle. Enter a 5 minute buy trade. In this example the trade would have been a winner by the time it expired and the green candle ended, but no entry rule guarantees that. If you’re using candles of a longer time frame for example 30-minute, you can enter longer buy positions lasting 30 minutes or more.
Pros and Cons 😄😕
- ✔️Pros: The bullish engulfing candle pattern is a widely used and reliable trading strategy that signals a change from a bearish trend to a bullish trend. It can be used in different charts and intervals. No result is guaranteed.
- ❌Cons: Trading always carries a risk, and the bullish engulfing candle pattern is not a foolproof strategy. It requires careful analysis and research before investing, and it may not work in all market conditions.
| The pattern indicates a trend reversal from bearish to bullish. | ✔️ |
| The pattern is easy to identify on charts. | ✔️ |
| It can be used on different charts and time frames. | ✔️ |
| It’s essential to wait for the confirmation of the pattern before opening a position. | ❌ |
| It’s a high-risk pattern, and you should always perform your own research before trading. | ❌ |
How reliable is bullish engulfing?
A bullish engulfing pattern occurs frequently on charts of different assets and on different intervals. How often it works depends on the market and the time frame. We could not find a reliable success rate, and no pattern works every time. Trading it at an important support level, for example, can give a clearer signal, but test it on the Practice account first.
It should also be remembered that on intraday charts the price changes smoothly between candles, hence the pattern itself does not look as nice on the charts as it does on the diagram. What we are to find on the chart is a candle that with its upward long body covers the body of the downward candle preceding it.
The only way to learn how to identify the bullish engulfing candle pattern is by actually trading. Open an IQ Option practice account today and start practicing with it. We’d love to hear your experiences in the comments section below.
Good luck.
Q&A
- What is the bullish engulfing pattern?
The bullish engulfing pattern is a trend reversal pattern consisting of a pair of candles that develops at the end of a downtrend signalling a developing uptrend. - How do you use the bullish engulfing pattern on IQ Option?
To use the bullish engulfing pattern on IQ Option, you must enter a buy trade immediately after spotting the pattern. - When should you enter a buy position using the bullish engulfing pattern on IQ Option?
You should enter a buy position when the 5-minute green candle develops and wait until the price reaches the opening of the previous orange candle. - How reliable is the bullish engulfing pattern?
The bullish engulfing pattern occurs frequently on charts of different assets and on different intervals, but it does not work every time and we could not find a reliable success rate. Test it on the Practice account and confirm it with other tools. - How can you identify the bullish engulfing candle pattern?
You can identify the bullish engulfing candle pattern by practicing trading it.
Open an IQ Option practice account today and start practicing with the bullish engulfing candle pattern. Remember to always perform your own research and analysis before investing on any platform, including IQ Option.