Last updated: 8 October 2026. The chart-type menu was recorded on 5 October 2026 and the two chart comparisons on 8 October 2026, all on an IQ Option Practice account registered in Brazil, on EUR/USD. We placed no real-money trade. The formulas are the standard ones, and the counts of colour changes are computed from the 1,334 five-minute EUR/USD candles we recorded between 29 September and 5 October 2026. The entry rules are explained, not tested.
Heikin-Ashi candles are candles drawn from averaged prices instead of the prices that were traded. They look like normal candles, with a body and wicks, but each one is calculated from the candle’s own open, high, low and close and from the previous Heikin-Ashi candle, so a trend appears as a longer run of one colour. On IQ Option you switch to them in the chart type menu, and by default the rising candles are blue and the falling ones red. On our recorded candles the average run of one colour was 4.3 candles on a Heikin-Ashi chart and 1.9 on a normal chart.
Quick answer
- What they are: candles drawn from averaged prices. Close = (open + high + low + close) ÷ 4; open = (previous Heikin-Ashi open + previous Heikin-Ashi close) ÷ 2.
- On IQ Option: the first button of the chart toolbar, CHART TYPE, Heikin-Ashi. By default rising candles are blue and falling ones red.
- Smoother, in numbers: on 1,334 recorded 5-minute EUR/USD candles the colour changed 309 times on Heikin-Ashi and 681 times on normal candles; the average run was 4.3 against 1.9 candles.
- Not traded prices: the price of a Heikin-Ashi candle is not a price you can trade; use a normal candle or the order panel.
- Not tested here: the entry ideas (a long candle after a range, and with the Stochastic) are explained, not tested.
Heikin Ashi candles explained
A Heikin-Ashi candle has a body and wicks, like a Japanese candle, but its prices are calculated. Because each candle starts from the middle of the previous candle’s body, the series is smoothed: small reversals do not change the colour. The colour compares the averaged close of the candle with the middle of the previous candle’s body; it is not the comparison of the traded close with the traded open that a normal candle shows. The prices of a Heikin-Ashi candle are not traded prices, so use a normal candle or the order panel for the exact price.
How to calculate Heikin Ashi candles?
Each candle is built from the real candle of the same period and from the previous Heikin-Ashi candle:
| Value | Formula |
|---|---|
| Close | (open + high + low + close) ÷ 4, all four from the real candle |
| Open | (open of the previous Heikin-Ashi candle + close of the previous Heikin-Ashi candle) ÷ 2; the first candle uses (open + close) ÷ 2 of the real candle |
| High | The highest of the real high, the Heikin-Ashi open and the Heikin-Ashi close |
| Low | The lowest of the real low, the Heikin-Ashi open and the Heikin-Ashi close |
The table above is the standard definition. The chart does this for you.
Setting up Heikin Ashi candles on IQ Option
These steps use the web traderoom on a Practice balance. The numbers in each screenshot match the numbers in the text.
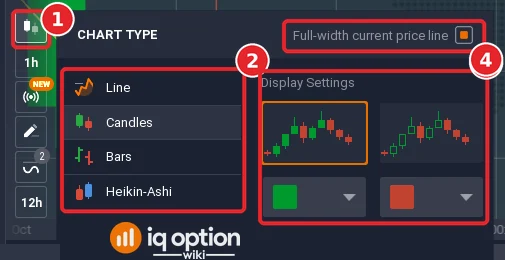
Click the first button in the tool column at the bottom left of the chart (1). The CHART TYPE menu opens with the four types (2): Line, Candles, Bars and Heikin-Ashi. Click Heikin-Ashi. Display Settings (3) lets you change the colours of the rising and falling candles. The menu is explained in chart types on IQ Option.
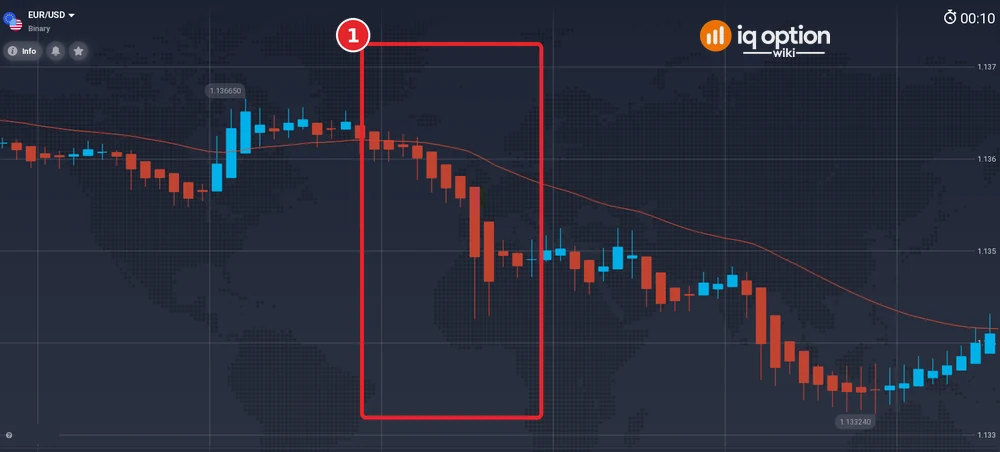
Step 2: Look at the same stretch of price on a normal chart
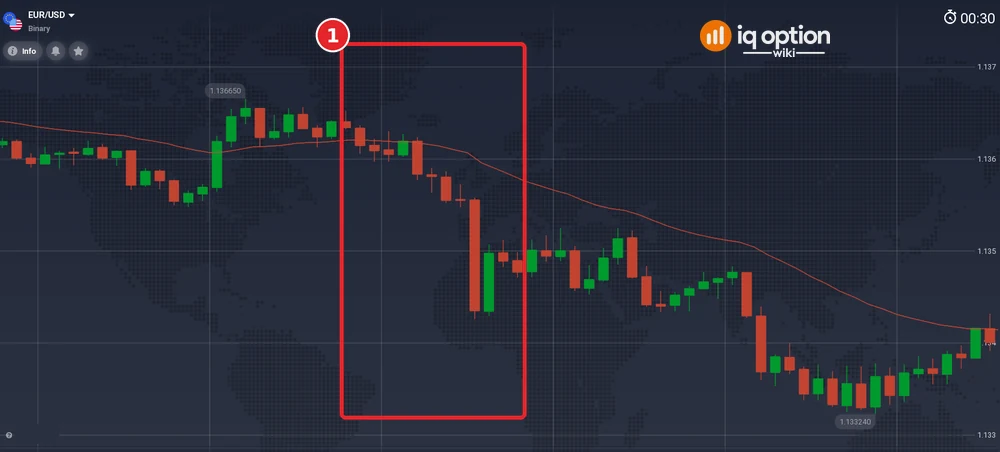
This is EUR/USD on 5-minute candles on 29 September 2026, from 02:00 to 07:50 on the platform clock (UTC−3), 71 candles, with an EMA 30 line that we added for another test. In the stretch marked (1), from 03:50 to 04:45, the price falls; ordinary candles show it as red candles broken by two green ones.
Step 3: Switch to Heikin-Ashi and compare
The same window drawn as Heikin-Ashi candles. The same stretch (1) is twelve red candles in a row. Over the whole window the colour changes 40 times on the normal chart and 15 times on the Heikin-Ashi chart.
Trading using Heikin Ashi candles on IQ Option
Heikin-Ashi candles are usually used for longer positions, and a trend shows as candles of one colour: with 1-minute candles the trades should last at least 5 minutes, and with 5-minute candles 15 minutes or more, and the entry is taken only when a clear trend is developing, because in a range the colours keep alternating. No further numbers are given, so none of it is tested here. What the data says is about the chart, not about trades: across all 1,334 candles the colour changed 309 times on a Heikin-Ashi chart and 681 times on a normal chart, and the longest run was 36 candles against 12. A chart that changes colour less often gives fewer signals, and a signal that comes after a long run is a late one.
Trading with Heikin Ashi candles without any indicators
A common idea watches the colour: after a range in which the colours alternate, a long candle in one direction is the entry. The rule has no definition of “long” or “range”, and we did not test it. If you want to try it on the Practice balance, write the definition down first, for example the number of candles of one colour after which you enter, and count at least a few dozen signals; IQ Option’s blog says most strategies need dozens, and often hundreds, of trades before a result means anything.
Using Heikin Ashi candles alongside the Stochastic Oscillator indicator
Another common idea adds the Stochastic Oscillator to the Heikin-Ashi chart and reads the crossing of %K and %D together with the overbought and oversold lines. How the indicator is built and set up is in the Stochastic guide. Note that the platform calculates indicators from the candles of the chart: on a Heikin-Ashi chart some of them use the Heikin-Ashi values, as we found for Weis Wave Volume, so a signal can differ from the one on a normal chart.
Pros and Cons of Using Heikin Ashi Candles
| Pros | Cons |
|---|---|
| Smoother: the colour changed 309 times in 1,334 candles instead of 681, so trends show as longer runs. | The open, high, low and close are calculated, not traded prices; the real price is not on the candle. |
| Easy to switch: one menu, and indicators can be added to a Heikin-Ashi chart as to any other; the Weis Wave Volume panel was drawn on one in our recording. | The smoothing makes it lag: a turn shows up after the real candles have already turned. |
| You can still compare with normal candles on the same asset and period. | The patterns defined on real candles (engulfing, pin bar) are defined on traded prices, so read them on normal candles. |
Are Heikin Ashi candles better?
They are another way of drawing the same prices. Normal candles keep the traded open, high, low and close, which is what the candlestick patterns are written for. Heikin-Ashi candles trade that detail for a smoother view of direction. Both work on any period and any asset on the platform; which one reads better is a matter of the rule you trade, and the way to find out is to count the results of your rule on both, on the Practice balance.
Related guides
- Chart types on IQ Option and Japanese candlesticks on IQ Option
- Weis Wave Volume on IQ Option, with the Heikin-Ashi finding
- Using the Stochastic at IQ Option and time frames on IQ Option
- All indicator guides and all strategy guides
Frequently Asked Questions
Q: How are Heikin Ashi candles different from traditional Japanese candlesticks?
A: A Heikin-Ashi candle is calculated from the real candle and the previous Heikin-Ashi candle: its close is the average of the four real prices and its open is the middle of the previous body. The result is smoother, with longer runs of one colour.
Q: Can Heikin Ashi candles be used with other technical indicators?
A: Yes, the platform draws indicators on a Heikin-Ashi chart. Some indicators are calculated from the Heikin-Ashi values, so their signals can differ from those on a normal chart.
Q: What colours do Heikin Ashi candles have on IQ Option?
A: By default the rising candles are blue and the falling candles red, and you can change both in Display Settings of the chart type menu.
Q: What are the disadvantages of Heikin Ashi candles compared to traditional candlesticks?
A: Their open, high, low and close are calculated, not traded, and the smoothing lags. The patterns written for real candles should be read on normal candles.
Q: How can traders learn to use Heikin Ashi candles effectively?
A: Write a rule down with exact numbers, count its results on a Practice balance over a few dozen signals or more, and compare it with the same rule on normal candles.