
Last updated: 8 October 2026. Every screenshot below was recorded on 8 October 2026 on an IQ Option Practice account registered in Brazil, on EUR/USD 5-minute candles; the Chart analysis picture in Step 1 was recorded on 5 October 2026. We placed no real-money trade. The settings come from the platform’s dialog and the calculation from the published source code of the platform’s built-in indicators (Quadcode’s script library). The tested box shows what the three readings did on EUR/USD 5-minute candles recorded between 29 September and 5 October 2026; it says nothing about what will happen next.
Aroon measures how long ago the price made its highest high and its lowest low within the last n candles. Aroon Up is 100 when the highest high of the period is on the current candle and falls by 100 ÷ n for every candle since; Aroon Down does the same for the lowest low. On IQ Option the two lines are drawn together in a panel under the price chart, and the Aroon Oscillator, in another panel, is Up minus Down. The platform opens at a period of 14, while 25 is the usual setting. Both give a signal when the two lines cross; at period 25 that happened 51 times in 1,286 candles of 5-minute EUR/USD.
Quick answer
- What it plots: two lines from 0 to 100 in a panel under the price chart: Aroon Up and Aroon Down. The Aroon Oscillator is a separate indicator with one line from −100 to +100.
- Formula: Up = (n − candles since the highest high of the last n) ÷ n × 100; Down = the same for the lowest low; Oscillator = Up − Down.
- Settings on the platform: one: Period, 14 candles by default, for both indicators. The usual setting is a period of 25.
- Reading: Up above Down means new highs are more recent than new lows; both lines near the same level means a range.
- Where: Aroon is in the Trend list and the Aroon Oscillator in the Momentum list of the Chart analysis panel; search for Aroon.
- Tested: on EUR/USD 5-minute candles of 29 September to 5 October 2026 the crossover gave 51 signals at period 25 (24 won and 26 lost at a five-minute expiry, 48.0%) and 99 at the default period of 14 (53 won, 43 lost, 55.2%); the 70/30 edges rule won 28 of 56 (50.0%) and the ±90 oscillator rule 20 of 48 (41.7%); break-even is 54.1% at an 85% payout. Five readings, a short replay, no promise.
How do you add Aroon on IQ Option?
Set the chart
Choose the asset, the chart type and the candle size first: the indicator is calculated from the candles on the chart. The examples in this guide use 5-minute candles on EUR/USD. These steps use the web traderoom on a Practice balance, and the numbers in each screenshot match the numbers in the text. If you do not have an account yet, see how to register.
Step 1: Open Chart analysis
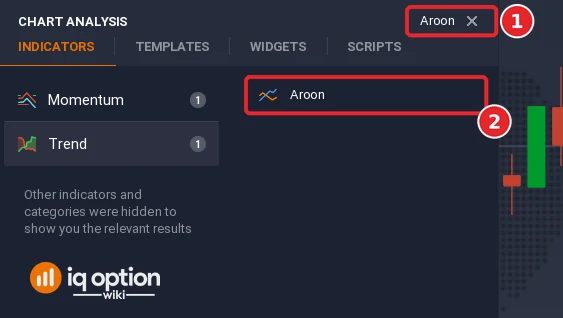
Click the indicators button (1), the wave icon in the chart toolbar at the bottom left of the chart. The Chart analysis panel opens with the tabs Indicators, Templates, Widgets and Scripts. Stay on Indicators.

Step 2: Find Aroon
Type “Aroon” in the Search for indicators box (1), or open the Trend list, and click Aroon (2).
Step 3: Check the settings
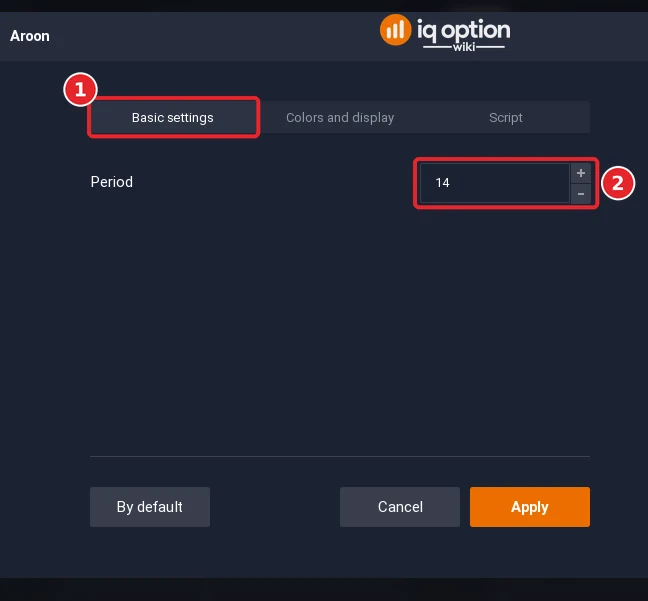
The dialog has three tabs: Basic settings (1), Colors and display and Script. The Period (2) opens at 14, the number of candles in which the highest high and the lowest low are searched.
Step 4: Check the colours and click Apply
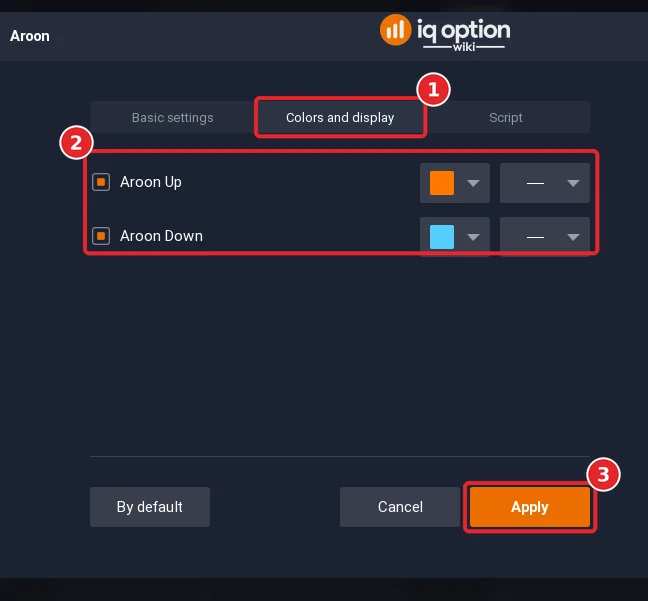
Open the Colors and display tab (1). The tab has two rows, Aroon Up (orange by default) and Aroon Down (light blue), each with a checkbox that shows or hides the line, a colour box and a line-style box. Both are in box 2. Click Apply (3).
Step 5: Read the panel
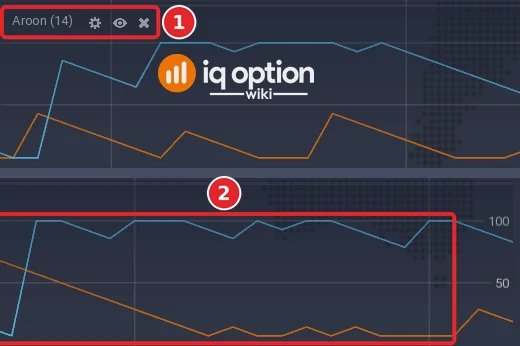
Aroon opens in a panel under the price chart. Its title is at the top left of the panel (1); the two lines (2) are Aroon Up in orange and Aroon Down in light blue, and both move between 0 and 100.
How are Aroon and the Aroon Oscillator calculated?
For a period n, the Quadcode source asks on every candle how many candles ago the highest high of the last n candles was, and how many candles ago the lowest low was. Aroon Up = (n − candles since the highest high) ÷ n × 100, so it is 100 when the highest high is the current candle and 0 when it was n candles ago. Aroon Down = (n − candles since the lowest low) ÷ n × 100. The Aroon Oscillator = Up − Down, which runs from −100 to +100: +100 means Up is 100 and Down is 0, and −100 the reverse.
| Part | Default | What it does |
|---|---|---|
| Period | 14 | Number of candles in which the highest high and the lowest low are searched |
Both indicators were developed by Tushar Chande; the Aroon belongs to the Trend group and the Aroon Oscillator to the Momentum group, and a period of 25 is the one Chande suggests, also as the oscillator’s default, but the platform opens both at 14. A longer period gives a smoother line that lags more; 25 or less is used by short-term traders and 75 by position traders.
How do you read Aroon?
There are three usual readings of the two lines. Crossover: when Aroon Up crosses above Aroon Down a new uptrend may be starting; when Aroon Down crosses above Aroon Up a new downtrend may be starting. Edges: a new uptrend is signalled when Aroon Up is between 70 and 100 while Aroon Down stays below 30 for some time, and a downtrend when Aroon Down is between 70 and 100 and Aroon Up between 0 and 30. Parallel lines: when the two lines move side by side at about the same level, the market is ranging or consolidating.
The Aroon Oscillator gives the same information as one line. It is positive when Up is above Down, which means that new highs were made more recently than new lows, and negative in the reverse case. Signals are awaited at −90 and +90: an oscillator above +90 means Up is between 90 and 100 and Down between 0 and 10, a strong upward movement; below −90 is a strong downward movement. Do not expect to catch tops and bottoms with it.
What did it look like on 5-minute candles?
We replayed the library script on EUR/USD 5-minute candles recorded from the Practice traderoom: 1,093 candles from 29 September 2026 (01:55 UTC) to 2 October (20:55 UTC) and 241 from 4 October (21:00 UTC) to 5 October (17:00 UTC). At period 25 the lines have a value from the 25th candle of each stretch, 1,286 values in all; at the default period of 14, 1,308.
- Crossovers of Up and Down: 51 at period 25 (one every 25 candles) and 99 at period 14 (one every 13).
- Extremes at period 25: Aroon Up was exactly 100 on 121 candles (9%) and Aroon Down on 186 (14%): the price was at the highest or lowest level of the last 25 candles. The oscillator was above +90 on 37 candles and below −90 on 84.
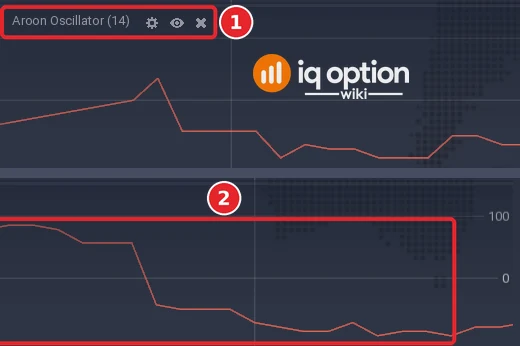
The Step 5 picture covers 05:27 to 11:16 on the platform clock and shows Aroon at the default period of 14. Aroon Up crossed above Aroon Down at 05:45 and 07:30, and Aroon Down crossed above Aroon Up at 05:50 and 09:40; Aroon Up stood at 100 on 11 candles and Aroon Down on 18. In a second window of our recording, 10:20 to 16:09 (not pictured), the lines crossed five times (11:35, 12:05, 13:30, 13:40 and 15:05). The Aroon Oscillator, in the picture below, is the same information on one line: positive when Up is above Down and negative in the reverse case. (The platform draws the value of a candle at the time the candle closes: the candle that opened at 07:25 sits at the 07:30 mark.)
The three readings, tested
We wrote the three readings as rules on closed candles, with the option opened at the close of the signal candle. No expiry is given, so the box shows the candle’s own length (five minutes) and, for the crossover, fifteen minutes.
- Crossover: Higher on the candle where Aroon Up crosses above Aroon Down; Lower on the candle where Aroon Down crosses above Aroon Up. Run at period 25 and at the default 14.
- Edges (period 25): Higher on the first candle with Aroon Up above 70 and Aroon Down below 30; Lower on the first with Aroon Down above 70 and Aroon Up below 30.
- ±90 (period 25): Higher on the candle where the oscillator rises above +90; Lower where it falls below −90.
Tested on IQ Option: five readings of the Aroon rules, EUR/USD candles of 29 September to 5 October 2026
| Asset and candles | EUR/USD binary (regular, not OTC): 1,334 five-minute candles (2026-09-29 01:55 to 2026-10-02 20:55 UTC and 2026-10-04 21:00 to 2026-10-05 17:00 UTC). The candles were recorded from IQ Option’s Practice traderoom. The replay places no orders; it only scores the rule on those closed candles, at an 85% payout. |
|---|---|
| Rule tested | Three usual readings as rules on closed candles; the option opens at the close of the signal candle. Crossover: Higher on the candle where Aroon Up crosses above Aroon Down, Lower where Aroon Down crosses above Aroon Up, at period 25 (the usual one) and at the default 14. Edges (period 25): Higher on the first candle with Aroon Up above 70 and Aroon Down below 30, Lower on the mirror. ±90 (period 25): Higher where the Aroon Oscillator rises above +90, Lower where it falls below −90. Expiry one candle (five minutes), and three candles for the period-25 crossover. |
| Signals | Aroon(25) Up crosses Down, 5-minute, 1 candle: 51 signals (26 Higher, 25 Lower) Aroon(25) cross, 5-minute, 3 candles: 50 signals (26 Higher, 24 Lower) Aroon(14) default cross, 5-minute, 1 candle: 99 signals (49 Higher, 50 Lower) Aroon(25) edges (Up above 70, Down below 30), 5-minute, 1 candle: 57 signals (18 Higher, 39 Lower) Aroon(25) oscillator beyond +/-90, 5-minute, 1 candle: 48 signals (14 Higher, 34 Lower) |
| Outcomes | Aroon(25) Up crosses Down, 5-minute, 1 candle: 24 won, 26 lost, 1 tied; 48.0% of the 50 decided trades won; net −$0.11 per $1 staked at 85% (−$0.08 at 91%) Aroon(25) cross, 5-minute, 3 candles: 24 won, 25 lost, 1 tied; 49.0% of the 49 decided trades won; net −$0.09 per $1 staked at 85% (−$0.06 at 91%) Aroon(14) default cross, 5-minute, 1 candle: 53 won, 43 lost, 3 tied; 55.2% of the 96 decided trades won; net +$0.02 per $1 staked at 85% (+$0.05 at 91%) Aroon(25) edges (Up above 70, Down below 30), 5-minute, 1 candle: 28 won, 28 lost, 1 tied; 50.0% of the 56 decided trades won; net −$0.07 per $1 staked at 85% (−$0.04 at 91%) Aroon(25) oscillator beyond +/-90, 5-minute, 1 candle: 20 won, 28 lost, 0 tied; 41.7% of the 48 decided trades won; net −$0.23 per $1 staked at 85% (−$0.20 at 91%) |
| Break-even | At an 85% payout a trade needs to win more than 54.1% of its decided trades to break even (1 ÷ 1.85); at 91%, more than 52.4% (1 ÷ 1.91). |
A replay is only a look back at candles recorded on the dates above: it placed no real orders, covers about four and a half days of one pair, and counts overlapping trades as if they were independent. A short test proves nothing about the future, and no profit and no win rate is promised here. IQ Option’s own blog on backtesting says that most strategies need dozens, and often hundreds, of trades before a result means anything.
At period 25 the crossover was close to a coin flip at both expiries; at the default period of 14 it gave twice as many signals and won 53 of 96 decided trades (55.2%), a rate that the interval of 45% to 65% does not separate from the break-even rate. The edges rule was even, and the ±90 rule won less than half of its trades. Nothing here is a reason to trade a rule.
Pros and Cons of the Aroon
| Pros | Cons |
|---|---|
| Two simple lines that show how recent the highest high and the lowest low are. | It lags: a new high or low has to happen before a line moves. |
| Bounded between 0 and 100, so strong and weak moves are easy to see. | In a range the lines cross often and give false signals. |
| The oscillator puts the same information on one line around zero. | The platform opens at 14, not at the usual 25; the periods give different numbers of signals. |
Common mistakes
- Assuming the dialog opens at 25. The platform opens at 14; type 25 to use the usual setting.
- Reading every crossover as a new trend. At period 14 the lines crossed 99 times in 1,308 candles.
- Expecting the oscillator to find tops and bottoms. It is not made for that.
- Looking for the oscillator in the Trend list. It is a separate indicator, in the Momentum list.
Related guides
- Vertical Horizontal Filter and Trend Intensity Index
- Identifying a trend and trading a ranging market
- McGinley Dynamic and leading and lagging indicators
- All indicator guides and all strategy guides
Frequently Asked Questions
Q: What is the Aroon indicator?
A: A pair of lines, Aroon Up and Aroon Down, from 0 to 100, that measure how long ago the highest high and the lowest low of the last n candles were made. It is credited to Tushar Chande.
Q: What settings does Aroon have on IQ Option?
A: One: Period, 14 candles by default, for Aroon and for the Aroon Oscillator. The colours and line styles are on the Colors and display tab.
Q: What is the difference between Aroon and the Aroon Oscillator?
A: The Aroon Oscillator is Aroon Up minus Aroon Down: one line from −100 to +100 around zero, in its own indicator.
Q: Which period should I use?
A: The platform opens at 14, and 25 is usual for short-term trading and 75 for position trading. A longer period gives fewer signals and more lag.
Q: What does a crossover mean?
A: When Aroon Up crosses above Aroon Down, a high is more recent than the last low; it is read as a possible new uptrend. The results of the crossover rule are in the tested box.
Q: Can I use Aroon on binary options?
A: The platform draws it on any chart. Whether a rule works is something to test on the Practice balance with the expiry you plan to use.

