
Last updated: 8 October 2026. Every screenshot below was recorded on 8 October 2026 on an IQ Option Practice account registered in Brazil, on EUR/USD 5-minute candles; the Chart analysis picture in Step 1 was recorded on 5 October 2026. We placed no real-money trade. The settings come from the platform’s dialog and the calculation from the published source code of the platform’s built-in indicators (Quadcode’s script library). The tested box shows what two readings from IQ Option’s blog, a cross of the oscillator’s own 10-candle average and a cross of the zero line, did on EUR/USD 5-minute candles recorded between 29 September and 5 October 2026; it says nothing about what will happen next.
The Chande Forecast Oscillator (CFO) measures how far the close is from the value that a straight line fitted to the last 14 closes would have given at this candle, as a fraction of the close. On IQ Option it opens in its own panel under the price chart as one line around a zero line: above zero the close is above the fitted line, below zero below it. The oscillator is usually described as ranging between −1 and +1 with overbought and oversold at ±0.5; on the platform the values are tiny fractions, between −0.0012 and +0.0016 on our candles, so those levels are never reached. On 5-minute EUR/USD candles the cross of the CFO and its 10-candle average gave 285 signals and won 45.0% of its decided trades at a five-minute expiry and 51.2% at fifteen minutes.
Video tutorial
Quick answer
- What it plots: one line in a panel under the price chart, around a zero line.
- Formula: CFO = (close − linear regression forecast of the last n closes) ÷ close. The default n is 14.
- Settings on the platform: the Period (14) and the Source (close).
- Reading: above zero the close is above its regression line (the price can be expected to go up while the line is rising); the blog buys when the CFO rises above its 10-candle average and sells when it falls below.
- Where: the Momentum list of the Chart analysis panel; search for Chande Forecast.
- Tested: the cross of the CFO and its 10-candle average gave 285 signals and won 45.0% of the decided trades with a 5-minute trade and 51.2% with a 15-minute trade; the cross of the zero line gave 303 signals and won 48.7% and 50.3%. Break-even is 54.1% at an 85% payout, and a few days of one pair prove nothing.
How do you add the Chande Forecast Oscillator on IQ Option?
Set the chart
Choose the asset, the chart type and the candle size first: the indicator is calculated from the candles on the chart. The examples in this guide use 5-minute candles on EUR/USD. These steps use the web traderoom on a Practice balance, and the numbers in each screenshot match the numbers in the text. If you do not have an account yet, see how to register.
Step 1: Open Chart analysis
Click the indicators button (1), the wave icon in the chart toolbar at the bottom left of the chart. The Chart analysis panel opens with the tabs Indicators, Templates, Widgets and Scripts. Stay on Indicators.

Step 2: Find Chande Forecast Oscillator
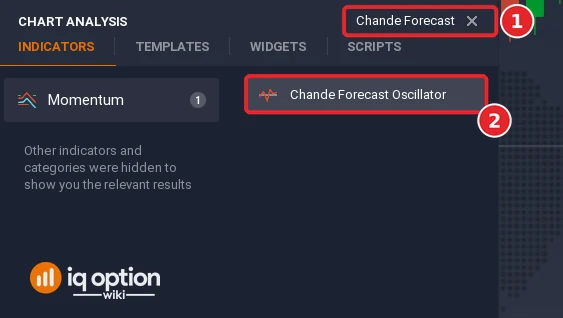
Type “Chande Forecast” in the Search for indicators box (1), or open the Momentum list, and click Chande Forecast Oscillator (2).
Step 3: Check the settings
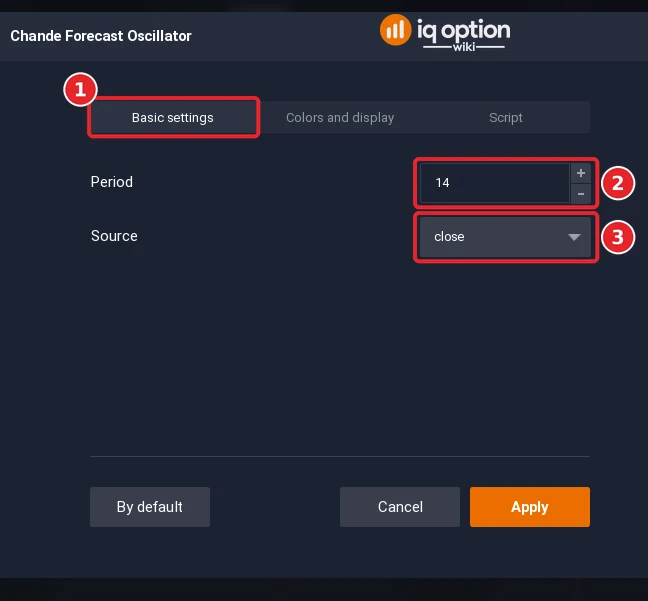
The dialog has the tabs Basic settings (1), Colors and display and Script. The Period (2) opens at 14, the number of closes that the straight line is fitted to. The Source (3) opens at close, the price used.
Step 4: Check the colours and click Apply
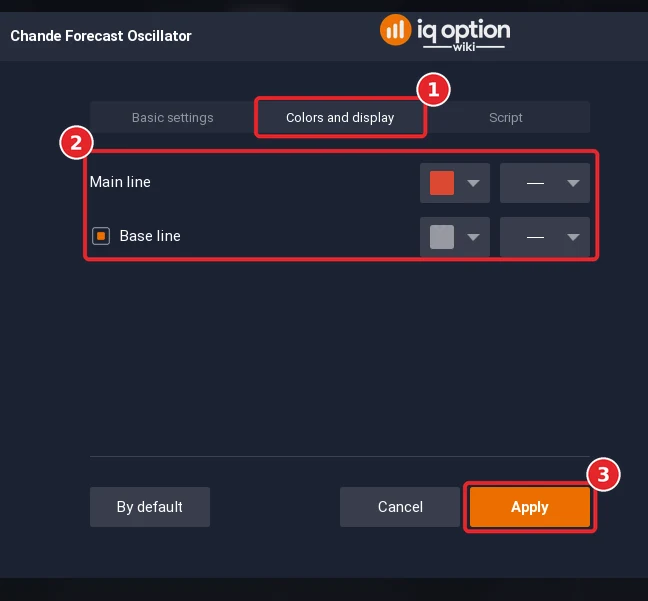
Open the Colors and display tab (1). The tab has two rows: Main line, red by default, and Base line, the zero line, which has a checkbox; each has a colour box and a line-style box. Click Apply (3).
Step 5: Read the panel
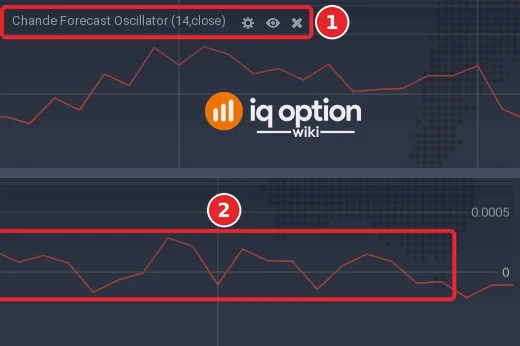
The line is drawn in its own panel under the price chart. The title bar of the panel reads Chande Forecast Oscillator (14,close), the period and the source, followed by the settings, eye and close icons (1). The values are tiny fractions of the price, so the scale at the right edge shows only a few labels, 0.0005 and 0 in the picture, and a grey line marks 0. The CFO is the red line (2).
How is the Chande Forecast Oscillator calculated?
For each candle the Quadcode source fits a straight line by least squares through the last n values of the source (14 closes by default) and reads the value of that line at the latest candle, the forecast. The CFO is the close minus that forecast, divided by the close: (close − forecast) ÷ close. It is zero when the close is on the line, positive when it is above and negative when it is below.
| Part | Default | What it does |
|---|---|---|
| Period | 14 | Number of closes the line is fitted to |
| Source | close | The price used |
IQ Option’s blog gives the formula with a factor of 100 (a percentage); the platform’s source has no factor, so the values are fractions of the price: 0.001 is 0.1%. The blog says the CFO ranges between −1 and +1 and treats ±0.5 as the overbought and oversold levels; with fractions that small the line never gets near them. The blog credits the oscillator to Tushar Chande, says it was made to tell whether the price can be expected to go up or down, and describes it as measuring momentum without smoothing, so that it reaches its extremes often.
How do you read the Chande Forecast Oscillator?
IQ Option’s blog gives four uses. Direction: above zero and moving up, the price can be expected to go up; below zero and moving down, down. Moving average: add a simple moving average with a period of 10 to the oscillator; when the CFO rises above it the signal is bullish, and when it falls beneath it the signal is bearish. Confirmation: a cross of the zero line confirms a signal from a crossing of moving averages. Divergences: the price rises while the CFO falls (negative divergence) or the price falls while the CFO rises (positive divergence). The blog warns that false signals are possible, that the time frame has a great influence, that signals from absolute levels are less credible than patterns, and that overbought and oversold readings fail in a strong trend.
What did it look like on 5-minute candles?
We replayed the library script on EUR/USD 5-minute candles recorded from the Practice traderoom: 1,093 candles from 29 September 2026 (01:55 UTC) to 2 October (20:55 UTC) and 241 from 4 October (21:00 UTC) to 5 October (17:00 UTC). With the default period the line has a value from the 14th candle of each stretch, 1,308 values in all.
- Range: from −0.0012 to +0.0016, that is −0.12% to +0.16% of the price.
- Zero line: above zero on 655 candles (50%); crossed 304 times, about every 4 candles.
Two stills of the platform, window A (the Step 5 picture shows its two ends) and window B (not pictured), agree with the replay: read off the chart at 130 points of the two windows, the line differed from the replay of the script by 0.00001 on average and by 0.00005 at most, which is 0.001% of the price. In window A, 29 September from 06:14 to 11:58 on the platform clock, the line goes from −0.00053 at 06:15 to a first peak of 0.0004 at 07:05, falls below zero at 08:05, makes its high of 0.00043 at 09:05, its low of −0.00048 at 09:40 and ends at −0.00011 at 11:55; it crossed zero 12 times in the window. In window B, from 11:27 to 17:11, it starts at 0.00015 at 11:30, makes its high of 0.00095 at 15:05 and its low of −0.00055 at 15:50 and ends at 0.00003 at 17:10; it crossed zero 12 times as well. (A point is drawn at the close of its candle: the value of the candle that opened at 09:00 sits at the 09:05 mark.)
The two readings, tested
We wrote two of the readings as exact rules on closed candles, with the option opened at the close of the signal candle. Moving average: Higher on the candle where the CFO rises above its 10-candle simple moving average, Lower on the candle where it falls below it. Zero line: Higher on the candle where the CFO rises above zero, Lower where it falls below. The guides give no expiry, so the box shows five minutes and fifteen minutes. Divergences and the trend-strength reading are not tested.
Tested on IQ Option: the Chande Forecast Oscillator, EUR/USD 5-minute candles of 29 September to 5 October 2026
| Asset and candles | EUR/USD binary (regular, not OTC): 1,334 five-minute candles (2026-09-29 01:55 to 2026-10-02 20:55 UTC and 2026-10-04 21:00 to 2026-10-05 17:00 UTC). The candles were recorded from IQ Option’s Practice traderoom. The replay places no orders; it only scores the rule on those closed candles, at an 85% payout. |
|---|---|
| Rule tested | Two readings from IQ Option’s blog on closed candles, the option opening at the close of the signal candle. Moving average: Higher on the candle where the CFO rises above its 10-candle simple moving average, Lower where it falls below it. Zero line: Higher on the candle where the CFO rises above zero, Lower where it falls below. The guides give no expiry, so the box shows 5 and 15 minutes on 5-minute candles. |
| Signals | CFO crosses its 10-candle average, period 14, 5-minute, 1 candle: 285 signals (143 Higher, 142 Lower) CFO crosses zero, period 14, 5-minute, 1 candle: 303 signals (152 Higher, 151 Lower) CFO crosses its average, 5-minute, 3 candles: 285 signals (143 Higher, 142 Lower) CFO crosses zero, 5-minute, 3 candles: 302 signals (151 Higher, 151 Lower) |
| Outcomes | CFO crosses its 10-candle average, period 14, 5-minute, 1 candle: 126 won, 154 lost, 5 tied; 45.0% of the 280 decided trades won; net −$0.17 per $1 staked at 85% (−$0.14 at 91%) CFO crosses zero, period 14, 5-minute, 1 candle: 145 won, 153 lost, 5 tied; 48.7% of the 298 decided trades won; net −$0.10 per $1 staked at 85% (−$0.07 at 91%) CFO crosses its average, 5-minute, 3 candles: 145 won, 138 lost, 2 tied; 51.2% of the 283 decided trades won; net −$0.05 per $1 staked at 85% (−$0.02 at 91%) CFO crosses zero, 5-minute, 3 candles: 152 won, 150 lost, 0 tied; 50.3% of the 302 decided trades won; net −$0.07 per $1 staked at 85% (−$0.04 at 91%) |
| Break-even | At an 85% payout a trade needs to win more than 54.1% of its decided trades to break even (1 ÷ 1.85); at 91%, more than 52.4% (1 ÷ 1.91). |
A replay is only a look back at candles recorded on the dates above: it placed no real orders, covers about four and a half days of one pair, and counts overlapping trades as if they were independent. A short test proves nothing about the future, and no profit and no win rate is promised here. IQ Option’s own blog on backtesting says that most strategies need dozens, and often hundreds, of trades before a result means anything.
With a trade of one candle (5 minutes) the average rule gave 285 signals and won 126 of the 280 decided trades (45.0%), and the zero-line rule gave 303 signals and won 145 of 298 (48.7%). With a trade of three candles (15 minutes) the figures were 51.2% (145 of 283) and 50.3% (152 of 302). Break-even is 54.1% at an 85% payout. All four results are below it, but the 95% intervals of the two 15-minute results (45% to 57% and 45% to 56%) include it, so only the two 5-minute results (39% to 51% and 43% to 54%) are clearly under it.
Pros and Cons of the Chande Forecast Oscillator
| Pros | Cons |
|---|---|
| Compares the close with a fitted line, so it needs no level: zero is the whole reference. | The values are tiny fractions, and the usual ±0.5 levels do not exist on the platform. |
| Two readings from one line: the zero line and the average of the CFO itself. | Neither reached the break-even rate of 54.1% in our replay: 45.0% and 48.7% at five minutes, 51.2% and 50.3% at fifteen minutes. |
| Simple formula, one setting. | The zero line was crossed every 4 candles and won less than half of its five-minute trades (48.7%). |
Common mistakes
- Waiting for ±0.5. The CFO never gets near it on the platform: its range was ±0.002.
- Believing the blog’s “whether the price will go up or down”. The oscillator describes where the close is against a fitted line; it has no information about the next candle.
- Entering on every zero cross. It crossed about every 4 candles in our recording.
- Adding the 10-candle average without checking the platform scale. The average of the CFO is as small as the CFO itself.
Related guides
- Linear Regression Forecast and Linear Regression Slope
- Disparity Index and classic and hidden divergences
- Bollinger Bands on IQ Option and leading and lagging indicators
- All indicator guides and all strategy guides
Frequently Asked Questions
Q: What is the Chande Forecast Oscillator?
A: The difference between the close and the value of a straight line fitted to the last n closes, divided by the close. It is positive when the close is above the line.
Q: What settings does the Chande Forecast Oscillator have on IQ Option?
A: Two: the Period (14) and the Source (close); the colours of the line and of the base line can be changed on the Colors and display tab.
Q: Does it forecast the price?
A: No. The name says forecast, but the oscillator compares the close with a line fitted to past closes.
Q: What are the overbought and oversold levels?
A: The usual levels are ±0.5. On the platform the values are fractions between about −0.001 and +0.002 on 5-minute EUR/USD, so those levels are never reached.
Q: How do I use the 10-candle average?
A: IQ Option’s blog says to add a simple moving average with a period of 10 to the oscillator: bullish when the CFO is above it and bearish when it is below. The results are in the tested box.
Q: Can I use the Chande Forecast Oscillator on binary options?
A: The platform draws it on any chart. Whether a rule works is something to test on the Practice balance with the expiry you plan to use.

