Last updated: 8 October 2026. Every screenshot below was captured on 5 and 8 October 2026 on an IQ Option Practice account registered in Brazil; the charts show EUR/USD 5-minute candles of 29 September 2026; the Chart analysis picture in Step 1 was recorded on 5 October 2026. We placed no real-money trade. The settings come from the platform’s dialog. The tested box shows what the SMA 20 pullback rule did on EUR/USD candles recorded between 29 September and 5 October 2026; it says nothing about what will happen next.
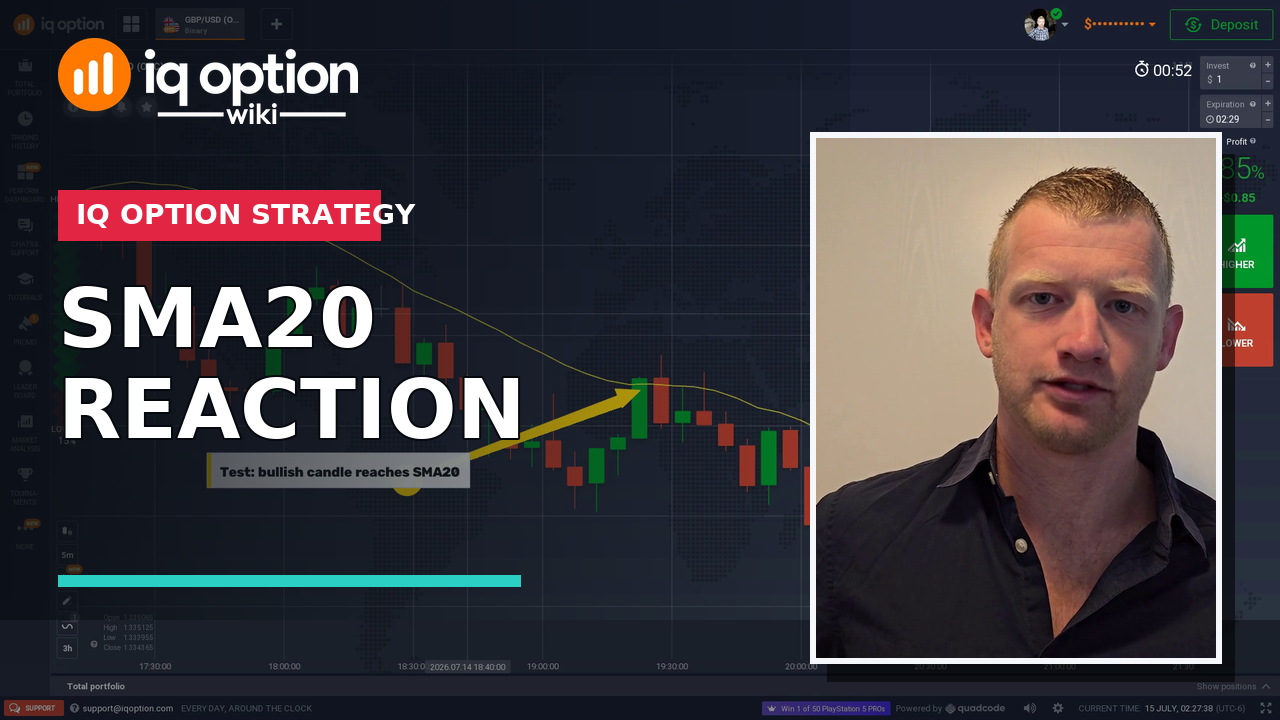
The SMA 20 is the simple moving average of the last 20 closes, drawn as one line on the price chart. The pullback rule looks for the moments when the line touches or cuts a candle that goes against the trend: in a downtrend, with the line above the candles, a bullish candle is cut by the line and a bearish candle follows and closes below it, so the trend is expected to go on down; the mirror holds in an uptrend. It uses 5-minute candles on EUR/USD, enters after the second candle has closed, and holds each trade for 5 minutes. On 5-minute candles recorded between 29 September and 5 October 2026 the rule gave 62 signals and the 5-minute trades won 27 and lost 35, 43.5% of the decided trades, below the break-even rate of 54.1% at an 85% payout.
Video tutorial
Quick answer
- What it plots: one line on the price chart, the average of the last 20 closes.
- Setup: Moving Average from Chart analysis, Type SMA (the Simple type), Period 20; 5-minute candles.
- Lower: the SMA is above the candles; a bullish candle is cut by the line, then a bearish candle closes below it; enter at the close of the bearish candle.
- Higher: the SMA is below the candles; a bearish candle is cut by the line, then a bullish candle closes above it; enter at the close of the bullish candle.
- Expiry: 5 minutes.
- Tested: 5-minute candles, 62 signals, 43.5% of the decided trades won; 1-minute candles, 89 signals, 53.9%. Break-even is 54.1% at an 85% payout, and a few days of one pair prove nothing.
How do you set up the SMA 20 on IQ Option?
Set the chart
Choose the asset, the chart type and the candle size first: the indicator is calculated from the candles on the chart. The examples in this guide use 5-minute candles on EUR/USD. These steps use the web traderoom on a Practice balance, and the numbers in each screenshot match the numbers in the text. If you do not have an account yet, see how to register.
Step 1: Open Chart analysis
Click the indicators button (1), the wave icon in the chart toolbar at the bottom left of the chart. The Chart analysis panel opens with the tabs Indicators, Templates, Widgets and Scripts. Stay on Indicators.

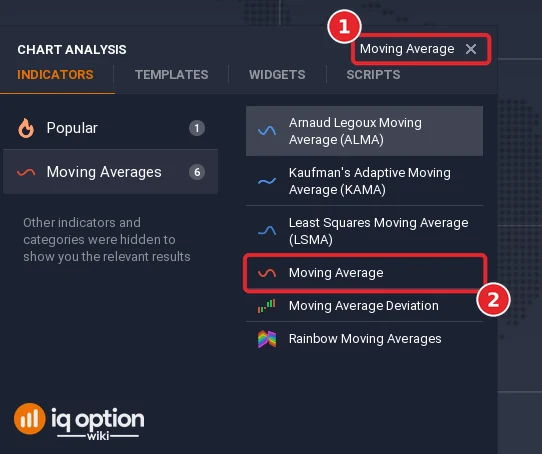
Step 2: Find the Moving Average
Type “Moving Average” in the Search for indicators box (1) and click Moving Average (2).
Step 3: Type 20 and keep the type Simple
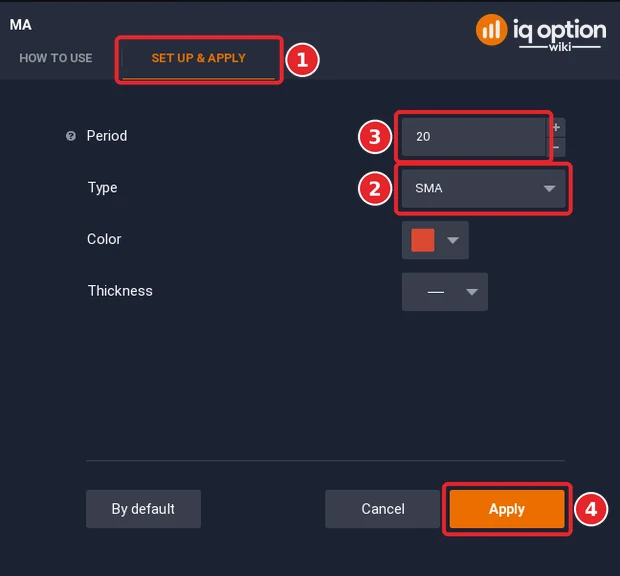
In the dialog open the Set up & apply tab (1), keep the Type list on SMA (2), the simple average, which is the default, type 20 in Period (3) and click Apply (4).
Step 4: Use 5-minute candles
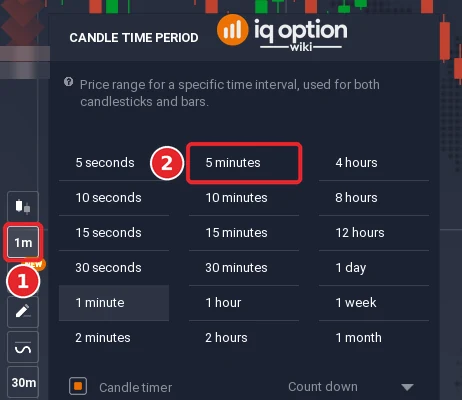
Click the candle time period button (1) at the bottom left of the chart and choose 5 minutes (2). The rule uses a Japanese candlestick chart with 5-minute candles on EUR/USD.
Step 5: Read the line
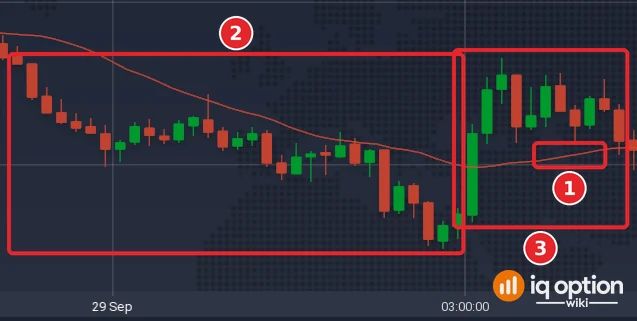
The SMA 20 appears as one line over the candles (1). The rule reads candles below the line as a downward movement and candles above it as an upward one. In the picture, which shows 29 September 2026, the candles closed under the line from 00:30 to 02:55 (2) and above it from 03:00 to 03:50 (3); a candle is named by the time it opens, and the times are the traderoom clock, UTC minus three hours.
How is the SMA 20 calculated?
For example, take the closing prices of the last 20 candles: 12, 15, 13, 19, 12, 13, 12, 11, 13, 15, 12, 13, 12, 11, 13, 15, 11, 13, 15, 12. Their sum is 262 and the average, the SMA 20, is 13.1. When a new candle closes at 18, the oldest close, 12, drops out and the sum becomes 268, so the new value is 13.4, a rise. The platform does this for every candle and joins the values into a line. On an intraday chart the 20 counts candles, not days.
The average lags the price, because each value is built from the last 20 closes.
What are the entry rules?
The rule wants the SMA 20 to touch or cut a candle that goes against the trend, followed by a candle in the direction of the trend. Written so that every condition is checked on closed candles:
| Part | Rule used in the replay |
|---|---|
| Lower signal | The candle before the bullish one closed under the SMA; the bullish candle is cut by the line (the SMA lies between its low and high); the next candle is bearish and closes under the SMA |
| Higher signal | The mirror of the Lower rule |
| Entry | At the close of the second candle |
| Expiry | 5 minutes on 5-minute candles |
Two signals of the recording, step by step
These are the first Lower signal and the first Higher signal of the rule on 5-minute candles, in time order, not picked by outcome. All times are the platform clock, which is UTC minus three hours; the date is 29 September 2026.
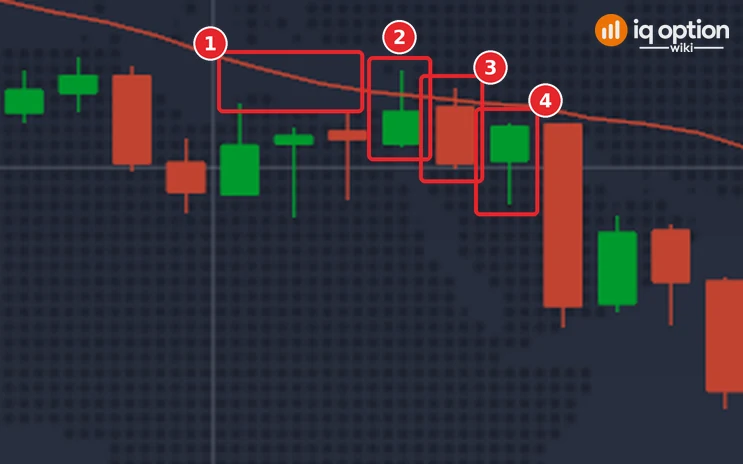
Lower signal, 02:20
The SMA 20 stood above the candles (1): the 02:10 candle closed at 1.136060, under the line (1.136156). The 02:15 candle was bullish, from 1.136050 to 1.136115, and the line (1.136146) cut it between its low, 1.136045, and its high, 1.136195 (2). The 02:20 candle was bearish: it opened at 1.136125 and closed at 1.136010, under the line (1.136134) (3). The rule opened a Lower option at that close, at 02:25, at 1.136010. Five minutes later, at the close of the 02:25 candle (4), the price was at 1.136085, 0.75 pip above the entry: the trade lost.
Higher signal, 20:50
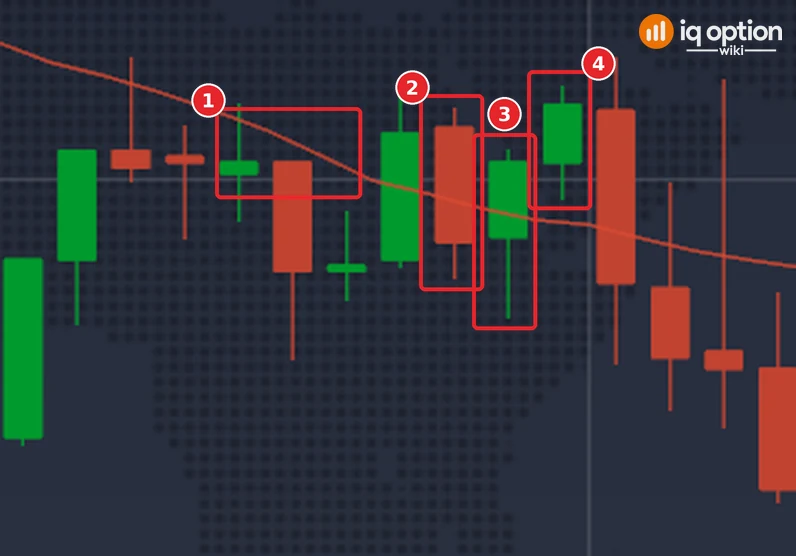
The SMA 20 stood below the candles (1): the 20:40 candle closed at 1.134040, above the line (1.133988). The 20:45 candle was bearish, from 1.134045 to 1.133945, and the line (1.133975) cut it between its low, 1.133915, and its high, 1.134060 (2). The 20:50 candle was bullish: it opened at 1.133950 and closed at 1.134015, above the line (1.133965) (3). The rule opened a Higher option at that close, at 20:55, at 1.134015. Five minutes later, at the close of the 20:55 candle (4), the price was at 1.134065, 0.5 pip above the entry: the trade won.
The SMA 20 pullback rule, tested
We scored the rule on the 1,334 five-minute candles of our recording with a 5-minute trade, and on the 1,505 one-minute candles with a 5-minute trade, entering at the close of the signal candle.
Tested on IQ Option: the SMA 20 pullback rule, EUR/USD candles of 29 September to 5 October 2026
| Asset and candles | EUR/USD binary (regular, not OTC): 1,334 five-minute candles (2026-09-29 01:55 to 2026-10-02 20:55 UTC and 2026-10-04 21:00 to 2026-10-05 17:00 UTC); 1,505 one-minute candles (2026-10-02 18:23 to 2026-10-02 20:59 UTC and 2026-10-04 21:01 to 2026-10-05 19:28 UTC). The candles were recorded from IQ Option’s Practice traderoom. The replay places no orders; it only scores the rule on those closed candles, at an 85% payout. |
|---|---|
| Rule tested | The pullback rule written on closed candles: Lower when the SMA 20 is above the candles (the candle two back closed under it), the candle before the signal is bullish and the line lies between its low and its high, and the signal candle is bearish and closes under the line; Higher is the mirror. The option opens at the close of the signal candle and lasts 5 minutes; the box shows the 5-minute candles it uses and, for comparison, 1-minute candles. |
| Signals | SMA 20 pullback, 5-minute candles, 5-minute trade: 62 signals (27 Higher, 35 Lower) same, 1-minute candles, 5-minute trade: 89 signals (39 Higher, 50 Lower) |
| Outcomes | SMA 20 pullback, 5-minute candles, 5-minute trade: 27 won, 35 lost, 0 tied; 43.5% of the 62 decided trades won; net −$0.19 per $1 staked at 85% (−$0.17 at 91%) same, 1-minute candles, 5-minute trade: 48 won, 41 lost, 0 tied; 53.9% of the 89 decided trades won; net −$0.00 per $1 staked at 85% (+$0.03 at 91%) |
| Break-even | At an 85% payout a trade needs to win about 54.1% of its decided trades to break even (1 ÷ 1.85); at 91%, about 52.4% (1 ÷ 1.91). |
A replay is only a look back at candles recorded on the dates above: it placed no real orders, covers about four and a half days of one pair, and counts overlapping trades as if they were independent. A short test proves nothing about the future, and no profit and no win rate is promised here. IQ Option’s own blog on backtesting says that most strategies need dozens, and often hundreds, of trades before a result means anything.
On 5-minute candles the rule gave 62 signals (27 Higher, 35 Lower): 27 won and 35 lost, 43.5% of the decided trades, with a 95% interval of 32% to 56%. Higher trades won 14 of 27 and Lower trades 13 of 35. On 1-minute candles it gave 89 signals and won 48 of 89, 53.9%, with an interval of 44% to 64%.
Pros and Cons of the SMA 20
| Pros | Cons |
|---|---|
| Simple: one line, a clear picture of the trend direction. | The line lags; the price has often moved before it turns. |
| The rule can be written out in full, with candle size, entry and expiry. | On 5-minute candles the rule won 43.5% in our recording. |
| Works with the platform’s own average. | On 1-minute candles the rule won 53.9% in our recording, a little under the 54.1% break-even rate at an 85% payout. |
Common mistakes
- Entering when the line touches the candle. The rule waits for the second candle to close.
- Trading against the line. The rule goes with the trend that the position of the line shows.
- Choosing EMA by mistake. The SMA 20 is the Simple type of the Moving Average.
- Assuming the rule wins. In our replay of 62 signals the 5-minute trades lost more than they won.
Related guides
- Trading with the EMA and Two SMA lines
- EMA 20 and EMA 50 and SMA with support and resistance
- Leading and lagging indicators
- All indicator guides and all strategy guides
Frequently Asked Questions
Q: What is the SMA 20?
A: The simple moving average of the last 20 closes. On the platform it is the Moving Average with Type SMA and Period 20.
Q: How is the SMA 20 calculated?
A: Add the last 20 closing prices and divide by 20. When a new candle closes, the oldest close drops out and the new close is added.
Q: What does this strategy trade with the SMA 20?
A: The moments when the line touches or cuts a candle against the trend, followed by a candle with the trend, on 5-minute candles with a 5-minute trade.
Q: How long should the trade last?
A: The rule holds each trade for 5 minutes. In our replay 5-minute trades on 5-minute candles won 43.5% of the decided trades.
Q: Does the strategy win?
A: Not on 5-minute candles in our recording: 27 won and 35 lost. On 1-minute candles it won 48 of 89, which is within the margin of error of the break-even rate.
Q: Can I use the EMA instead?
A: We tested only the SMA, so we cannot say how the rule would do with the EMA.