Last updated: 8 October 2026. Every screenshot below was recorded on 8 October 2026 on an IQ Option Practice account registered in Brazil, on EUR/USD 5-minute candles, and nothing was traded with real money. The screenshots show the drawing tool being chosen, drawn and read; they do not show a trade. This guide has no tested box: the Fibonacci tool is drawn by hand, where you anchor it is a human choice, and there is no mechanical rule to replay. Nothing here is a promise of profit.
Fibonacci levels on IQ Option come from a drawing tool, not an indicator: you pick it from the drawing tools button in the chart toolbar, anchor it on a swing low and a swing high, and the platform draws horizontal lines at set percentages of that swing. Traders watch those lines as areas where a pullback may pause or reverse. IQ Option’s own blog calls the levels zones rather than exact prices and says they are not an entry signal on their own.
Quick answer
- Where it is: the drawing tools button (a pencil icon) in the chart toolbar at the bottom left of the chart, then Fibonacci Lines, the last row of the Graphical tools list. It is a drawing tool, not an indicator.
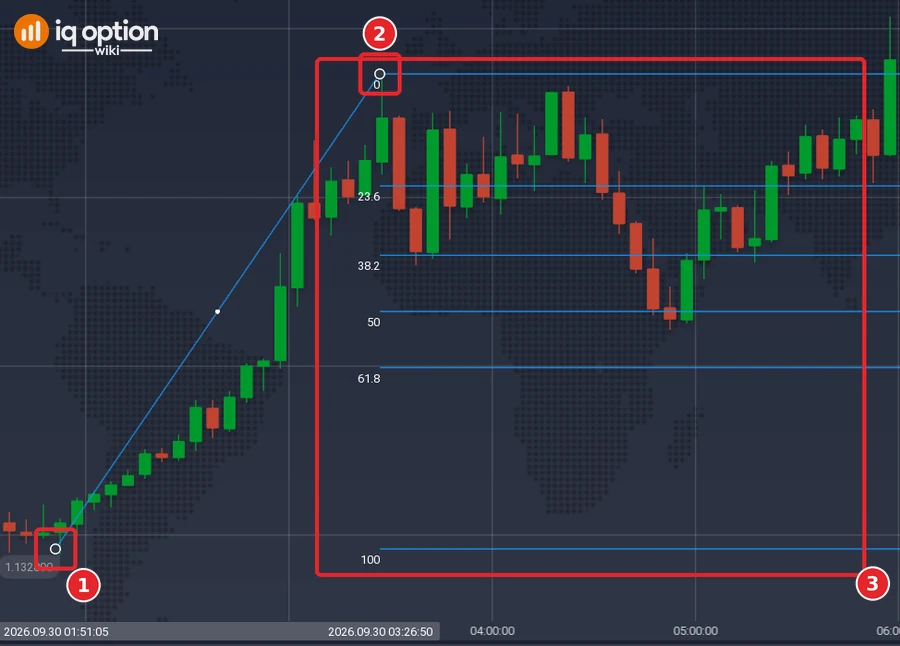
- How to draw it: in an uptrend, from the swing low to the swing high; in a downtrend, from the swing high to the swing low. Click the first point, move the cursor to the second and click again.
- Levels drawn: eight horizontal lines, labelled 0, 23.6, 38.2, 50, 61.8, 100, 161.8 and 261.8, as percentages of the swing between your two points.
- How to read it: each line marks how much of the swing a pullback has given back. IQ Option’s blog calls the levels zones, not exact prices.
- Limit: not an entry signal on its own. IQ Option’s blog says to wait for confirmation and notes that different traders pick different swings. No test is shown here.
Overview of Fibonacci Lines
Fibonacci lines are a set of horizontal lines that the platform draws once you have chosen two points on the chart. IQ Option’s blog says they correspond to Fibonacci ratios, that they are used to find possible support and resistance levels, and that the tool is named after the 13th-century Italian mathematician Fibonacci and his sequence. Another IQ Option article groups Fibonacci lines with the line tools, next to trend lines and horizontal lines, and not with the indicators. An indicator is calculated for every candle; this tool exists only where you draw it.
IQ Option’s blog gives the ratios as 23.6%, 38.2%, 50%, 61.8% and 100% in one article and as 23.6, 38.2, 50, 61.8 and 78.6 in another. On the platform the tool drew eight horizontal lines, labelled 0, 23.6, 38.2, 50, 61.8, 100, 161.8 and 261.8.
Each level is a share of the swing between your two points. Take a swing from a low of 1.1000 up to a high of 1.1100, a range of 0.0100 (made-up prices, to show the arithmetic). A pullback of 38.2% of that swing is a pullback to 1.1100 – 0.382 × 0.0100 = 1.10618; a pullback of 50% is 1.1050 and a pullback of 61.8% is 1.10382. Which end of the drawing carries the 0 matters for reading the labels: on the platform, the line at your first click is labelled 100 and the line at your second click 0.
How do you draw Fibonacci lines on IQ Option?
These steps use the web traderoom on a Practice balance. The numbers in each screenshot match the numbers in the text.
Step 1: Open the drawing tools
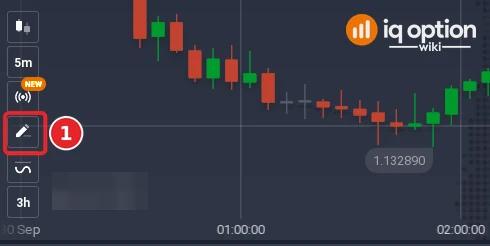
Click the drawing tools button (1), the pencil icon in the chart toolbar at the bottom left of the chart. It opens a list titled Graphical tools with five tools: Line, Trend Line, Horizontal Line, Vertical line and Fibonacci Lines, and the text “Additional tools for drawing and creating technical analysis elements such as trends and support and resistance lines.”
Step 2: Choose the Fibonacci tool
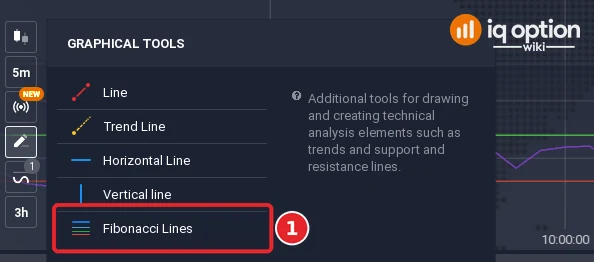
Click Fibonacci Lines (1), the last row of the list. IQ Option’s blog calls the tool “Fibonacci Lines” and says it is in the “Graphical tools” list; the platform’s list uses the same names.
Step 3: Find the swing
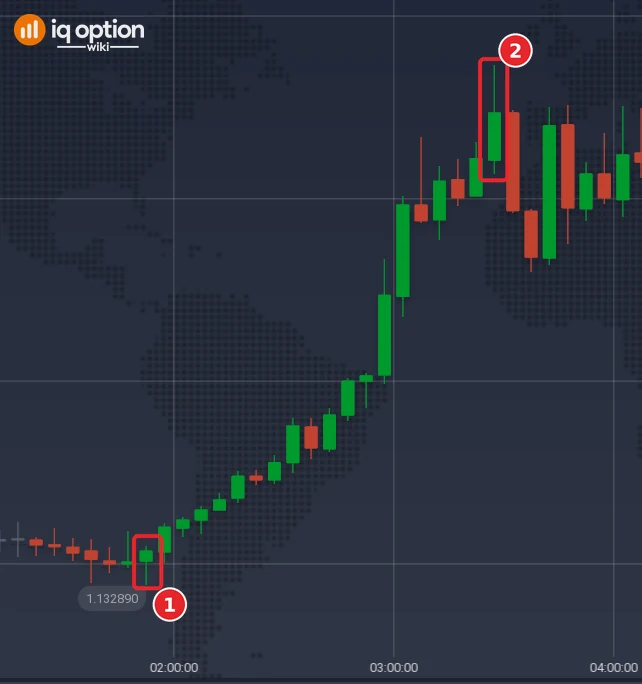
Before you draw, find the swing you want to measure: the most recent clear swing low and swing high. IQ Option’s blog says to use swings that “jump out at you from the chart” and warns against small, forced ones. In an uptrend the swing runs from a low (1) up to a high (2); in a downtrend it runs from a high down to a low. IQ Option’s blog also describes the Zig Zag indicator as a way to find the main swings.
Step 4: Draw it in an uptrend
Start at the swing low (1) and end at the swing high (2): click the swing low, move the cursor to the swing high and click again; the lines follow the cursor until the second click. The platform draws the level lines (3) from the second point to the right edge of the chart.
Step 5: Draw it in a downtrend
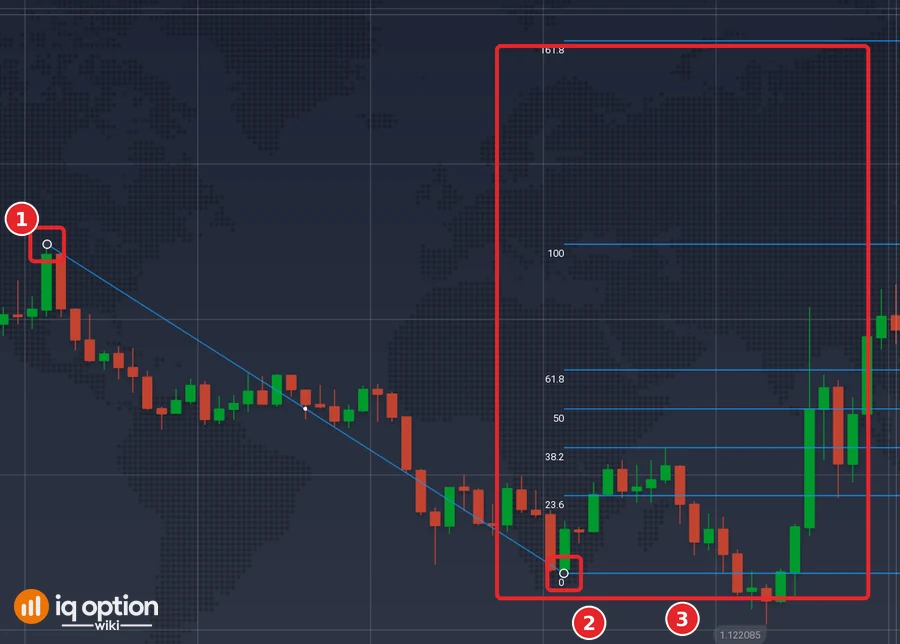
Do the reverse: start at the swing high (1) and end at the swing low (2), with the same movement as in Step 4. The level lines (3) run from the second point to the right edge of the chart.
Step 6: Read the levels
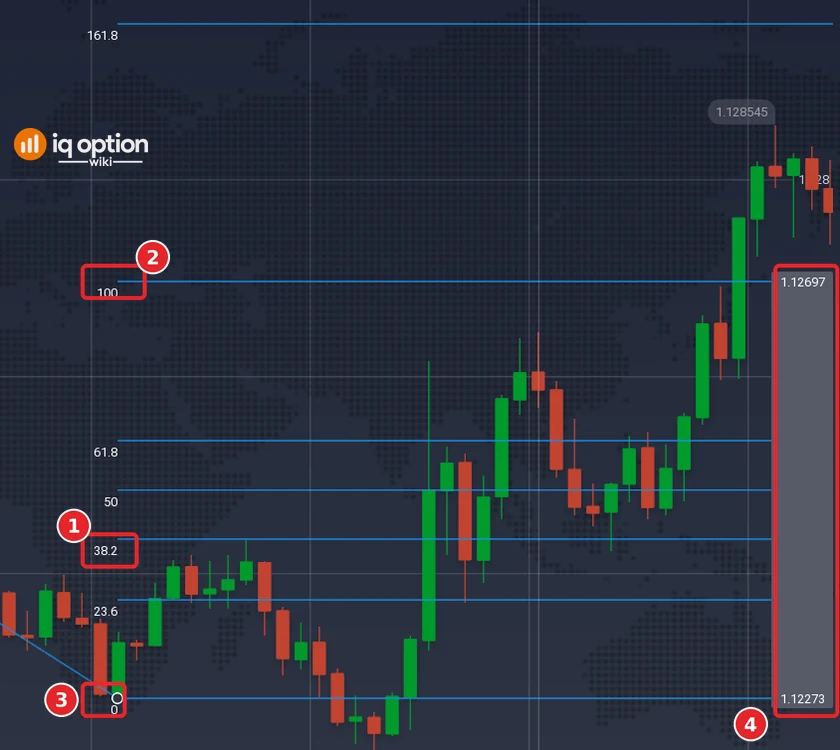
Each line is labelled, just left of its start, with a number, without a percent sign and without a price: 0, 23.6, 38.2, 50, 61.8, 100, 161.8 or 261.8 (1). The line at the first point you clicked is labelled 100 (2) and the line at the second point 0 (3). To read the price of a line, point at it and read the crosshair price on the price scale at the right edge; while the drawing is selected, the scale also tags the two points you clicked (1.12697 and 1.12273 in the picture) (4).
Step 7: Change or remove the drawing
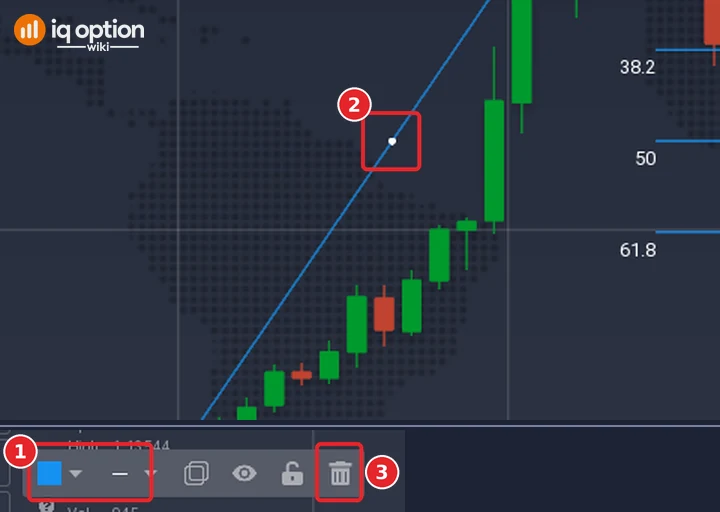
To change the colour or width of the lines, click the diagonal line to select the drawing: a small dot appears in its middle and a toolbar at the bottom left of the chart, with Select color and Select line width at its left end; the colour list has a palette and a transparency slider, and the width list has three thicknesses (1). IQ Option’s blog says you can select the colour and the width of the lines. To move the drawing, drag the small dot in the middle of the diagonal line; the whole drawing moves with it (2). The same toolbar also has Clone, Hide and a padlock button. To delete it, select it and press Delete, or click Remove, the trash icon at the right end of the toolbar (3). Every drawing also has a row in the Graphical tools list (the pencil button) with three icons, Edit, Hide and Remove, and the header of that list has a Remove all lines icon.
Using Fibonacci lines to measure a trend retracement
A retracement is a short-term price movement against the general trend; a reversal is a change of the trend itself. When a retracement ends, the earlier trend continues. IQ Option’s blog warns that a retracement can be mistaken for a reversal, which can hurt your results. The tool does not forecast which of the two you are looking at: it measures how far a pullback has gone, and the next candles show what it was.
The table gives IQ Option’s blog’s description of each ratio, except 100%, which is simply the whole swing, and says whether the platform drew each one by default.
| Common Fibonacci Ratios | Description | Drawn by the platform |
|---|---|---|
| 23.6% | A very shallow pullback; it shows strong momentum because buyers or sellers do not allow a deep correction | Yes |
| 38.2% | A normal, healthy correction; many stable trends retrace to this level before moving again | Yes |
| 50% | The midpoint of the previous move; many traders use it as a neutral zone to judge whether the pullback will deepen or reverse | Yes |
| 61.8% | The most-watched level; a deep pullback that still supports the idea of trend continuation | Yes |
| 78.6% | The last retracement level before the trend is at risk | No |
| 100% | The whole swing: price back at the start of the move | Yes |
The platform also draws a 0 line, which is the end of the swing (your second click), and two lines beyond the other end of it, at 161.8 and 261.8. IQ Option’s blog does not describe them, so the table leaves them out. The 78.6 line that one of the blog’s lists names was not drawn.
Pros of Using Fibonacci Lines
- One drawing marks possible support and resistance areas on the chart.
- IQ Option’s blog says the tool works on any asset and any time frame, as long as the swings match the scale of the trend.
- It combines with other tools: IQ Option’s blog names moving averages, RSI, MACD, candlestick signals, trend lines and support and resistance.
Cons of Using Fibonacci Lines
- It depends on the swing you pick. IQ Option’s blog says different traders choose different swing points and get slightly different levels.
- It is not a signal on its own and does not show how strong a trend is, according to IQ Option’s blog.
- IQ Option’s blog says it is less useful in sideways markets and around news, when price may ignore every level.
How to trade using Fibonacci lines on IQ Option
IQ Option’s blog describes a trend continuation approach. The list below is our summary of it, not a rule that has been tested:
- Identify a clear trend with clear swing points.
- Draw the tool from the swing low to the swing high in an uptrend, or from the swing high to the swing low in a downtrend.
- Wait for price to pull back into a level.
- Wait for confirmation, such as a rejection candle, a strong candle in the trend direction or a shift in momentum. The blog says Fibonacci levels “are not entry signals on their own”.
- Only then act in the trend direction.
The same blog suggests accompanying the lines with a momentum indicator such as the Stochastic Oscillator or MACD, and reading candles at the level: see price action and candlesticks.
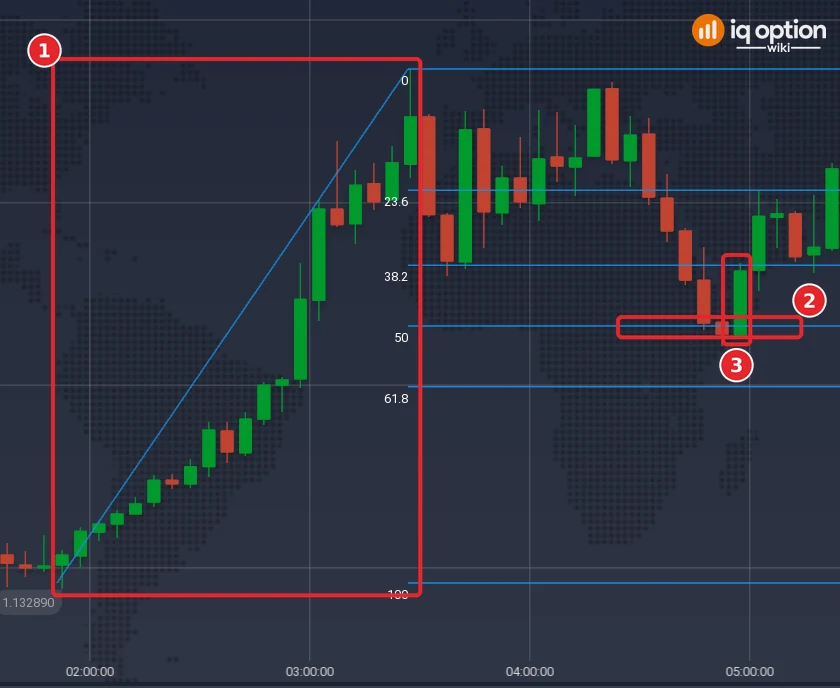
A binary option has a fixed expiry and no stop loss or take profit, so a Fibonacci level cannot act as a stop: you choose the direction and the expiry when you buy, and the trade closes at expiry whatever price does in between. How long to hold is your decision; see expiry times on IQ Option. A CFD (margin) trade has both a stop loss and a take profit, and IQ Option’s risk-reward article lists key Fibonacci levels among the chart features a target can come from. In our example the swing (1) runs from a low of 1.13289 at 01:50 to a high of 1.13573 at 03:25 on 30 September 2026, 28.4 pips. The 50 line sits at 1.13431 and the 61.8 line at 1.13397. Price pulled back to the 50 line and a little beyond it (2): the 04:50 candle reached 1.13422, 53.2% of the swing, between the 50 and the 61.8 lines, and the next candle (3), at 04:55, was green and closed at 1.13462. By 07:05 price had passed the swing high, reaching 1.13639. It could as well have fallen on to the 61.8 line at 1.13397 or through it; the drawing does not say which. No trade was placed.
Does Fibonacci work in trading?
The tool gives you lines, not a forecast. IQ Option’s blog says Fibonacci levels “show possible pullback areas, but they do not predict direction on their own”, that the tool is not a standalone system and that it is subjective at times, because different traders choose different swing points. Another IQ Option article says the levels are “not exact prices. They are zones”.
We have not tested it. A hand-drawn tool has no mechanical rule to run: where you anchor it is a judgement, so a replay would test our choices, not the tool. If you want evidence for your own method, write down how you choose the swing and what counts as confirmation before you trade, record each trade on a Practice balance and count the results over a few hundred trades. At an 85% payout a binary option needs to win more than 54% of the time to break even.
Common mistakes
IQ Option’s blog lists these mistakes and cautions:
- Using the tool in a sideways market. Without a trend the levels lose their meaning.
- Forcing it on small swings. Use clear highs and lows that stand out on the chart.
- Entering as soon as price touches a level. Wait for confirmation.
- Relying on one level. Markets react to different levels at different times.
- Drawing it into news. During news events price may ignore every level.
One more is specific to the platform: reading the labels from the wrong end of the drawing. The 0 is at your second click, the end of the swing, and the 100 at your first click, the start of it, so a price near the 38.2 line has given back 38.2% of the swing. Check the labels on your own chart, as in Step 6.
Related guides
- Fibonacci retracements: the time frame and three common drawing mistakes
- Support and resistance lines on IQ Option
- Trendline trading on IQ Option
- Identifying a trend on IQ Option
- Stochastic Oscillator settings on IQ Option
- MACD indicator on IQ Option
- All indicator guides and all strategy guides
Frequently Asked Questions
Q: What are the Fibonacci levels on IQ Option?
A: The tool drew eight horizontal lines, labelled 0, 23.6, 38.2, 50, 61.8, 100, 161.8 and 261.8. IQ Option’s blog gives the ratios as 23.6, 38.2, 50, 61.8 and 100 in one article and 23.6, 38.2, 50, 61.8 and 78.6 in another.
Q: Where is the Fibonacci tool on IQ Option?
A: Click the drawing tools button (the pencil icon) in the chart toolbar at the bottom left of the chart, then Fibonacci Lines, the last row of the Graphical tools list.
Q: How do I draw Fibonacci retracement in an uptrend and in a downtrend?
A: In an uptrend, start at the swing low and end at the swing high. In a downtrend, start at the swing high and end at the swing low. Click the first point, move the cursor to the second and click again. The platform draws the level lines from the second point to the right edge of the chart.
Q: Which Fibonacci level is the most important?
A: There is no single level to rely on. IQ Option’s blog calls 61.8 the most-watched level and says some traders treat it as the key one, but it also warns against relying on a single level, because markets react to different levels at different times.
Q: Does it work on every asset and time frame?
A: IQ Option’s blog says the tool can be used on any asset and any time frame, and that the swings should match the scale of the trend. That says where you can draw it, not how well it works.
Q: Can I trade on Fibonacci levels alone?
A: IQ Option’s blog says it is not advisable: the levels indicate a possible zone, and traders wait for a rejection candle, a trend continuation pattern or a momentum shift before entering.
Q: Is there a stop loss on a Fibonacci trade?
A: A binary option has no stop loss and no take profit. A CFD (margin) trade has both, and you choose where to place them.