
Last updated: 8 October 2026. Every screenshot below was recorded on 5 and 8 October 2026 on an IQ Option Practice account registered in Brazil, on 5-minute EUR/USD candles. We placed no real-money trade. The tested box shows what the rule in this guide did on the candles of 29 September to 5 October 2026; it says nothing about what it will do next.
No source we read ranks the indicators on IQ Option, and this guide does not name a winner. It does three things: it lists the indicators IQ Option’s chart offers and what each is for, it shows how an indicator strategy for binary options is built, and it sets out one example in full, a Stochastic Oscillator with a 200-period EMA as a trend filter on 5-minute candles. The example is written as a rule that anyone can repeat and test; it is not a recommendation, and no indicator makes a trade win.
Quick answer
- Example rule: 5-minute candles, EMA (200) as the trend filter and Stochastic (14, 3, 3) for timing; one-candle expiry.
- Higher: a candle closes above the EMA 200 and %K crosses above %D after %K was at or below 20.
- Lower: a candle closes below the EMA 200 and %K crosses below %D after %K was at or above 80.
- Indicators: the Chart analysis panel lists Momentum, Trend, Volatility, Moving Averages, Volume and Other; no source ranks them.
- Test result: in a replay on EUR/USD 5-minute candles (29 September to 5 October 2026), the rule gave 37 signals and won 17 of them (45.9%) with a one-candle expiry, below the 54.1% needed to break even at an 85% payout.
- Break-even: at an 85% payout a trade has to win about 54.1% of the time (1 ÷ 1.85); at 87%, 53.5%. With 37 trades the win rate has a margin of error of about ±8 points (one standard error), so 45.9% cannot be told from break-even.
Is Technical Analysis Worth Using on IQ Option?
Technical analysis reads past prices, in the shapes of a chart or in numbers calculated from them, to decide when to trade. It is a way of organising a decision, not a source of certainty: no tool gives certainty, and a signal that appeared on the chart does not tell you what the next candle will do. IQ Option’s own blog says it is possible to trade with no indicators at all, and that indicators are for traders who want to see more of the picture. Whether a rule has an edge is something you count: you test it on a Practice balance over many trades and compare its win rate with the break-even rate.
Two Main Approaches to Chart Analysis
Price Action
Price action reads the chart without indicators. It uses horizontal support and resistance levels, chart patterns such as the double top and the head and shoulders, and candlestick formations. See our guides to price action and candlesticks and support and resistance.
Technical Indicators
An indicator is a calculation on price data, drawn on or under the chart. It adds no new information: it shows the same prices in another form, such as an average, a distance or a range. IQ Option’s chart offers many of them in groups, listed below.
Indicators Available on IQ Option
The chart toolbar sits at the bottom left of the chart. Its indicators button, a wave icon, opens the Chart analysis panel with the tabs Indicators, Templates, Widgets and Scripts, a search box and the lists Added, Popular, Momentum, Trend, Volatility, Moving Averages, Volume and Other. The same indicators are available whichever instrument you trade; what changes is the exit, because a binary option has no stop loss and no take profit, and a CFD (margin) trade has both.
Indicator Categories
| Category | What it is for | Examples named by IQ Option’s blog or the panel |
|---|---|---|
| Momentum | The speed of a price move and possible reversals | Stochastic Oscillator, RSI, Momentum, Awesome Oscillator |
| Trend | The direction of the trend | Average Directional Movement Index, Commodity Channel Index, Ichimoku Clouds |
| Volatility | The size of price moves | Average True Range, Bollinger Bands, Donchian Channels |
| Volume | How much was traded, as a confirmation | Accumulation/Distribution, Net Volume, Volume Oscillator, Weis Wave Volume |
| Moving Averages | Smoothing the price so that the trend is easier to see | Moving Average (with a Type setting: SMA, EMA and others), Hull, Kaufman’s Adaptive |
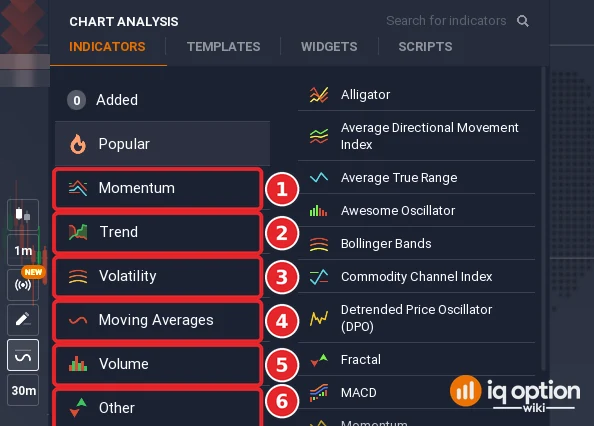
A single Moving Average indicator has a Type setting, so the SMA and the EMA are two settings of one indicator, and its default period in the published source code of the platform’s built-in indicators (Quadcode’s script library, called the repository below) is 14. IQ Option’s blog says that when several moving averages with different settings are combined they can show entry and exit points, and that they can also complement other indicators.
Which indicator should you use on IQ Option?
That depends on what you want to see, and no source we read ranks the indicators. What can be said is what each indicator is built to show, and what the three below do on a chart.
Moving Averages
A moving average is the average of the last N prices, and it is recalculated with each new candle. The shorter the period, the more closely it follows recent prices; the longer the period, the slower it is. Moving averages are used as signal generators when two of them cross, as trend filters when the price is above or below one, and as moving support and resistance. See our EMA guide.
Stochastic Oscillator
The Stochastic Oscillator shows where the latest close sits inside the recent high-low range. It has two lines, %K and %D, and two levels. The repository defaults are a period of 14, a smoothing of 3 and a %D period of 3, with the levels at 80 (overbought) and 20 (oversold). See using the Stochastic at IQ Option and the double Stochastic.
Bollinger Bands
Bollinger Bands draw a moving average with a band above and below it at a distance set in standard deviations, so they widen when prices move more and narrow when they move less. The repository defaults are a period of 20 and 2 standard deviations. Both Bollinger Bands and the MACD are built on moving averages. See Bollinger Bands on IQ Option and the BB1 strategy.
Popular Indicators Comparison
| Indicator | Primary function |
|---|---|
| Moving Average | Smooths the price; shows the trend and possible entry points |
| Stochastic Oscillator | Shows where the close sits in the recent range; overbought and oversold areas |
| Bollinger Bands | Shows volatility as a band around a moving average |
| RSI | Compares the size of recent gains and losses; overbought and oversold areas |
| MACD | Compares two moving averages of different length; trend direction and momentum |
Building Your Indicator Strategy
First decide what you trade. A binary option needs only a direction before its expiry. A CFD also needs an exit, a take profit and a stop loss. (Digital options add a strike price; see binary vs digital options.) This guide builds a rule for binary options. The method is the same for any indicator strategy: write the rule down, run it on past candles, and count.
Strategy Elements for Binary/Digital Options
| Element | What to decide | In the example below |
|---|---|---|
| Chart timeframe | One candle period, kept the same | 5-minute candles |
| Indicators | The indicators and their settings | EMA (200) and Stochastic (14, 3, 3) |
| Entry conditions | The exact rule for Higher and for Lower | See the rule below |
| Expiry | How long the option lasts | One candle: 5 minutes |
| Test | The number of trades and the result against the break-even rate | See the tested box |
Example strategy: Stochastic with an EMA 200 trend filter
The rule below fixes the candle size, the settings and the expiry, so that it can be tested:
- Higher: the candle closes above the EMA (200), and on that candle the Stochastic %K crosses above %D, after %K was at or below 20 on the previous candle.
- Lower: the candle closes below the EMA (200), and on that candle %K crosses below %D, after %K was at or above 80 on the previous candle.
- Entry and expiry: at the close of that candle, with an expiry of one candle (5 minutes).
The idea is a pull-back inside a trend: the EMA 200 gives the side, and the Stochastic cross out of its extreme area marks the end of the pull-back. Whether it works is what the tested box counts. On a CFD you would define the exit with a take profit and a stop loss; a binary option has neither.
Step 1: Open Chart analysis
Click the indicators button (1) at the bottom left of the chart to open the Chart analysis panel.

Step 2: Add the EMA 200
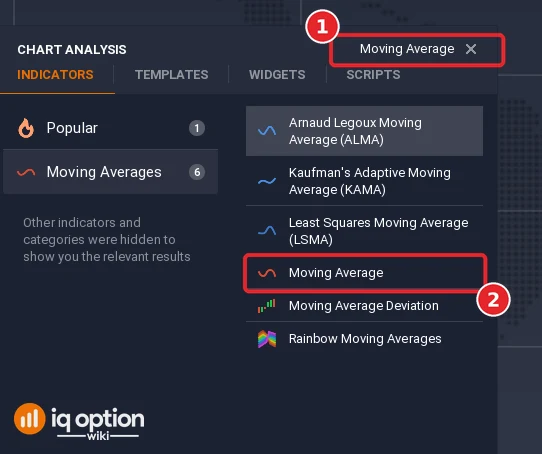
Step 2a. Type Moving Average in the search box (1) and click Moving Average (2), not the Moving Average Deviation below it.
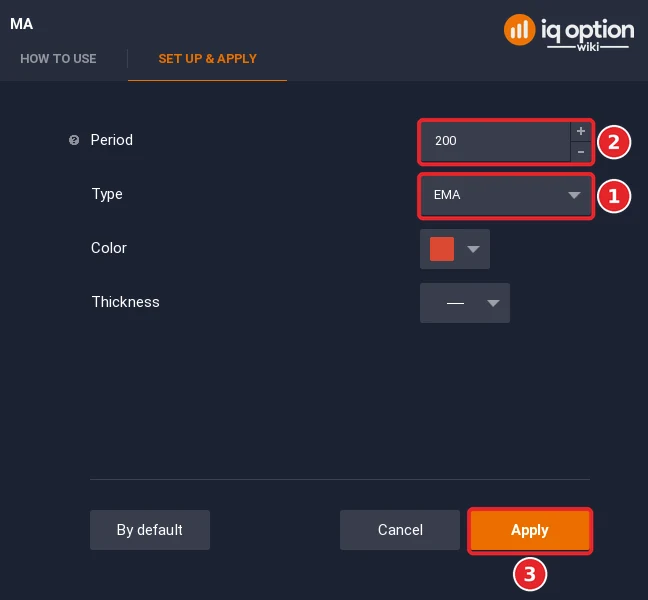
Step 2b. The dialog opens with the type SMA and the period 14. Set Type to EMA (1) and the period to 200 (2), then click Apply (3).
Step 3: Add the Stochastic Oscillator
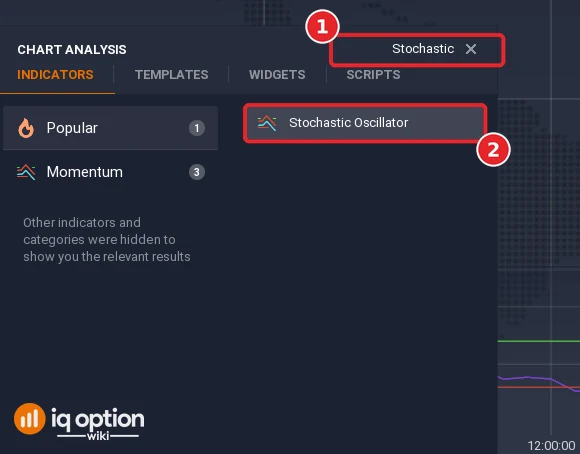
Step 3a. Open the Chart analysis panel again, type Stochastic in the search box (1) and click Stochastic Oscillator (2), not the Stochastic RSI. It opens in a separate panel under the price.
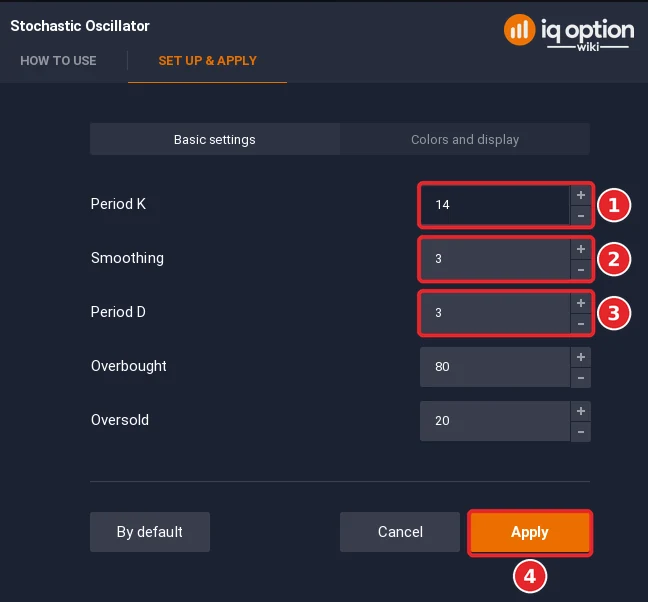
Step 3b. On Set up & apply, Basic settings shows Period K (1), Smoothing (2) and Period D (3), with Overbought 80 and Oversold 20. The dialog opens with Period K 13; the screenshot shows 14, which we typed because the rule in this guide, and its replay, use 14, 3 and 3. Click Apply (4). The panel label then reads Stoch (14, 3, 3).
Step 4: Use 5-minute candles and a 5-minute expiry
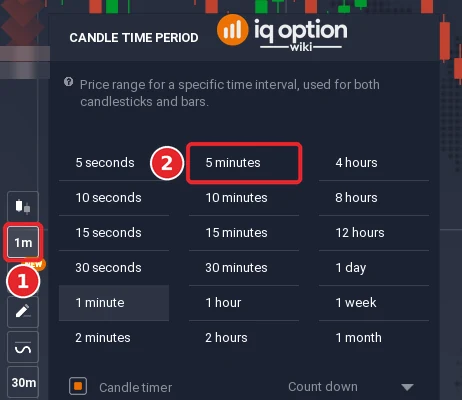
Step 4a. Click the candle time period button (1) at the bottom left and choose 5 minutes (2).
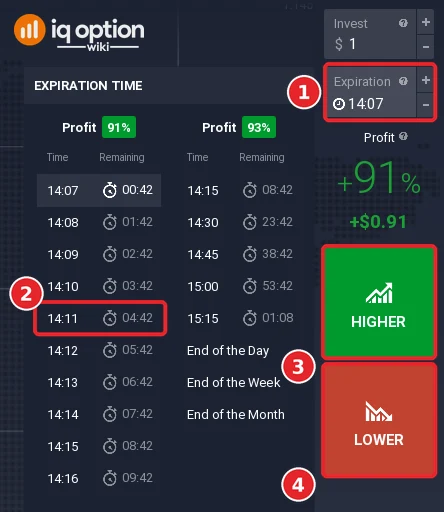
Step 4b. In the right-hand panel open the Expiration box and pick the clock time five minutes ahead (1 and 2 in the screenshot, which shows a list recorded at 14:07 with 14:12 as the 5-minute entry). The trade closes at the solid red line on the chart. The Higher (3) and Lower (4) buttons are in the same panel.
Step 5: Read the signal
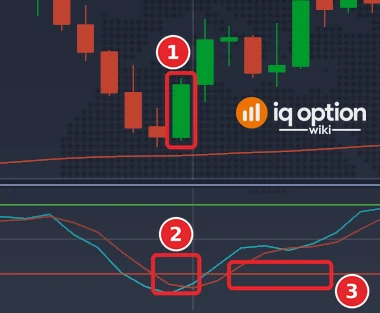
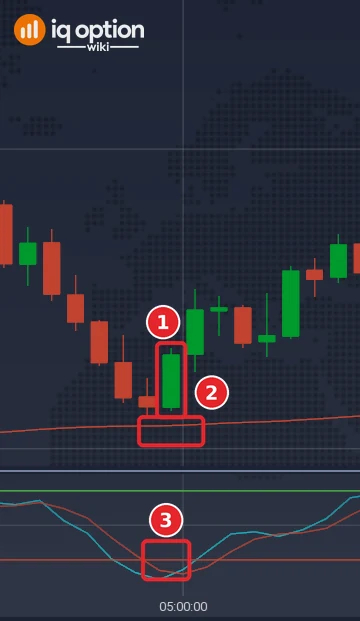
Look at the last closed candle. For a Higher signal the candle closes above the EMA line (1), and in the Stochastic panel %K has just crossed above %D (2) after %K was at or below the 20 level (3). For a Lower signal the mirror holds. Open the option as the next candle begins, with the Higher or Lower button (3 and 4 in Step 4b).
A Higher signal
The first Higher signal of the replay is the 5-minute candle that opened at 07:55 UTC on Wednesday 30 September 2026 (04:55 on the platform clock, UTC-3). It closed at 1.134625, above the EMA 200 (1.13421) (1, 2). On the Stochastic, %K rose from 2.7 to 11.5 and crossed above %D (7.8) after sitting at or below 20 (3). The entry is at the close of that candle. Five minutes later the price was 1.134925, above the entry, so the trade won. The second Higher signal, at 11:20 UTC the same day (entry 1.135745, exit 1.135765), also won, by 0.00002.
A Lower signal
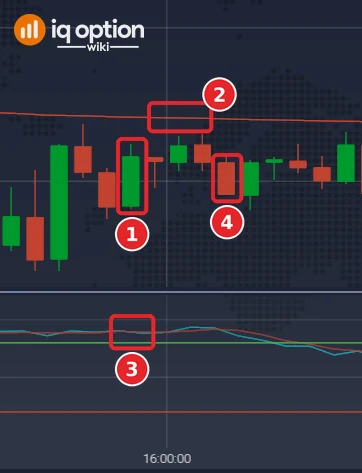
The first Lower signal is the candle that opened at 18:50 UTC on Tuesday 29 September 2026 (15:50 on the platform clock). It closed at 1.13416, below the EMA 200 (1.13467) (1, 2). %K had been at 90.5 and fell to 88.3, crossing below %D (89.4), so the two lines are close together, above the 80 level (3). The entry is at the close of that candle. Five minutes later the price was 1.13413, 0.00003 below the entry, so the trade won by 0.00003. The next Lower signal, 20 minutes later at 19:10 UTC (4; entry 1.133915), lost: the next candle closed at 1.13412. In the whole replay the Lower side won 13 of 29 trades, so two examples show nothing about the rule.
Tested on IQ Option: a replay run on 8 October 2026
| Asset and candles | EUR/USD (binary, regular market), 5-minute candles recorded from IQ Option’s Practice traderoom: 1,334 candles in two unbroken runs, 29 September 2026 01:55 to 2 October 2026 21:00 UTC (1,093 candles) and 4 October 2026 21:00 to 5 October 2026 17:05 UTC (241). The first 200 candles of each run only feed the EMA (200). The replay uses recorded candles and placed no real orders. The Stochastic is calculated from each candle’s high and low, as the platform draws it. |
|---|---|
| Rule tested | Higher when a candle closes above the EMA (200) and the Stochastic (14, 3, 3) %K crosses above %D after %K was at or below 20; Lower for the mirror (below the EMA, %K crosses below %D after %K was at or above 80). Entry at the close of that candle, expiry one candle (5 minutes). |
| Signals | 37 (8 Higher, 29 Lower). |
| Outcomes | 17 won, 20 lost, none refunded: 45.9% of decided trades (Higher 4 of 8, Lower 13 of 29), a net loss of $5.55 on $37 staked at an 85% payout. Break-even is 54.1%, so the rule was below it on these candles. With a Stochastic Period K of 13, the platform dialog’s default, the replay gave 38 signals, 18 won and 20 lost (47.4%). |
| Break-even | At an 85% payout a trade has to win more than 54% of the time (1 / 1.85); at 87%, 53.5%. |
The rule is one exact way of writing a Stochastic and EMA 200 strategy, so another way of writing it would give other signals. A short test proves nothing about the future: it covers one asset over a short stretch of candles, a rule that did well in it could lose tomorrow, and one that did badly could do better. No profit or win rate is promised. Compare the win rate with the break-even rate above, and repeat the test on your own Practice balance before you risk money.
Pros and Cons of Using Technical Indicators
| Pros | Cons |
|---|---|
| They turn a chart into a written rule that can be tested. | A single indicator gives an incomplete picture, and indicators can give false signals. |
| Their settings can be changed to suit the period you trade. | They are calculated from past prices, so they lag. |
| Several indicators can be combined, as in the example above. | They can be confusing at first, and they take time to learn. |
| They give a rule that does not depend on how you feel on the day. | A rule that fits past candles does not have to fit future ones. |
Troubleshooting and common mistakes
- You opened the Stochastic RSI. The platform’s list can show both. This rule uses the Stochastic Oscillator.
- The EMA line is flat or missing. Check that Type is set to EMA and the period to 200; the default period is 14. An EMA 200 needs 200 candles of history to start.
- The signal appears while the candle is still forming. The rule reads closed candles only; the lines can cross and cross back before the close.
- Too many indicators on the chart. Each one adds a calculation on the same prices. See too many indicators on your chart.
- You expect a stop loss. A binary option has none; it closes at its expiry time.
Conclusion
An indicator strategy is a rule written in advance: which indicators, which settings, what counts as a signal, and how long the trade lasts. Moving averages, the Stochastic and Bollinger Bands show different things, and none of them predicts the next candle. The example here can be rebuilt on the Practice balance in a few minutes; the test shows what it did on one stretch of candles. Before you risk money, record your own trades over a few hundred signals and compare your win rate with the break-even rate for the payout you actually get: more than 54% at an 85% payout, and about 53.5% at 87%.
Related guides
- RSI, Stochastic and EMA 200 strategy
- How to trade with the EMA indicator on IQ Option
- Using the Stochastic at IQ Option
- Bollinger Bands on IQ Option
- MACD indicator at IQ Option
- IQ Option scripts library
- All indicator guides and all strategy guides
Frequently Asked Questions
Q: Which indicator should I use on IQ Option?
A: No source we read names one. Each indicator shows something different, and what suits you depends on the period you trade and the rule you write. Count the results of a rule on a Practice balance before you rely on it.
Q: Can I use multiple indicators at once?
A: Yes. The example in this guide uses a moving average for the trend and the Stochastic for timing. Each additional indicator adds another condition, and signals become rarer.
Q: Do indicators work on every timeframe?
A: You can apply them to any candle period the chart offers, from 5 seconds to 1 month. The settings and the result change with the period, so a rule has to be tested on the period you trade.
Q: Can I change the indicator settings?
A: Yes, in the dialog of the indicator. Most dialogs have Basic settings for the values and Colors and display for the line colours, with the buttons By default, Cancel and Apply; an indicator with no numbers to set, such as the Fractal Chaos Bands, has only Colors and display.
Q: Should I use only indicators?
A: No rule says so. Many traders also read support and resistance and candles. IQ Option’s blog recommends confirming candle patterns with other tools.

