Last updated: 8 October 2026. Every screenshot below was recorded on 8 October 2026 on an IQ Option Practice account registered in Brazil, on EUR/USD 5-minute candles of 29 and 30 September 2026, scrolled back on the same chart, and nothing was traded with real money. This guide has no tested box: the lines are drawn by hand, where you place them is a judgement, and there is no mechanical rule to replay. Nothing here is a promise of profit.
A support line marks a price where buyers have stopped a fall before; a resistance line marks a price where sellers have stopped a rise. On IQ Option you draw both with the Horizontal Line tool from the Graphical tools list: choose it, click once on the chart at the price you want, and the platform draws a line across the whole chart. IQ Option’s blog defines support as “a price area where buyers have previously stepped in hard enough to stop a decline”, resistance as “the mirror image”, and tells you to “draw zones, not lines”.
Quick answer
- Where it is: the drawing tools button (a pencil icon) at the bottom left of the chart, then Horizontal Line in the Graphical tools list. One click on the chart draws the line.
- Support and resistance: a support line marks a price where buyers stopped a fall before, a resistance line a price where sellers stopped a rise. Treat each as a band, not an exact price.
- Strong or weak: count reactions, not taps. IQ Option’s blog says two clear reactions beat four weak taps in a choppy stretch.
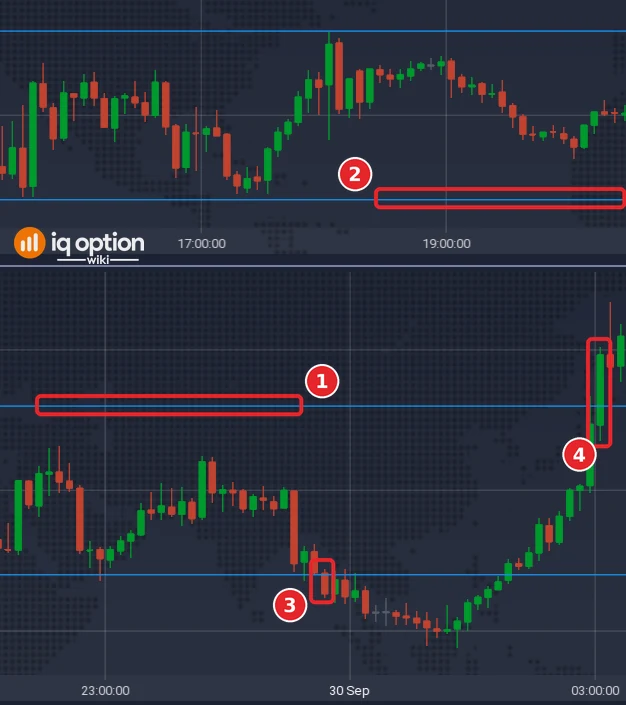
- Example: from 15:30 on 29 September 2026 to 00:40 on 30 September, about nine hours, EUR/USD traded between a support at 1.1334 and a resistance at 1.1346; the support held three times, a fourth test brought no reaction and the support broke at 00:45.
- Limit: a touch is not a signal and any level can break. No entry rule is tested here.
Overview of support and resistance
Support and resistance are levels on the chart that the price has a chance of retracing from. IQ Option’s blog puts it this way: “Support and resistance levels are significant levels on the asset chart that the price has a chance of retracing from.” A level is not a wall: the same blog says levels are “statistical tendencies backed by trader memory, clustered orders, and risk systems, not physical walls”.
Three ideas are enough to start:
- A level is a band. Price points that are within the same small range count as one level, so the touches do not have to be exactly equal. In the example below, the lows that make up the support sit within 0.9 pip of each other.
- A reaction counts, a tap does not. IQ Option’s blog says “Two high-quality reactions, with a clear impulse away and visible rejection, beat four weak taps in chop.”
- A broken level can switch sides. IQ Option’s blog says “The same zone that buyers defended becomes the zone sellers now defend”: an old support that price falls through can turn into resistance, and the other way round.
Lines do not have to be horizontal: IQ Option’s blog calls the inclined ones trend lines (“In addition to horizontal levels, there are also inclined levels. These are called trend lines.”). Our guide to trendline trading covers them.
How do you draw support and resistance lines on IQ Option?
These steps use the web traderoom on a Practice balance. The numbers in each screenshot match the numbers in the text.
Step 1: Choose the Horizontal Line tool
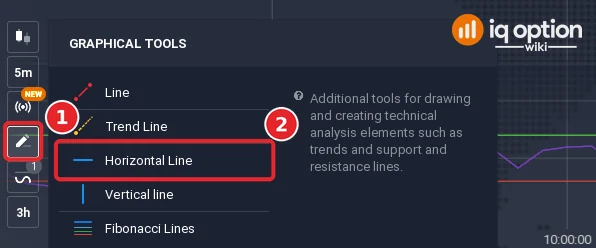
Click the drawing tools button (1), the pencil icon in the chart toolbar at the bottom left of the chart. It opens a list titled Graphical tools with Line, Trend Line, Horizontal Line, Vertical line and Fibonacci Lines. Click Horizontal Line (2).
Step 2: Draw a support line
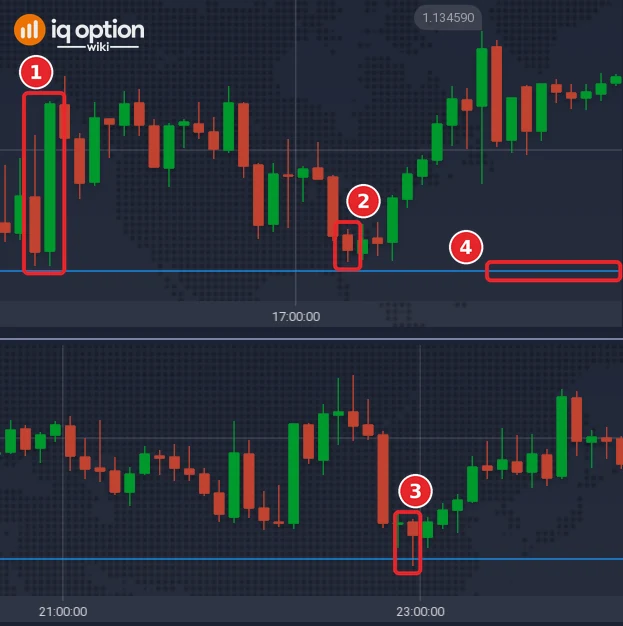
Find a price where several lows have stopped near the same level, and click once at that price. The line spans the whole chart and stays selected: a ring marks your click, a price tag at the right edge shows the line’s price and a toolbar appears at the bottom left of the chart. In the picture the lows of 15:30 (1), 17:15 (2) and 22:55 (3) on 29 September 2026 sit between 1.13336 and 1.13345, and the line (4) is placed at 1.1334. After each of the three touches price rose by 9.4, 7.2 and 6.8 pips within the next 30 minutes.
Step 3: Draw a resistance line
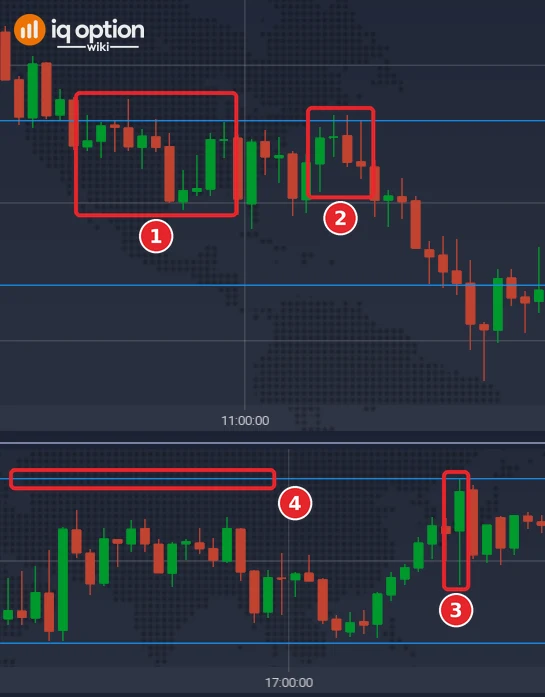
Do the same with highs: choose Horizontal Line again and click once at a price where several highs have stopped. In the picture the highs of 10:00 to 10:50 (1), of 11:25 to 11:40 (2) and of 18:00 (3) on 29 September 2026 sit between 1.13454 and 1.13464, and the line (4) is placed at 1.1346. After the touches of 10:00, 10:50, 11:35 and 18:00 price fell by 6.3, 7.7, 12.2 and 6.1 pips within the next 30 minutes, and no candle on that chart closed above the line until 03:00 on 30 September.
Step 4: Change or remove a line
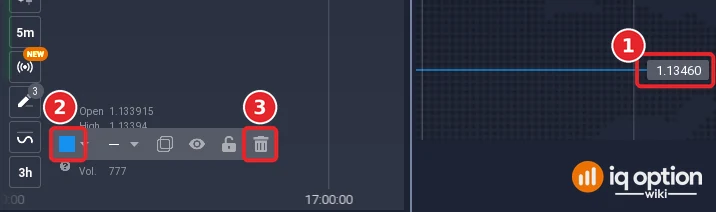
Click the line to select it. A tag at the right edge (1) shows its price (1.13460 for the resistance line in the picture), and a toolbar appears at the bottom left of the chart. Its tooltips read, from the left, Select color (2), Select line width, Clone, Hide, Unlock and Remove (3). Remove deletes the line, and so does the Delete key.
How do you tell a strong level from a weak one?
IQ Option’s blog gives a few tests. The table puts them next to what they mean on the chart.
| Test | What to look at | Source |
|---|---|---|
| Reactions, not taps | Count the touches that were followed by a clear move away from the level, with a rejection candle, and ignore slow touches in a choppy stretch. | IQ Option’s blog: “Two high-quality reactions, with a clear impulse away and visible rejection, beat four weak taps in chop.” |
| A level you do not keep moving | If you have to adjust the line again and again to make it fit, it is probably not a strong level. | IQ Option’s blog on breakouts: “If you need to adjust the line repeatedly, it’s probably not a strong level.” |
| A zone, not a hairline | Draw the line where the touches cluster and accept a few pips either side. | IQ Option’s blog: “Draw zones, not lines. A level is a band, not a hairline.” |
| A time frame you can watch | Use candles you are able to follow. | IQ Option’s blog: “If you cannot watch a 1-minute chart, do not anchor trades to 1-minute noise.” |
Example: a 12-pip range and the break of its support
From 15:30 on 29 September 2026 until 00:40 on 30 September, about nine hours, EUR/USD traded between the resistance (1) and the support (2): the lowest low in that stretch was 1.13336 and the highest high 1.13459, a range of 12.3 pips. The support at 1.1334 held at its first three touches. A fourth test, from 00:30 to 00:40 on 30 September (lows of 1.13343, 1.13336 and 1.13341), brought no reaction: the highest price in the next half hour was 1.13361, 2.5 pips above the touch. The support gave way at 00:45 (3), when a candle closed at 1.13327, the first close under the lowest of the touches (1.13336). A tap without a reaction is what IQ Option’s blog warns about. The resistance at 1.1346, touched from 10:00 on 29 September, was left at 03:00 (4), when a candle closed at 1.13497. A level that held several times can still break, and the two lines let you see when it does.
Trading with support and resistance on IQ Option
IQ Option’s blog says “A touch is not a signal. A reaction is.” and “Wait for a reaction (rejection wick, slowdown, role reversal) — don’t buy the touch.” It also says “One candle is not gospel, but a strong rejection close is a much better entry trigger than a simple tag of the level.”
In practice that gives a short routine: draw the line, wait until price comes back to it, and look at the candle that touches it. A candle that closes back away from the level, with a long shadow on the level’s side, is a reaction; a candle that closes through the level is a break. Which of the two happened is only known when the candle closes.
A binary or digital option has no stop loss or take profit: you choose the direction and the expiry when you buy and the trade closes at expiry whatever price does in between. How long to hold is your decision; see expiry times on IQ Option. A CFD (margin) trade has both, so the level can mark where you place the stop: IQ Option’s blog says “a good level is not one that holds. It is one where your loss is small if it does not.” We have not tested any entry rule on these lines. The guides on breakouts and on the rebound pattern cover the two things that can happen at a level.
Pros and cons of support and resistance lines
| Pros | Cons |
|---|---|
| They mark prices where the market has reacted before, with one click per line on IQ Option. | They are drawn by eye: IQ Option’s blog says levels are tendencies, not physical walls, and two traders draw different lines. |
| They can be drawn on any chart you can open, and used next to indicators such as the RSI or the moving averages. | Breakouts can be real or fake, according to IQ Option’s blog; a line that held many times can still break, as the support did in the example. |
| A broken level can become the opposite level, which gives you the next line to watch. | Too many lines make a chart unreadable and every candle looks like a touch. |
Common mistakes
- Treating a line as an exact price. It is a band: allow a few pips either side.
- Counting every tap. One clean reaction means more than several slow touches.
- Using one time frame only. A line drawn on 5-minute candles can sit inside a bigger level on a longer chart; check the bigger chart too.
- Buying the touch. Wait for the candle to close and show a reaction.
- Drawing too many lines. IQ Option’s blog says: “Keep five levels maximum on the chart you actually trade.” Delete the rest.
- Forgetting the level can break. Decide in advance what you do if a candle closes through it.
Related guides
- Trendline trading on IQ Option
- Trend lines combined with support and resistance
- The rebound pattern on IQ Option
- Support and resistance breakouts on IQ Option
- Fibonacci levels on IQ Option
- Chart patterns on IQ Option
- All indicator guides and all strategy guides
Frequently Asked Questions
Q: What is support and resistance on IQ Option?
A: Prices on the chart where the market has stopped a fall (support) or a rise (resistance) before. You draw them yourself with the Horizontal Line tool from the Graphical tools list; the platform does not draw them for you.
Q: How do I draw a support line on IQ Option?
A: Click the pencil icon at the bottom left of the chart, choose Horizontal Line and click once on the chart at the price where several lows have stopped.
Q: How many touches make a level strong?
A: IQ Option’s blog gives no number. It says two clear reactions beat four weak taps, so count the touches that were followed by a clear move away from the level.
Q: Do support and resistance lines have to be horizontal?
A: No. Inclined lines that connect rising lows or falling highs are called trend lines in IQ Option’s blog; see the guide on trendline trading.
Q: Which time frame should I use for support and resistance?
A: IQ Option’s blog says to use a time frame you can watch and not to anchor trades to 1-minute noise. The example in this guide uses 5-minute candles.
Q: What happens when support breaks?
A: The level can turn into resistance: IQ Option’s blog says an old support can become a new resistance. A break can also be fake, so wait for the candle to close and see what price does next.