
Last updated: 8 October 2026. Every screenshot below was recorded on 5 and 8 October 2026 on an IQ Option Practice account registered in Brazil. We placed no real-money trade. The tested box replays a fixed version of the rule on EUR/USD 5-minute candles recorded between 29 September and 5 October 2026, with an RSI check in place of the divergence you would otherwise find by eye; it says nothing about what the strategy will do next.
The “Stochastic RSI strategy” is a three-step method built from three separate indicators: the 200-period EMA decides which side to trade, a hidden divergence on the RSI marks a pullback inside that trend, and a crossover of the Stochastic Oscillator’s two lines times the entry. Despite its name it does not use the Stochastic RSI indicator. This guide shows how to set up the three indicators on IQ Option, how each step works and what a fixed version of the rule did in a replay.
Quick answer
- Three steps: the EMA 200 sets the side, a hidden divergence on the RSI marks a pullback, and a crossover of the Stochastic’s %K and %D times the entry. Despite the name, the Stochastic RSI indicator is not used.
- Settings: Moving Average with type EMA and period 200; RSI period 14; Stochastic with lines at 80 and 20 (Period K 13 by default on the platform, 3, 3; the replay used 14). The strategy leaves the RSI and the Stochastic at their defaults.
- Higher idea: price above the EMA 200, a higher low in price with a lower low on the RSI, then %K crosses above %D. The Lower idea is the mirror image.
- Fixed version replayed: close above the EMA 200, RSI above 50, and %K crossing above %D after being at or below 20 (Higher); the mirror for Lower. The RSI check replaces the divergence drawn by eye.
- Exits: on a CFD the strategy sets a stop loss and a take profit at twice the stop distance; a binary option has neither.
- Replay: 3 signals on EUR/USD 5-minute candles (29 September to 5 October 2026), 3-candle expiry: 2 won, 1 lost (66.7%) against 54.1% needed to break even at an 85% payout. Three trades prove nothing; with Period K 13 the replay gave 4 signals, 2 won and 2 lost.
Creating IQ Option template to trade the Stochastic RSI trading strategy
The steps below put the three indicators on one chart and save them as a template, so you can apply the same set to another asset in a couple of clicks. The numbers in each screenshot match the numbers in the text.
Can I use Stochastic and RSI together?
Both run from 0 to 100 and both are oscillators, so on a chart they often move in a similar way, and it is fair to ask what the second one adds. IQ Option’s blog says they measure different things: the Stochastic Oscillator shows where the latest close sits inside the recent high-low range, and the RSI shows the balance between recent average gains and losses. The strategy also does not use them in the usual way. The RSI is read for divergence, not for its 70 and 30 lines, and a trend filter, the EMA 200, decides the side.
The name can mislead. The Stochastic RSI is a separate indicator that applies the Stochastic calculation to the RSI line, and this strategy does not use it. It uses the RSI and the Stochastic Oscillator as two separate indicators.
Chart preparation for the Stochastic RSI strategy
The strategy sets only the EMA period and leaves the RSI and the Stochastic at their default settings; the one value that differs between the platform and the Quadcode source is the Stochastic’s %K period, 13 against 14 (see Step 4b). These steps use the web traderoom on a Practice balance. Choose the asset for the session first (see choosing a trading asset), then add the three indicators.
Step 1: Open Chart analysis
Click the indicators button (1), the wave icon in the toolbar at the bottom left of the chart. It opens the Chart analysis panel, which has the tabs Indicators, Templates, Widgets and Scripts and a search box (“Search for indicators”).

Step 2: Add the Moving Average and set it to EMA 200
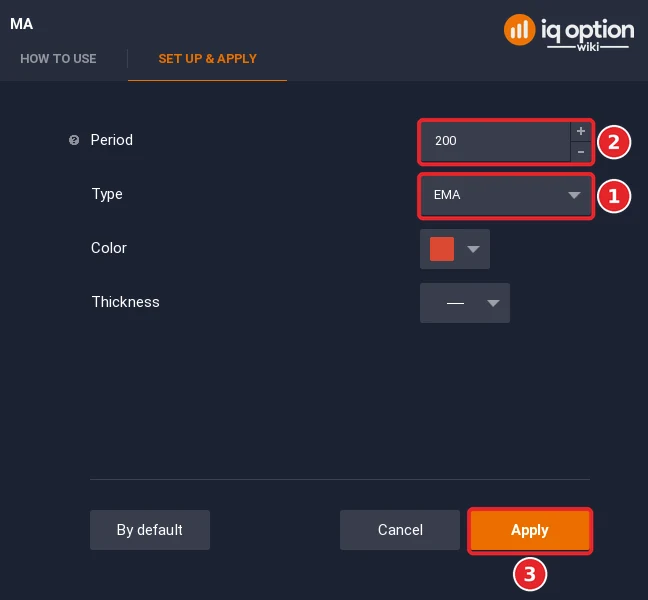
On the Indicators tab, type “Moving Average” in the search box and click Moving Average. On Set up & apply, set Type to EMA (1) and Period to 200 (2), then click Apply (3). IQ Option’s blog on moving averages says that periods of 100 or 200 show the major market direction and react slowly. A period counts candles, so the EMA 200 looks back 200 candles: 200 minutes on one-minute candles and 16 hours and 40 minutes on 5-minute candles.
Step 3: Add the RSI
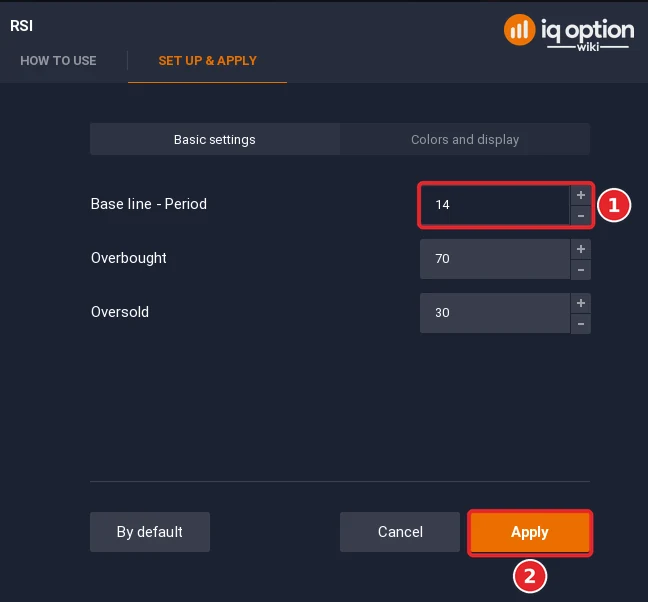
Search for “RSI” and click Relative Strength Index (RSI). The strategy leaves it at the defaults: Base line – Period (1) 14, with Overbought 70 and Oversold 30. Click Apply (2). The RSI is read here for divergence, not for its 70 and 30 lines.
Step 4: Add the Stochastic, not the Stochastic RSI
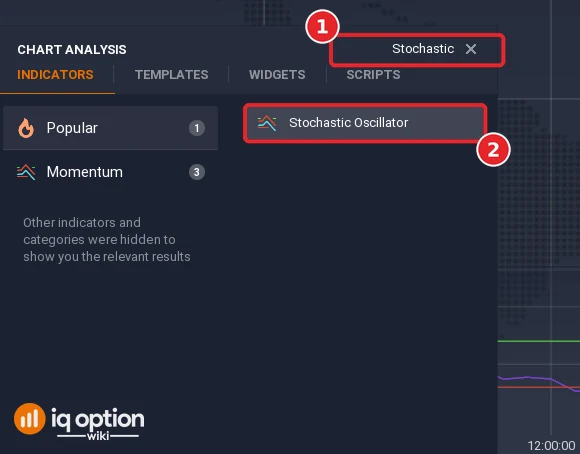
Step 4a. Type “Stochastic” in the search box (1). The Momentum group shows three results for that word, among them the Stochastic RSI; on the Popular list the result is Stochastic Oscillator. Click Stochastic Oscillator (2), not the Stochastic RSI.
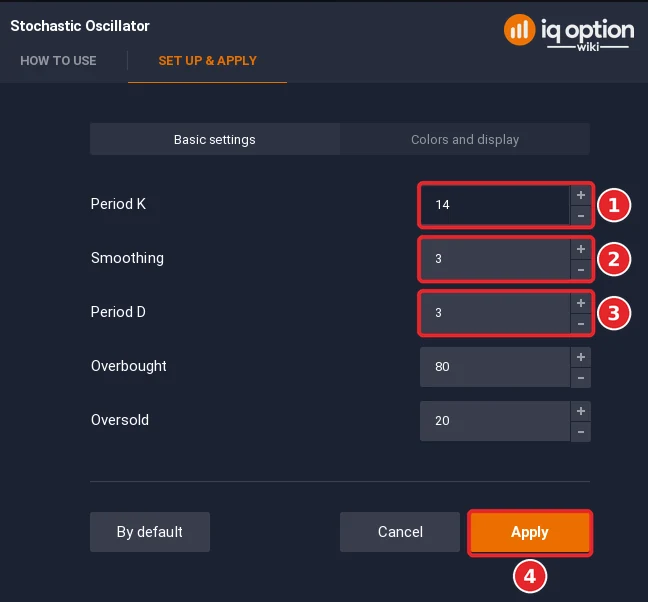
Step 4b. The strategy leaves it at the defaults. On Set up & apply, Basic settings shows Period K (1), Smoothing (2) and Period D (3), with Overbought 80 and Oversold 20. The dialog opens with Period K 13; the screenshot shows 14, which we typed because the library script and the replay below use a %K period of 14, as in the Quadcode source. Smoothing and Period D stay at 3. Click Apply (4). The panel label then reads Stoch (14, 3, 3). The same replay with 13 gave 4 signals instead of 3.
Step 5: Save the three indicators as a template
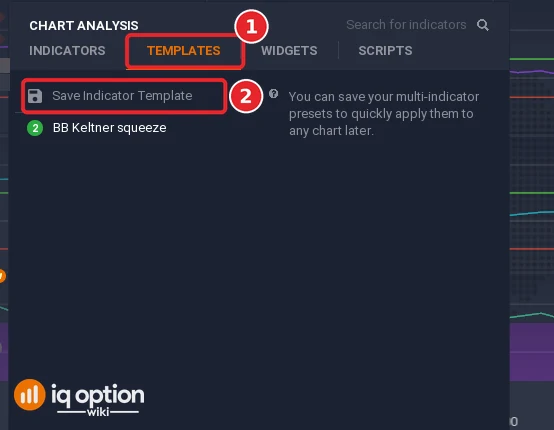
Open the Templates tab of Chart analysis (1) and click Save Indicator Template (2). The Added list opens with a Name field. Give the template a name you will recognise, for example EMA200+RSI+STOCH, and click Save. Our guide to chart templates has more.
Step 6: Read the chart
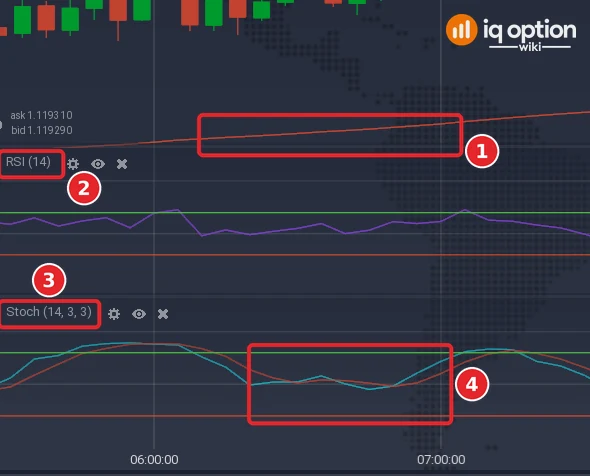
The EMA 200 (1) runs over the price candles. The RSI (2) and the Stochastic (3) sit in two panels below it, and the Stochastic draws two lines, %K and %D, between its lines at 80 and 20 (4). The strategy names no candle size; the replay below used 5-minute candles.
Trading with the Stochastic RSI strategy
The strategy has three steps, and the order matters: the EMA 200 decides the side, the RSI shows a pullback inside that trend, and the Stochastic times the entry. A Stochastic crossover on its own is not a signal.
The EMA 200 sets the side
If price runs above the EMA 200, look for Higher ideas only; if it runs below, look for Lower ideas only. IQ Option’s blog on moving averages says that periods of 100 or 200 show the major market direction, and that price which stays above a moving average often goes with a bullish structure and price below it with a bearish one. The same blog says that when price crosses the average repeatedly the market has no clear direction, so be careful when price keeps crossing the EMA 200.
Divergence means price and the RSI move in opposite directions. A regular divergence warns of a reversal: IQ Option’s RSI guide describes a bearish one as a higher high in price with a lower high on the RSI, and a bullish one as a lower low in price with a higher low on the RSI. This strategy uses the opposite pattern, a hidden divergence, to trade pullbacks in the direction of the main trend:
- In an uptrend (price above the EMA 200), price forms a higher low while the RSI forms a lower low.
- In a downtrend (price below the EMA 200), price forms a lower high while the RSI forms a higher high.
To see it, draw a line through the two lows (or highs) on the price chart and another through the matching points on the RSI. It is judged by eye, so two traders can mark different swings on the same chart. IQ Option’s guides to the RSI and the Stochastic Oscillator both call divergence a warning that needs a trigger from price; in this strategy the trigger is the next step. Our guide to divergences covers both types.
The Stochastic crossover times the entry
The Stochastic Oscillator draws two lines: %K, the faster one, and %D, its moving average. IQ Option’s Stochastic guide says that %K above %D means short-term momentum has improved, and %K below %D means it has weakened. After the divergence, wait for the next crossover: %K crossing above %D for a Higher idea, %K crossing below %D for a Lower idea. Enter on the next candle. IQ Option’s guide also says a crossover becomes useful when it answers a question already visible on the price chart, which is the case here only after the first two steps.
The Higher signal in three steps
A long position is a Higher option on a binary option and a buy on a CFD. The example below numbers the same three items.
- Price runs above the EMA 200.
- Price makes a higher low while the RSI makes a lower low.
- %K crosses above %D. Enter on the next candle, so open Higher at the close of the crossover candle.
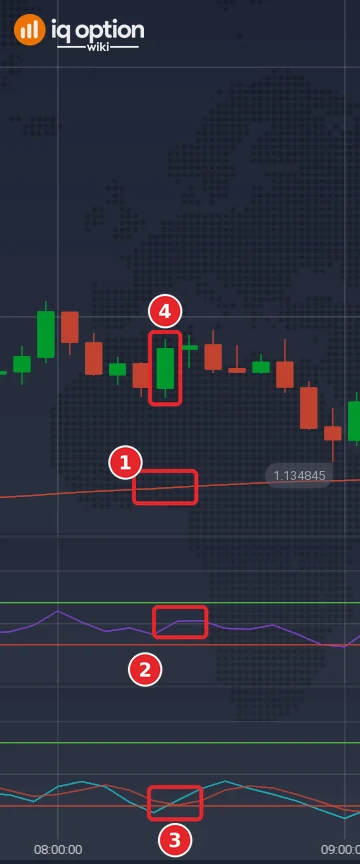
The first Higher signal of the replay, on EUR/USD 5-minute candles, is the candle that opened at 11:20 UTC on Wednesday 30 September 2026 (08:20 on the platform clock, UTC-3). It closed at 1.135745 above the EMA 200 (1.13467) (1). The RSI was 52.2, just above 50 (2). On the Stochastic (14, 3, 3), %K rose from 13.5 to 25.1 and crossed above %D (20.7), after sitting at or below 20 on the candle before (3). The entry is at the close of the marked candle (4). Three candles later, at 11:40 UTC, the price was 1.135555, below the entry, so the trade lost. It was the only Higher signal in the replay. The replay checks the RSI against 50 instead of looking for a divergence.
The Lower signal in three steps
A short position is a Lower option on a binary option and a sell on a CFD. The pattern is the mirror image:
- Price runs below the EMA 200.
- Price makes a lower high while the RSI makes a higher high.
- %K crosses below %D. Open Lower at the close of the crossover candle.
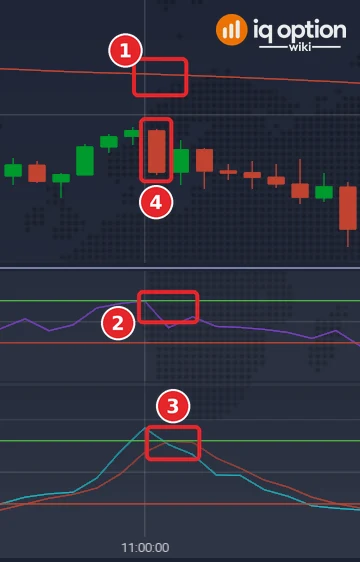
The first Lower signal is the candle that opened at 14:00 UTC on Thursday 1 October 2026 (11:00 on the platform clock). It closed at 1.128735, below the EMA 200 (1.13088) (1), with the RSI at 44.1, under 50 (2). %K fell from 92.0 to 76.2 and crossed below %D (79.5), after being at or above 80 on the candle before (3). The entry is at the close of the marked candle (4). At 14:20 UTC the price was 1.128715, 0.00002 below the entry, so the trade won by the smallest margin. The second Lower signal, on 2 October at 11:45 UTC, also won (entry 1.12362, exit 1.122975). With so few signals these two wins and one loss say nothing about the rule.
Stop loss and take profit on a CFD
The strategy ends each trade with a stop loss and a take profit, which only margin (CFD) trades have. For a long position the stop loss goes just below the nearest swing low, and for a short position just above the nearest swing high. The take profit is set at twice the distance to the stop loss, a reward-to-risk ratio of 2 to 1. A CFD (margin) trade can carry both orders. A binary option has neither a stop loss nor a take profit: you choose the direction, the stake and the expiry, so the replay below uses a fixed expiry instead of an exit rule. The 2 to 1 exit was not tested here.
How the replay reads the rule
A program cannot find a divergence that is drawn by eye, so the replay uses the fixed version in our script library. It keeps the EMA 200 and the Stochastic crossover and replaces the divergence by a check that the RSI sits on the same side of 50 as the trend: above 50 for a Higher signal, below 50 for a Lower one. IQ Option’s RSI guide says that an RSI holding above 50 supports positive momentum and one holding below 50 supports negative momentum. The crossover must also start from the extreme zone: %K at or below 20 on the candle before it crosses above %D for Higher, at or above 80 before it crosses below %D for Lower. The RSI check takes the place of the divergence, and the extreme-zone start is our addition. Signals are rare, because every condition has to agree. The replay computes the RSI with an exponential average and the Stochastic from each candle’s high and low, the way the platform draws them.
Tested on IQ Option: 8 October 2026
| Asset and candles | EUR/USD (binary, regular market), 5-minute candles recorded from IQ Option’s Practice traderoom: 1,334 candles in two unbroken runs, Tuesday 29 September 2026 01:55 to Friday 2 October 21:00 UTC (1,093 candles) and Sunday 4 October 21:00 to Monday 5 October 17:05 UTC (241). The first 200 candles of each run only feed the EMA(200), so signals start on Tuesday 29 September at 18:35 UTC and on Monday 5 October at 13:40 UTC. The replay uses recorded candles and placed no real orders. |
|---|---|
| Rule tested | On 5-minute candles: Higher when the close is above the EMA(200), the RSI(14) is above 50, and the Stochastic (14, 3, 3) %K crosses above %D after %K was at or below 20 on the previous candle; Lower for the mirror case (close below the EMA(200), RSI below 50, %K crosses below %D after being at or above 80). New setups only. Expiry 3 candles (15 minutes) after the signal candle closes. The RSI is smoothed with an exponential average and the Stochastic uses the candles’ highs and lows, as the platform’s own indicators do. The divergence drawn by eye is replaced by the RSI check, and the start of the crossover in the extreme zone is our addition. |
| Signals | 3 (1 Higher, 2 Lower). Signals are rare because every condition has to agree. |
| Outcomes | 2 won, 1 lost, none refunded: 66.7% of decided trades (Higher 0 of 1, Lower 2 of 2), a net gain of about $0.70 on $3 staked at an 85% payout. Break-even is 54.1%. Three trades are far too few to tell this from chance. With a Stochastic Period K of 13, the platform dialog’s default, the replay gave 4 signals (1 Higher, 3 Lower), 2 won and 2 lost. |
| Break-even | At an 85% payout a trade needs to win more than 54% of decided trades (1 ÷ 1.85); at 87%, 53.5%. |
A short replay proves nothing about the future. It used candles recorded from IQ Option’s Practice traderoom and placed no real orders. It shows what one fixed version of the rule did on the candles that were replayed; the strategy itself, with a divergence drawn by eye, was not tested. Another asset, another period or another candle size can give a different result. Nothing here is a promise of profit or of any win rate.
Pros and Cons of the Stochastic RSI Strategy
| Pros | Cons |
|---|---|
| Each indicator has one job: the EMA 200 gives the side, the RSI the pullback and the Stochastic the timing. | The RSI and the Stochastic are both oscillators between 0 and 100 and often move in a similar way, although they measure different things. |
| It looks for pullbacks in the direction of the larger trend instead of trading against it. | The divergence is judged by eye, so two traders can mark different swings on the same chart. |
| The RSI and the Stochastic stay at their default settings; only the EMA period is set. | Signals are rare, because every condition has to agree, and a Stochastic crossover on its own does not show that a pullback is over. |
Stochastic RSI Strategy Elements and Purposes
| Element | Purpose | Setting |
|---|---|---|
| EMA 200 | Trend filter: look for Higher ideas above it and Lower ideas below it. | Moving Average, type EMA, period 200 |
| RSI | Shows divergences that mark a pullback inside the trend. | Period 14; the 70 and 30 lines are not used for entries |
| Stochastic Oscillator | Times the entry with a crossover of %K and %D. | Period K 13 by default (the replay used 14), smoothing 3, Period D 3, lines at 80 and 20 |
Summary of the Stochastic RSI strategy
The strategy puts three indicators on one chart and reads them in order: the trend with the EMA 200, the pullback with a divergence on the RSI, and the entry with a Stochastic crossover. The step that takes practice is recognising the divergence, because it is judged by eye. The replay of the fixed version gave 3 signals on EUR/USD 5-minute candles, 2 won and 1 lost; with so few signals it says nothing about the rule. The Practice balance uses virtual money and can be refilled to $10,000, so it is the place to learn the pattern before you risk your own money.
Common mistakes
- Adding the Stochastic RSI instead of the Stochastic. They are different indicators. This strategy uses the one named Stochastic, with the RSI as a separate indicator.
- Trading a crossover without the first two steps. The Stochastic lines cross all the time; the crossover counts only after the trend and the divergence agree.
- Trading against the EMA 200. Below the EMA 200 the strategy looks for Lower ideas only, whatever the RSI shows, and above it for Higher ideas only.
- Calling any two swings a divergence. The bullish pattern needs a higher low in price with a lower low on the RSI, and the bearish pattern needs the reverse.
- Looking for a stop loss on a binary option. A binary option has no stop loss and no take profit; the stop and the 2 to 1 target belong to margin trades.
Related guides
- Divergences on IQ Option
- RSI indicator trading at IQ Option
- Using the Stochastic at IQ Option
- Trade the Stochastic with support and resistance
- RSI and support and resistance strategy
- Moving Average at IQ Option and how to trade with the EMA indicator
- Identifying a trend at IQ Option
- Chart templates on IQ Option
- Minimize losses on IQ Option
- IQ Option scripts library, with the IQOW RSI Stochastic EMA200 script that marks the fixed version on your chart
- All indicator guides and all strategy guides
Frequently Asked Questions
Q: Is the Stochastic RSI strategy the same as the Stochastic RSI indicator?
A: No. The strategy uses three separate indicators: the EMA 200, the RSI and the Stochastic Oscillator. The Stochastic RSI is a different indicator that applies the Stochastic calculation to the RSI line.
Q: Can the Stochastic RSI strategy be used for all financial instruments?
A: The replay above covers EUR/USD only and we did not compare asset types, so we cannot say which instruments suit it.
Q: Is the Stochastic RSI strategy suitable for beginners?
A: It needs three indicators and a divergence that is judged by eye, so it takes more practice than a rule with one indicator. Start on the Practice balance.
Q: How effective is the Stochastic RSI strategy in different market conditions?
A: We have not measured it across market conditions; the replay above covers EUR/USD only. IQ Option’s blog on moving averages says that when price crosses the average repeatedly the market has no clear direction, which is a reason for caution when price keeps crossing the EMA 200.
Q: Does the strategy always make a profit?
A: No rule wins every trade. At an 85% payout a binary option trade needs to win more than 54% of decided trades to break even (1 ÷ 1.85); at 87%, 53.5%. Read the payout next to the asset, because it changes.
Q: Which candle size and expiry does the strategy use?
A: The strategy names neither a candle size nor an expiry. Its exit is a stop loss and a take profit, which only margin (CFD) trades have. The replay used 5-minute candles and an expiry of 3 candles (15 minutes) after the signal candle closes.
Q: How much time should I spend practicing on the Practice balance?
A: There is no fixed number. A replay of a few signals cannot show whether the rule has an edge, so count your own results over many more trades. The Practice balance starts at $10,000 and has a “Refill to $10,000” button.
Q: Can I add the rule as a script?
A: The IQ Option scripts library has IQOW RSI Stochastic EMA200, which marks a close relative of the fixed version used in the replay: its Stochastic is calculated from closing prices, so it can mark other candles than the replay did. It does not draw divergences; it checks that the RSI is above or below 50 instead. Import it as shown in our scripts guide.

