
Last updated: 8 October 2026. Every screenshot below was recorded on 8 October 2026 on an IQ Option Practice account registered in Brazil, on 5-minute EUR/USD candles. We placed no real-money trade. The tested box shows what the fast-then-slow Stochastic rule did on 5-minute EUR/USD candles recorded from 29 September to 5 October 2026; it says nothing about what the rule will do next. The dual-stochastic setup from IQ Option’s blog, described near the end, was not part of that test.
The Double Stochastic strategy puts two Stochastic oscillators with different settings on one chart and marks an entry only when both agree. In the version this guide describes, a fast Stochastic (%K period 8, smoothing 5, %D period 3) gives the first cross in the oversold or overbought zone, and a slow one (17, 7, 3) has to confirm it a few candles later. The page also gives the Stochastic formula and the platform’s default settings, the clicks that set up both oscillators on IQ Option’s chart, the entry rule written so it can be tested, and a different dual-stochastic setup that IQ Option’s own blog describes.
Quick answer
- Setup: two Stochastics, a fast one (%K period 8, smoothing 5, %D period 3) and a slow one (17, 7, 3), both with the levels 80 and 20.
- Higher: the slow %K crosses above its %D at or below 20, and the fast %K crossed above its %D at or below 20 on the same candle or in the previous four. Lower is the mirror at or above 80.
- Platform defaults: Period K 13, Smoothing 3, Period D 3, levels 80 and 20, as the dialog showed on 5 and 8 October 2026 (the Quadcode repository lists 14).
- Formula: raw %K = 100 × (Close − Low N) ÷ (High N − Low N), with High N and Low N from candle highs and lows, then averaged twice.
- Alternative: IQ Option’s blog uses 21, 10, 4 and 5, 2, 2 with a 20-period EMA and looks for opposite extremes in a strong trend.
- Test result: on 1,334 five-minute EUR/USD candles (29 September to 5 October 2026) the rule, with the Stochastic from highs and lows as the platform’s chart draws it, fired 59 times (34 Higher, 25 Lower) with a four-candle expiry and won 23 of 57 decided trades (40.4%), against a break-even of 54.1% at an 85% payout. A short replay predicts nothing.
What is the Stochastic oscillator?
The Stochastic oscillator is a momentum indicator that shows where the latest close sits inside the recent price range, on a scale from 0 to 100. A reading near 100 means the close is near the top of the range of the last N candles, and a reading near 0 means it is near the bottom. IQ Option’s blog credits George C. Lane with creating it in the 1950s. The number is a position inside a range, not a probability: a reading of 80 does not mean an 80% chance that price will rise or fall.
The indicator draws two lines. %K is the faster one. %D is a moving average of %K and works as the signal line. Two horizontal lines, set by default at 80 and 20, mark the overbought and oversold zones. The period counts candles, not days: a period of 14 covers the last 14 candles of whatever size the chart uses.
What is the formula for calculating the Stochastic Oscillator?
The calculation compares the latest close with the range of the last N candles, then averages the result twice.
| Line | Calculation |
|---|---|
| Raw %K | 100 × (Close − Low N) ÷ (High N − Low N) |
| %K | Simple moving average of raw %K over the smoothing period |
| %D | Simple moving average of %K over the %D period |
Close is the latest closing price. Low N is the lowest price and High N the highest price over the last N candles. IQ Option’s blog gives this example: with a highest high of 110, a lowest low of 90 and a latest close of 106 over 14 candles, raw %K = 100 × (106 − 90) ÷ (110 − 90) = 80. The close finished 80% of the way from the bottom of the range to the top.
The Quadcode source of IQ Option’s built-in Stochastic multiplies by 100, so the lines run from 0 to 100.
High N and Low N are taken from candle highs and lows. We checked this against the platform’s chart: at two candles the chart’s %K read 14.3 and 77.8, a calculation from highs and lows gave 13.4 and 77.3, and a calculation from closes only gave 10.1 and 82.3. Our script library’s Double Stochastic script, and a tool that takes the extremes from closing prices, can therefore show other readings than the chart does.
The parameters of the indicator
The Stochastic has three settings that decide how fast it reacts, plus two levels. The platform’s dialog opens with these starting values:
| Setting | What it does | Default |
|---|---|---|
| %K period | Number of candles in the range | 13 |
| %K smoothing | Number of candles averaged to smooth raw %K | 3 |
| %D period | Number of candles averaged to make the %D line | 3 |
| Overbought and oversold levels | The two horizontal lines | 80 and 20 |
The platform’s dialog and the chart label (“Stoch (13, 3, 3)”) showed a default %K period of 13 on 5 and 8 October 2026; the Quadcode repository lists 14. IQ Option’s blog describes what each change does:
- A shorter %K period reacts faster, reaches the extremes more often and produces more noise. A longer one uses a wider range and changes more slowly.
- Less smoothing keeps more of raw %K’s movement, so crossovers increase. More smoothing removes small swings but makes turns later.
- On a lower timeframe the same settings describe a shorter piece of market history.
Platforms do not label the settings the same way. According to the blog, some show Fast, Slow or Full Stochastic and others show Period K, Smoothing and Period D. Read the label next to each box before you type a number.
How to use the Stochastic oscillator on the IQ Option platform
The Stochastic is added from the indicators button in the chart toolbar; steps 1 to 6 below show every click. Once it is on the chart, the classic reading looks at where %K crosses %D. A cross of %K above %D below the oversold line (20) is read as a sign that downward momentum is fading, and a cross of %K below %D above the overbought line (80) as a sign that upward momentum is fading.
These crosses are weaker than they may sound. IQ Option’s blog says above 80 is not an automatic sell signal and below 20 is not an automatic buy signal: in a persistent advance prices often close near the top of their range, so the oscillator can stay above 80 for a long time. A cross shows that short-term momentum has changed against its recent average. It does not show that the wider trend has reversed. The Double Stochastic strategy adds a second oscillator that must agree before an entry is marked; whether that helps is what the tested box below measures.
How to add two Stochastic oscillators to the IQ Option chart
These steps use the web traderoom (see the IQ Option platform overview) on a Practice balance. The numbers in each screenshot match the numbers in the text.
Step 1: Open Chart analysis
Click the indicators button, the wave icon in the chart toolbar at the bottom left of the chart (1). The Chart analysis panel opens with the tabs Indicators, Templates, Widgets and Scripts.

Step 2: Find the Stochastic
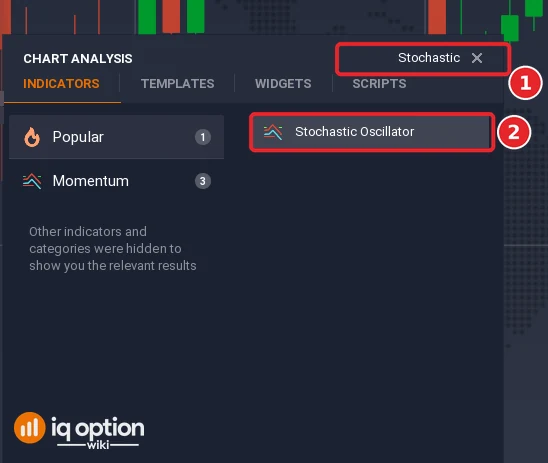
On the Indicators tab, type “Stochastic” into the search box, “Search for indicators” (1), and click the Stochastic Oscillator result (2). The indicator is also in the Popular and Momentum lists.
Step 3: Read the default settings
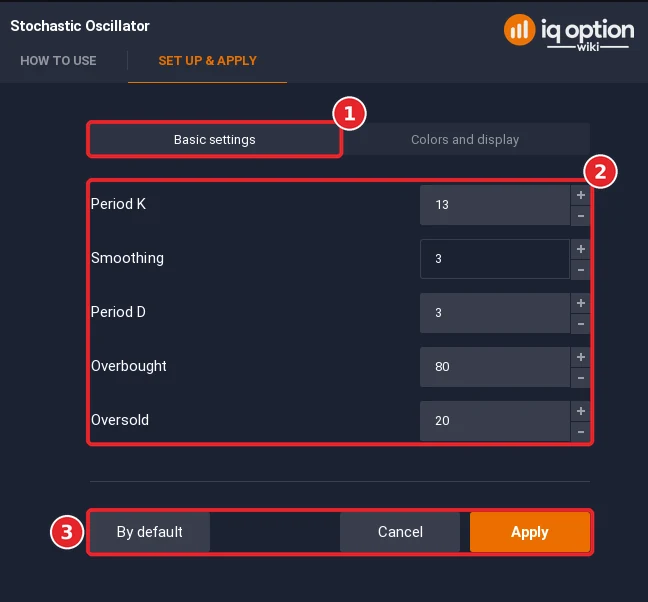
The dialog opens with the tabs How to use and Set up & apply. The settings are on Basic settings (1). A new Stochastic starts with Period K at 13, Smoothing at 3, Period D at 3, and the levels Overbought at 80 and Oversold at 20 (2). The buttons at the bottom are By default, Cancel and Apply (3). Line colours and widths are on Colors and display.
Step 4: Set the fast Stochastic and click Apply
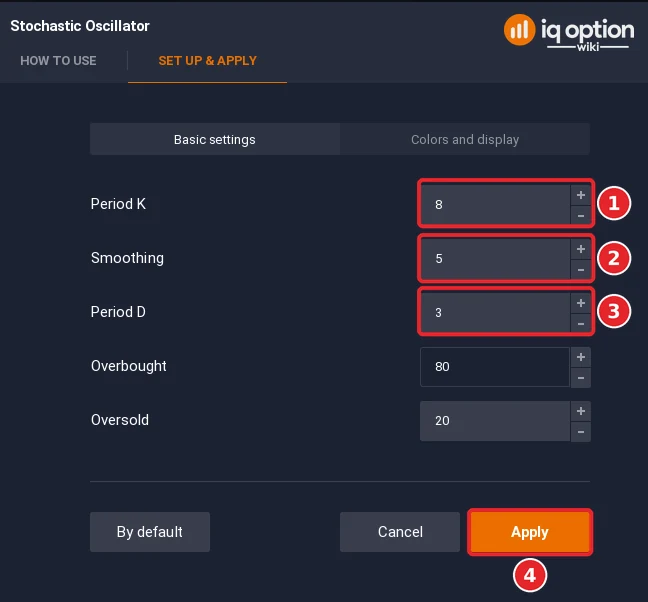
The fast oscillator uses a %K period of 8, a smoothing of 5 and a %D period of 3. Set Period K to 8 (1), Smoothing to 5 (2) and Period D to 3 (3), leave the levels at 80 and 20, and click Apply (4). The indicator appears in the bottom part of the screen, right below the price chart. Match each number to its label, not to its position in the dialog.
Step 5: Add the slow Stochastic
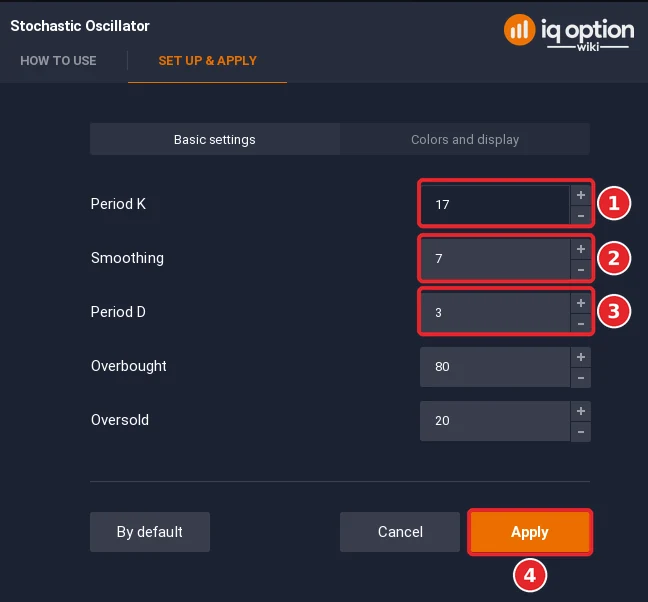
Open Chart analysis again, search for Stochastic and click the Stochastic Oscillator entry a second time. The platform does not change the first one: it opens a new dialog with the defaults and adds a second indicator, so the chart then shows two panels, labelled Stoch (8, 5, 3) and Stoch (17, 7, 3). The slow oscillator uses a %K period of 17, a smoothing of 7 and a %D period of 3. Set Period K to 17 (1), Smoothing to 7 (2) and Period D to 3 (3), then click Apply (4). The second Stochastic starts with the same line colours as the first (light blue %K, red %D), so go by the label above each panel to tell them apart; the line colours can be changed on Colors and display.
Step 6: Switch to 5-minute candles
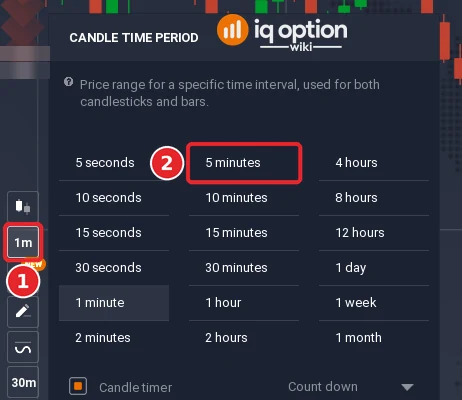
The test below uses 5-minute candles; other time frames can also be tried. Click the candle time period button in the chart toolbar (1) and choose 5 minutes (2). Our script library lists 5-minute to 15-minute candles for the same rule.
The Double Stochastic strategy with its trading signals
The two oscillators have different jobs. The fast Stochastic reacts first: when its %K crosses its %D inside the oversold or overbought zone it is only a hint, and the guide says not to enter yet. The slow Stochastic is the confirmation. It is smoothed more heavily and reaches the extreme zones less often, so its cross is rarer and later. An entry is marked only when both have crossed in the same zone within a few candles.
| Setting | Fast Stochastic | Slow Stochastic |
|---|---|---|
| %K period | 8 | 17 |
| %K smoothing | 5 | 7 |
| %D period | 3 | 3 |
| Overbought and oversold levels | 80 and 20 | 80 and 20 |
| Job | First hint | Confirmation |
Written as a rule that can be checked, the entry reads:
- Higher: the slow %K crosses above the slow %D while it is at or below 20, and the fast %K crossed above the fast %D at or below 20 on the same candle or in the previous four.
- Lower: the mirror. The slow %K crosses below the slow %D at or above 80, and the fast %K crossed below the fast %D at or above 80 on the same candle or in the previous four.
- Hold: about four candles: roughly 20 minutes on 5-minute candles, an hour on 15-minute candles and about four hours on 1-hour candles.
A binary option has no stop loss and no take profit; it closes at the expiry you chose. A CFD (margin) trade has both. The IQ Option scripts library has a Double Stochastic script that marks this rule on the chart.
What is the best stochastic setting for day trading?
No setting suits every market. IQ Option’s blog says most traders start with the default settings and adjust them later to their own goals. This strategy changes the defaults on purpose: two sets of settings are laid over the same chart so that an entry has to pass two tests, one on a shorter and one on a longer window. The blog’s advice on changing a setting applies here too. Change one only when you can say what problem the change solves, and apply it to enough trades to count the results.
Opening long transactions with the Double Stochastic strategy on IQ Option
A long entry is a Higher option, or a Buy on a margin asset. Wait for the fast %K to cross above the fast %D in the oversold zone, and do not enter yet. Then watch the slow Stochastic. When its lines cross up in the oversold zone as well, the confirmation has arrived, and the entry is the close of that candle. If the slow lines have not crossed within a few candles of the fast cross, the setup is over.
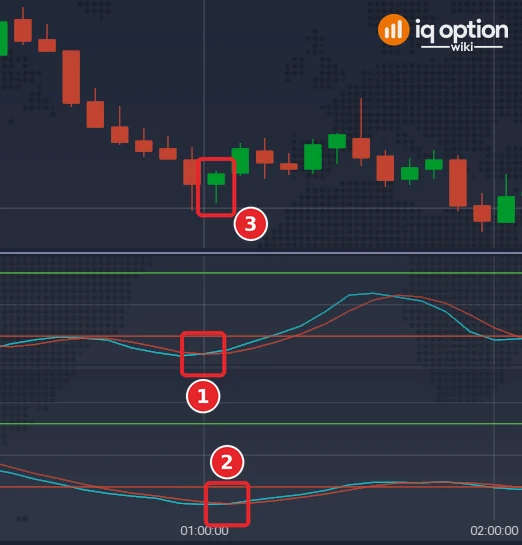
On 29 September 2026 the rule gave a Higher signal on the candle that opened at 04:00 UTC (01:00 on the platform clock, UTC-3). On the chart, the fast %K crossed above the fast %D below the 20 line (1) on the candle before it, and the slow %K crossed above the slow %D, also below 20, on the signal candle (2). That slow cross is narrow: %K 3.85 against %D 3.82, so the lines only just touch on the chart. The entry is the close of that candle (3), 1.136135. Four candles later, at 04:25 UTC, the price was 1.13625, above the entry, so the option would have won. The next Higher signal of the series, at 07:50 UTC, lost; the examples are the first signals in time order, not selected by outcome.
Opening short transactions with the Double Stochastic strategy on IQ Option
A short entry is a Lower option, or a Sell on a margin asset. The order is the same in the overbought zone. The fast %K crosses below the fast %D at or above 80, and the slow %K crosses below the slow %D at or above 80 on the same candle or within the next few candles. Enter at the close of the candle on which the slow lines cross, and match the length of the trade to the chart as described above.
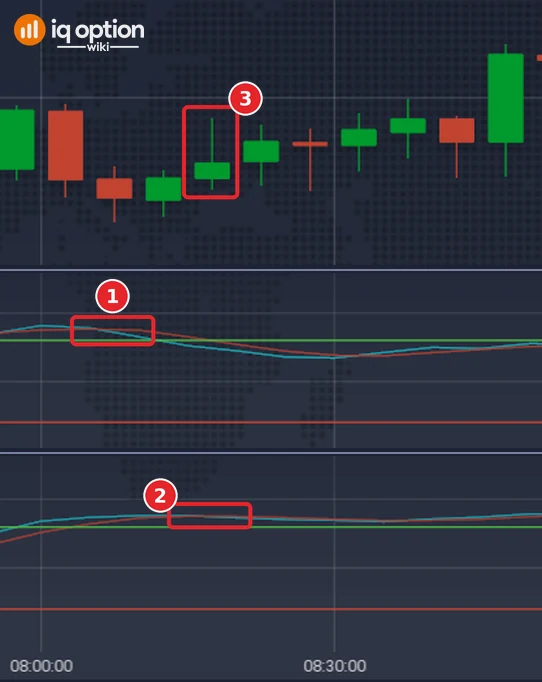
On 29 September 2026 the rule gave a Lower signal on the candle that opened at 11:15 UTC (08:15 on the platform clock, UTC-3). On the chart, the fast %K crossed below the fast %D above the 80 line (1) two candles before it, at 11:05 UTC (fast %K 82.6 against %D 87.5), and the slow %K crossed below the slow %D, also above 80, on the signal candle (2): %K 86.7 against %D 87.7, so the lines are only just apart. The entry is the close of that candle (3), 1.134695. Four candles later, at 11:35 UTC, the price was 1.1349, above the entry, so the Lower option would have lost. The next Lower signal of the series, at 18:45 UTC, also lost; the examples are the first signals in time order, not selected by outcome.
Tested on IQ Option: 29 September to 5 October 2026
| Asset and candles | EUR/USD (binary), 5-minute candles recorded from IQ Option’s Practice traderoom, from 29 September 2026 01:55 UTC to 5 October 2026 17:05 UTC: 1,334 candles in two unbroken runs (the weekend gap separates them). |
|---|---|
| Rule tested | Stochastic from candle highs and lows (as the platform’s chart draws it). Fast Stochastic: %K period 8, smoothing 5, %D period 3. Slow Stochastic: 17, 7, 3. Higher: the slow %K crosses above the slow %D at or below 20, and the fast %K crossed above the fast %D at or below 20 on the same candle or in the previous four. Lower: the mirror at or above 80. Entry at the close of the signal candle, expiry four candles. |
| Signals | 59 signals: 34 Higher and 25 Lower. They come from a Python version of the rule run on the recorded candles, not on the platform. Our script library’s Double Stochastic script calculates the Stochastic from closes, so it does not match the platform’s chart and counts 71 signals. |
| Outcomes | 23 wins, 34 losses, 2 ties. Win rate of decided trades: 40.4% (23 of 57). Net result per dollar staked at an 85% payout: -$0.24 (a tie returns the stake). |
| Break-even | A trade has to win more than 1 / (1 + payout) of the time: about 54.1% at an 85% payout, 53.5% at 87%. Payout during the test: assumed to be 85%, because the replay placed no orders (IQ Option showed 91% for EUR/USD binary options expiring within about ten minutes on 5 October 2026 and 82% to 91% on options on 2 to 4 October; at 91% the break-even rate is 52.4%). |
This is a replay of one rule on candles recorded from IQ Option’s Practice traderoom, not an order placed on the platform. It used no real money and placed no order, so the result says nothing about what the rule will do next. Signals are not de-duplicated: neighbouring candles can each give a trade at the same level, and the trades overlap in time. The replay scores each trade from the close of the signal candle to the close at expiry, counts an equal close as a tie and ignores spread and delays. The Stochastic is calculated from candle highs and lows, which matched the platform’s chart at the candles we checked (a calculation from closes did not). A short test predicts nothing; IQ Option’s blog on backtesting says most strategies need dozens, often hundreds, of trades before the results mean anything. Nothing here is a promise of profit or of any win rate.
Pros and cons of the Double Stochastic strategy
| Pros | Cons |
|---|---|
| The rule is mechanical: both oscillators must cross in the same zone, so it can be written down and tested. | The slow Stochastic is heavily smoothed. It reaches the zones rarely, so entries are few and the confirmation arrives late. |
| Two settings ask the same question on two time scales before an entry is marked. | In a strong trend both oscillators can stay in a zone and cross back several times without a lasting reversal. |
| It can be tried on the Practice balance without risking money. | In our replay on 1,334 five-minute EUR/USD candles it fired 59 times and won 23 of 57 decided trades (40.4%), below the 54.1% break-even rate. |
An alternative dual-stochastic setup from IQ Option’s blog
IQ Option’s blog has its own article, “Trading with Dual Stochastic Strategy” (updated 14 September 2026). It also uses two Stochastic oscillators, but with other settings and a different idea. This section describes it as an alternative to the setup above, not as a replacement, and it was not part of our test.
The blog sets the levels of both oscillators to 80 and 20. The first Stochastic uses Period K 21, Smoothing 10 and Period D 4. With the first one active, you add the second and change Period K, Smoothing and Period D to 5, 2 and 2.
| Setting | First Stochastic | Second Stochastic |
|---|---|---|
| Period K | 21 | 5 |
| Smoothing | 10 | 2 |
| Period D | 4 | 2 |
| Overbought and oversold levels | 80 and 20 | 80 and 20 |
The blog’s trade idea is a trend continuation, not a reversal. Traders look for a strong trend and then wait for the two oscillators to sit at opposite extremes, one in the overbought zone and the other in the oversold zone. When that happens, the blog says, the trend can be expected to keep moving in the direction seen before. A 20-period EMA can serve as a confirmation: in a strong trend the candles stay on one side of the EMA, and a candle that first crosses to the other side and then retraces back gives the confirmation. The blog adds that the strategy can benefit from support and resistance levels, round numbers, Fibonacci retracement and candlestick patterns, and that no algorithm is 100% accurate.
| What differs | The setup in this guide | The setup in IQ Option’s blog |
|---|---|---|
| Settings (%K period, smoothing, %D period) | Fast 8, 5, 3 and slow 17, 7, 3 | 21, 10, 4 and 5, 2, 2 |
| What it looks for | Both oscillators crossing in the same extreme zone | One oscillator overbought and the other oversold, in a strong trend |
| Expected move | Reversal | Trend continuation |
| Extra filter | None | 20-period EMA |
| Source | IQ Option Wiki article and script library | IQ Option blog, updated 14 September 2026 |
Common mistakes with two Stochastics
- Entering on the fast cross alone. The guide treats it as a hint and waits for the slow Stochastic.
- Reading 80 or 20 as an automatic signal. IQ Option’s blog says a Stochastic above 80 is not an automatic sell and one below 20 is not an automatic buy; in a strong trend it can stay there for a long time. Our script library’s notes add that both oscillators can then cross back several times without a lasting reversal.
- Mixing up the boxes. The numbers 8, 5, 3 and 17, 7, 3 list the %K period, the smoothing and the %D period, in that order, as the chart labels do. Match each number to its label.
- Giving both oscillators the same colours. Two panels that look alike are easy to confuse. Change the colours of the second one.
- Looking for a stop loss on a binary option. There is none; the option closes at expiry.
- Expecting many entries. The slow Stochastic reaches the extreme zones rarely, so the rule fires rarely.
Summary
The Stochastic oscillator shows where the latest close sits inside its recent range. A cross of %K and %D in the oversold or overbought zone shows that short-term momentum has changed; it does not prove that the trend has reversed. The Double Stochastic strategy asks a fast and a slow Stochastic to cross in the same zone before it marks an entry, and IQ Option’s blog describes a different dual setup that looks for opposite extremes in a strong trend. Try either one on the Practice balance, count your own results over many trades and compare them with the break-even win rate before you risk money.
Related guides
- Stochastic oscillator settings and reversals on IQ Option
- Stochastic with support and resistance
- Stochastic and Parabolic SAR strategy
- RSI, Stochastic and EMA 200 strategy
- IQ Option scripts library, with a Double Stochastic script that marks this rule on your chart
- All indicator guides and all strategy guides
Frequently Asked Questions
Q: What are the key components of the Double Stochastic strategy?
A: Two Stochastic oscillators with different settings: a fast one (%K period 8, smoothing 5, %D period 3) that gives the first cross, and a slow one (17, 7, 3) that must confirm it. Both use the levels 80 and 20.
Q: What settings does the Double Stochastic strategy use?
A: Fast: %K period 8, smoothing 5, %D period 3. Slow: %K period 17, smoothing 7, %D period 3.
Q: What are the default Stochastic settings on IQ Option?
A: On 8 October 2026 the dialog showed Period K 13, Smoothing 3, Period D 3, Overbought 80 and Oversold 20, and the chart label read “Stoch (13, 3, 3)”. The Quadcode repository lists a %K period of 14, so read the dialog on your own platform. Step 3 above shows it.
Q: What is the formula for the Stochastic oscillator?
A: Raw %K = 100 × (Close − Low N) ÷ (High N − Low N). %K is a simple moving average of raw %K over the smoothing period, and %D is a simple moving average of %K over the %D period.
Q: Can the Double Stochastic strategy be used on different time frames?
A: Other time frames can be tried. Our script library lists 5-minute to 15-minute candles. The tested box covers 5-minute candles only.
Q: How long should I keep a position open?
A: The replay holds four candles, roughly 20 minutes on a 5-minute chart. On 5 October 2026 the Expiration list for EUR/USD binary offered an expiry for every minute for about ten minutes ahead, then at the quarter hours and at the end of the day, week and month, so you pick a clock time, not a length of time: an option of exactly 20 minutes exists only when the entry time plus 20 minutes lands on a listed mark, such as a quarter hour. The replay assumes exactly four candles.
Q: Does a second Stochastic make the signals more accurate?
A: We cannot say. The second oscillator adds a condition, so it produces fewer entries; whether those entries do better is what the tested box measures on the candles recorded for this page. IQ Option’s blog on its own dual setup says no algorithm is 100% accurate and that complex systems should be tested before you adopt them.
Q: What win rate does a trade need to break even?
A: A binary option pays a fixed percentage. At an 85% payout a trade needs to win more than 54% of the time to break even (1 ÷ 1.85); at 87% the figure is 53.5%. Read the payout next to the asset when you trade.
Q: Is the Double Stochastic strategy suitable for beginners?
A: It has more parts than a single indicator: two sets of settings and a rule with several conditions. Try it on the Practice balance first.
Q: What does IQ Option’s own dual-stochastic strategy look like?
A: It uses the settings 21, 10, 4 and 5, 2, 2 (Period K, Smoothing, Period D) with a 20-period EMA, and it looks for the two oscillators at opposite extremes in a strong trend. See the alternative section above.
Q: Can I mark the signals with a script?
A: The IQ Option scripts library has a Double Stochastic script that marks the rule above with HIGHER and LOWER triangles. Import it as shown in our scripts guide. The script calculates the Stochastic from closing prices, while the platform’s chart uses highs and lows, so its triangles can differ from the chart’s crosses by a candle or more.

