Last updated: 8 October 2026. The screenshots were recorded on 8 October 2026 on an IQ Option Practice account registered in Brazil, on an EUR/USD binary chart, and no order was placed. Times are the traderoom clock, which is UTC minus three hours. The readings in the tested box come from the screenshots of one 57-minute recording and say nothing about other hours or other assets. Nothing here is a promise of profit.
The Trader Sentiment widget is a bar at the left edge of the chart that shows how IQ Option’s traders are split between Higher and Lower on the asset you are looking at. The platform describes it as “the current Higher/Lower ratio”. This guide shows where to switch it on, how to read it and what it did during one recording: the Higher share ranged from 22% to 67%, and its larger side matched the direction of the next five minutes in 9 of 18 readings, as often as a coin toss would.
Quick answer
- What it is: a bar at the left edge of the chart with HIGHER and a percentage at the top (green) and LOWER and a percentage at the bottom (red); the platform calls it “the current Higher/Lower ratio”.
- Where to turn it on: the indicators button at the bottom left of the chart, the Widgets tab, Trader Sentiment, Enabled or Disabled. The pane says “For option positions only”.
- How to read it: Higher above 50% means more traders chose Higher than Lower at that moment. The platform’s example: a widget that is 70% red means 70% of traders went Lower and 30% went Higher.
- It changes fast: in our recording Higher read 29% at 11:36:35 and 42% at 11:37:38.
- Tested: over 38 readings of one 57-minute recording Higher ranged from 22% to 67% (median 52%); the larger side matched the direction of the next 5 minutes in 9 of 18 readings. Break-even is 54.1% at an 85% payout.
What does the Trader Sentiment widget show?
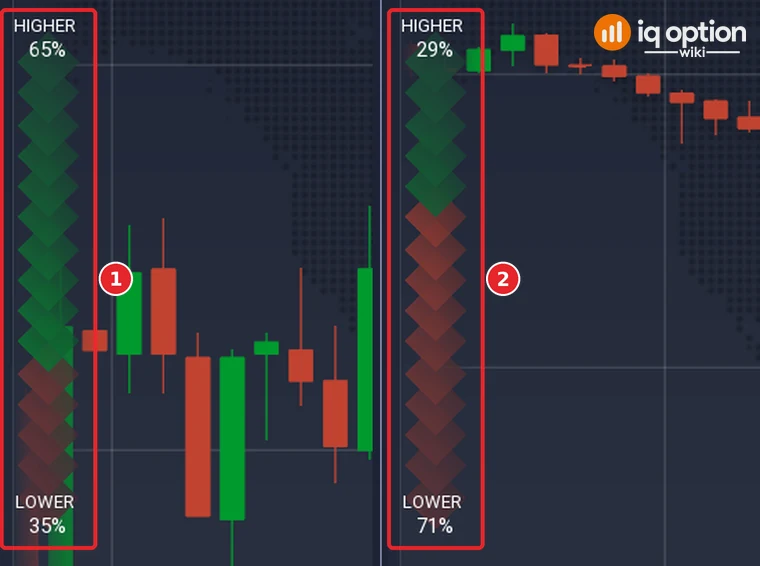
The widget sits at the left edge of the chart. At the top it reads HIGHER and a percentage, at the bottom LOWER and a percentage, and the two add up to 100%. Between them runs a stripe of diamonds, green above and red below, and the size of each colour follows its percentage: in the first reading of the picture below, Higher is 65% and the green part is the larger; in the second, Higher is 29% and the red part is the larger.
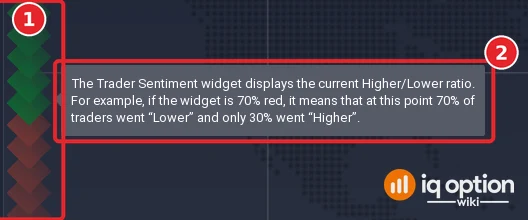
The platform explains the widget in two places. Point at it on the chart and a tooltip opens: “The Trader Sentiment widget displays the current Higher/Lower ratio. For example, if the widget is 70% red, it means that at this point 70% of traders went “Lower” and only 30% went “Higher”.”
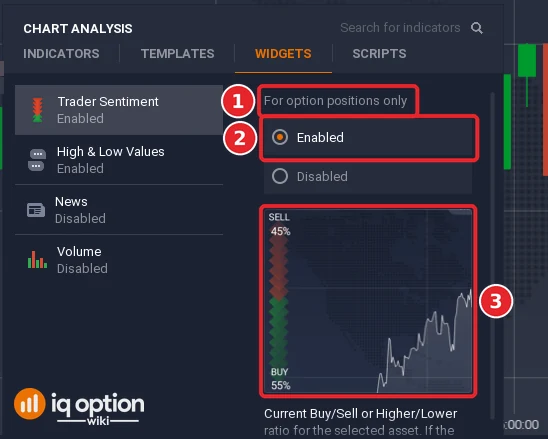
The pane of the widget in Chart analysis (below) says the same in other words: “Current Buy/Sell or Higher/Lower ratio for the selected asset.” It also carries the note “For option positions only”. The preview in the pane is labelled SELL (red, at the top) and BUY (green, at the bottom), while the widget on our binary chart is labelled HIGHER (green, at the top) and LOWER (red, at the bottom); we did not open the widget on a margin chart to see what it shows there. On our chart the widget gives percentages only: no number of traders and no stakes.
How do you turn the Trader Sentiment widget on?
These steps use the web traderoom on a Practice balance. The numbers in each picture match the numbers in the text.
Step 1: Open Chart analysis
Click the indicators button (1), the wave icon in the chart toolbar at the bottom left of the chart. The Chart analysis panel opens with the tabs Indicators, Templates, Widgets and Scripts.

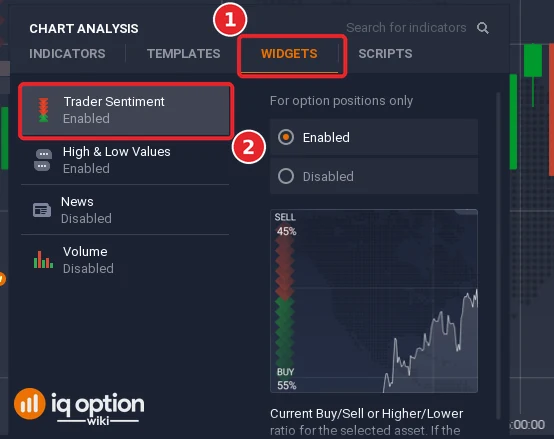
Step 2: Open the Widgets tab and choose Trader Sentiment
Click the Widgets tab (1). The list under it shows four widgets: Trader Sentiment, High & Low Values, News and Volume, each with its state under the name. In our traderoom Trader Sentiment and High & Low Values were Enabled, and News and Volume were Disabled. Click Trader Sentiment (2); its pane opens on the right.
Step 3: Choose Enabled
The pane starts with the note “For option positions only” (1) and the choice Enabled or Disabled (2); Enabled was selected in our traderoom. Under it come the preview of the widget (3) and the text quoted above. Enabled is selected while the widget is on the chart; Disabled is the choice for turning it off.
How do you read the Trader Sentiment widget?
Read the two numbers. Higher above 50% means that more traders have chosen Higher than Lower on this asset at this moment; Lower above 50% means the reverse. The platform’s own example gives the scale: a widget that is 70% red means that 70% of traders went Lower and only 30% went Higher.
Read it as a snapshot. In our recording the share moved quickly: at 11:36:35 the widget read Higher 29%, and at 11:37:38, 63 seconds later, Higher 42%. Over the 38 screenshots in which it could be read, Higher ranged from 22% to 67%, with a median of 52%. We saw no history of earlier readings, only the current ratio, so a number you read now will not be there when you look again in five minutes.
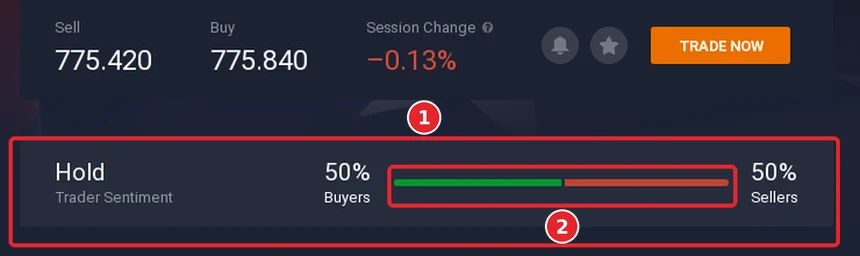
The widget is for options. The Info page of a margin asset (the i button of the asset list) has a Trader Sentiment line of its own, with a verdict and a bar of Buyers and Sellers. On the pages of the Apple stock, gold and the S&P 500 ETF, which we opened between 13:25 and 13:28 on the traderoom clock, it read Hold and 50% Buyers against 50% Sellers every time. We do not know how that line is calculated, and three identical readings give nothing to compare, so we draw no conclusion from it.
Should you trade with the crowd or against it?
Trading with the crowd means taking the side that more traders chose, and trading against it means taking the other side. IQ Option’s blog on market sentiment says, in general terms: “Align sentiment with price and volume”, and, on the put/call ratio, “Interpretation requires context. Extreme readings can indicate turning points rather than trend continuation.” It adds that sentiment should be used “as part of a structured, risk-aware strategy—not in isolation.”
We checked the plain rule on our own readings: if the larger side was Higher, count a win when the price was higher five minutes later, and the mirror for Lower. It matched the direction 9 times in 18 readings (see the tested box). A sample that small cannot tell a coin toss from a rule that works 65% of the time, so we do not recommend trading with the crowd or against it on the widget alone.
Tested on IQ Option: the widget in one 57-minute recording of EUR/USD
| Source | Screenshots of the recording of 8 October 2026, 14:14 to 15:12 UTC (traderoom clock 11:14 to 12:12), EUR/USD in the Binary list on a 5-minute chart, Practice account. Nothing was traded. |
|---|---|
| What was read | The Higher percentage at the top and the Lower percentage at the bottom of the widget, and the clock of the traderoom, from the screenshots that show the chart without a dialog over it: 38 readings (the two percentages added up to 100 in each). Higher ranged from 22% to 67%, median 52%. |
| What was counted | Readings at least 60 seconds after the previous counted one: 18 readings. For each, the price of EUR/USD at the clock time of the screenshot and 5 minutes later, from the recorder’s log of live prices (the last price of the EUR/USD margin quote, used here as a stand-in for the binary quote). |
| Rule | If the larger side was Higher, a win means the price was higher after 5 minutes; if the larger side was Lower, a win means it was lower. None of the 18 counted readings was exactly 50% and none of the prices was unchanged. |
| Result | The larger side matched the next 5 minutes in 9 of 18 readings (50%); the 95% interval of that figure runs from about 29% to 71%. Break-even is about 54.1% at an 85% payout. |
The readings were taken when a screenshot was made for another purpose, not at random times, and the widget keeps no history, so they cannot be repeated. They cover one asset in one hour of one day, and readings a few minutes apart overlap, so they are not independent. The price is a live quote from a log, with no spread. A result of 9 of 18 cannot tell a coin toss from a rule that wins 65% of the time. No profit is promised. If you want to try the idea, write down the percentages with the time on a Practice account and check them against the chart afterwards.
Pros and cons of the Trader Sentiment widget
| Pros | Cons |
|---|---|
| It is part of the platform, sits on the chart and can be switched on or off in Chart analysis. | On our chart it gives percentages only: no number of traders, no stakes and no history of earlier readings. |
| The reading is quick: one glance at the Higher and Lower percentages. | The share moved from 29% to 42% in about a minute in our recording, so a reading goes stale quickly. |
| It shows what other IQ Option traders are doing on the asset. | The pane says it is for option positions only, and the tooltip counts “traders”, which we take to be the platform’s own, not the whole market. |
| It stays on the chart next to the price and the indicators you already use. | In our 18 readings the larger side matched the next five minutes as often as it missed. |
Common mistakes
- Treating the percentage as a signal. It is a split of other traders’ choices. Our 18 readings do not show that the larger side is right more often than wrong.
- Reading it once and trading later. The Higher share moved by 13 points in 63 seconds in our recording.
- Expecting it on every kind of trade. The pane says “For option positions only”. We looked at it on a binary chart only.
- Forgetting the payout. At an 85% payout an option has to win about 54.1% of the time to break even, and at the 90% that the order panel showed during our recording, about 52.6%.
Related guides
- How to read trading volume on IQ Option, another widget from the same tab
- Five entry signals on IQ Option
- Support and resistance lines on IQ Option
- All indicator guides and all strategy guides
Frequently Asked Questions
Q: What is the Trader Sentiment widget on IQ Option?
A: A bar at the left edge of the chart that shows the current Higher/Lower ratio of IQ Option’s traders on the selected asset, as two percentages that add up to 100%.
Q: Where do I find the widget?
A: Open Chart analysis from the indicators button at the bottom left of the chart, click the Widgets tab and choose Trader Sentiment. Its pane has the Enabled and Disabled choice.
Q: What does a widget that is 70% red mean?
A: According to the platform’s tooltip, at that moment 70% of traders went “Lower” and only 30% went “Higher”.
Q: Does the widget work for every asset?
A: The pane says “For option positions only”. We looked at it on EUR/USD in the binary list and did not test other assets.
Q: Does trading with the larger side win?
A: Not in our recording: the larger side matched the direction of the next five minutes in 9 of 18 readings. That is too few readings to prove or disprove a rule, and the sample covers one asset in one hour.
Q: Can I turn the widget off?
A: The pane offers a Disabled choice next to Enabled. The row in the Widgets list shows the current state under the widget’s name.