
Last updated: 8 October 2026. Every screenshot below was recorded on 5 and 8 October 2026 (the Chart analysis panel in Step 4 is from 5 October) on an IQ Option Practice account registered in Brazil, on 5-minute EUR/USD candles; the candles in the example pictures are from 29 and 30 September and 5 October 2026, scrolled back on the same chart, and the times in them are the traderoom clock (UTC-3). We placed no real-money trade. The tested box shows what a mechanical version of each of the five entry signals did on the candles of that week; it says nothing about what the signals will do next.
A trade entry signal is a condition on the chart that tells you when to open a trade and in which direction. This guide covers five of them, all read on 5-minute candles and all traded with a 15-minute option: two bullish pin bars on support, a close below support, a hammer on support with a rising RSI, a doji on support with a rising RSI followed by a bullish candle, and a dragonfly doji after a strong bearish candle followed by a bullish candle. Each signal is written as a rule so that it can be repeated and counted. None of the five is a promise: a signal only says that a condition appeared on the chart.
Quick answer
- Chart: 5-minute candlesticks, a support line and the RSI (14).
- Signals: two bullish pin bars at support; a close below support; a hammer at support with a rising RSI; a doji at support with a rising RSI, then a bullish candle; a dragonfly doji after a solid bearish candle, then a bullish candle.
- Trade: a 15-minute option (three candles), opened at the close of the signal candle. A binary option has no stop loss or take profit.
- Test result: in a replay on EUR/USD 5-minute candles from 29 September to 5 October 2026 the five written signals fired 46 times and won 52.2% of their 46 trades, below the 54.1% break-even rate at an 85% payout. Of the 46, 38 were the break of support (21 won, 55.3%), and the fifth signal never appeared in the week.
- Break-even: at an 85% payout a trade has to win about 54.1% of the time (1 ÷ 1.85); at 87%, 53.5%. With 46 trades the win rate has a margin of error of about ±7 points (one standard error), so 52.2% cannot be told from break-even.
How long to hold position and exit points
Before you look for a signal, decide three things: the signal, how long the trade lasts, and how it ends. For an option, the signal is the entry rule, the duration is the expiry you choose, and the end is automatic: a binary option has no stop loss and no take profit, and it closes at its expiry time. IQ Option’s blog also says an option can be sold before expiry with the Sell button. On a CFD (margin) trade, which has no expiry, the exit is a take profit or a stop loss that you set yourself.
This guide trades options on EUR/USD with the candlestick chart on 5-minute candles, and every trade lasts 15 minutes, which is three candles. The tests below use an 85% payout, a round figure inside the 82% to 91% that options showed between 2 and 4 October 2026: at 85%, a trade has to win more than 54% of the time to break even (1 / 1.85); at 87%, about 53.5%; at the 93% that EUR/USD showed on 8 October, more than 51.8%. The payout changes by asset and over time, so work the break-even rate out for the payout you see. The steps below set the chart up on a Practice balance, which starts at $10,000, and the numbers in each screenshot match the numbers in the text.
How to set up the chart for the five signals
Step 1: Choose the asset
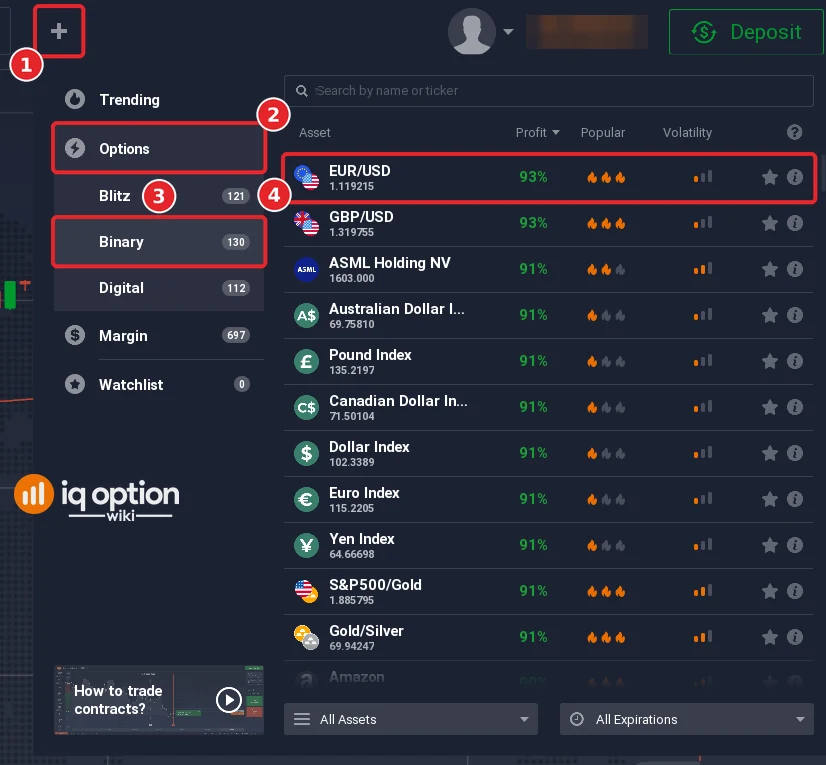
Click + in the top bar (1), open Options (2), choose Binary (3) and pick EUR/USD from the list (4). The list shows each asset’s payout: on 8 October 2026 EUR/USD showed 93%. Read it next to the asset you choose, because it changes by asset and over time.
Step 2: Set 5-minute candles
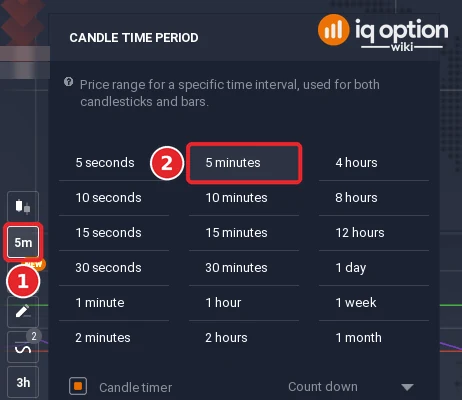
The chart toolbar sits at the bottom left of the chart. Check that the chart type is candlesticks, then click the candle time period button (1) and choose the 5-minute period (2). Each candle then covers five minutes, which is what the five signals below are read on.
Step 3: Draw a support line
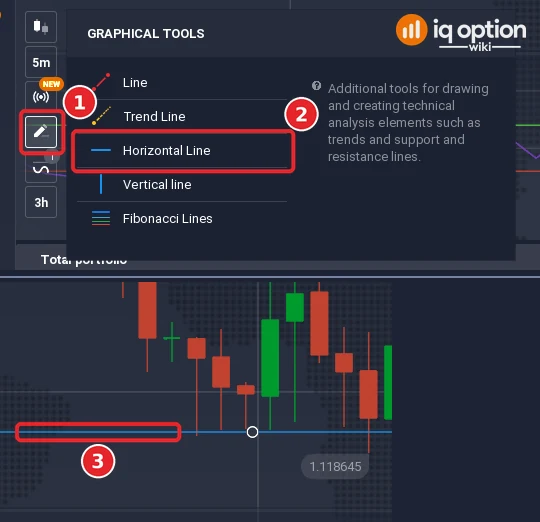
Click the drawing tools button in the toolbar (1), choose Horizontal Line (2) and place it on a price where several lows have stopped near the same level (3). IQ Option’s blog describes support as a price area where buyers have previously stepped in hard enough to stop a decline, and it says support and resistance are zones, not exact lines. The tests below replace your eye with a number: support is the lowest low of the previous 50 candles.
Step 4: Add the RSI
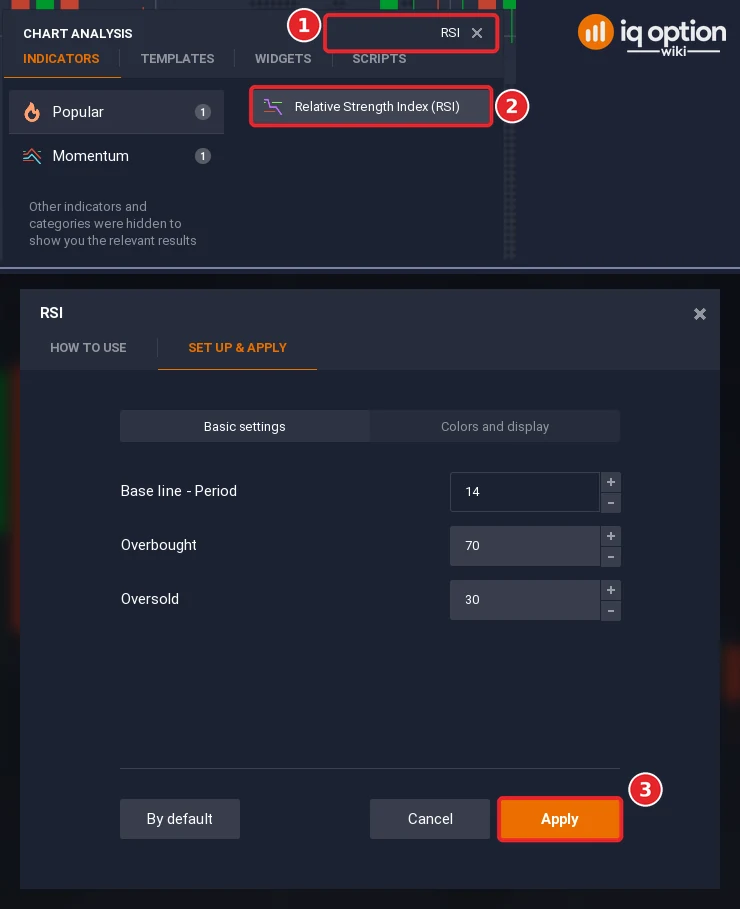
Signals 3 and 4 use the RSI as a second reading. Click the indicators button (1), the wave icon at the bottom left of the chart, to open the Chart analysis panel.

Search for RSI in the panel (1) and open it (2). On the Set up & apply tab, the Basic settings show the period, 14 by default, and the overbought and oversold levels, 70 and 30. Click Apply (3). The RSI opens in a separate panel under the price.
Step 5: Choose a 15-minute expiry
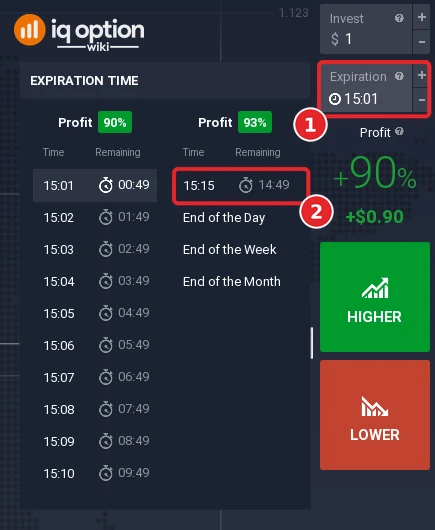
On the right-hand panel, open the Expiration box (1). The list shows clock times with the time remaining beside each. The first column runs minute by minute for about ten minutes, and the second holds the quarter-hour marks, followed by End of the Day, End of the Week and End of the Month. Open the list right after the signal candle has closed and pick the quarter-hour mark that is closest to 15 minutes away (2). In the picture, taken at 15:00:11 on the platform clock, eleven seconds after a 5-minute candle closed on a quarter hour, the first quarter-hour mark is 15:15 with 14 minutes 49 seconds remaining, so it is a 15-minute option; the minute-by-minute column starts at 15:01 with 49 seconds remaining. The remaining time shrinks every second: after a candle that closes at 15:05 the same 15:15 mark is only about ten minutes away, so look at the remaining time before you click. A trade bought late in a candle expires sooner than the 15 minutes you planned, and, according to IQ Option’s Help, the solid red line on the chart marks the expiry of an open trade whatever the candles are doing.
The five entry signals
Each signal below is written as a rule with numbers. Where a term such as “strong support” or “a hammer” has no fixed definition, the reading used here is written out under the signal, so another reader can repeat it, choose a different one and get a different result.
First entry point: two bullish pin bars with their lows on support
A pin bar has a small body and a long shadow on one side. A bullish one has its long shadow below the body, and its low reaches the support line. Two of them in a row at the same support show buyers stopping the decline twice. Read as a rule: two pin bars within six candles of each other, each with a lower shadow at least twice its body and at least 60% of its range, both with their low at or just above support. Open a 15-minute Higher option at the close of the second pin bar.
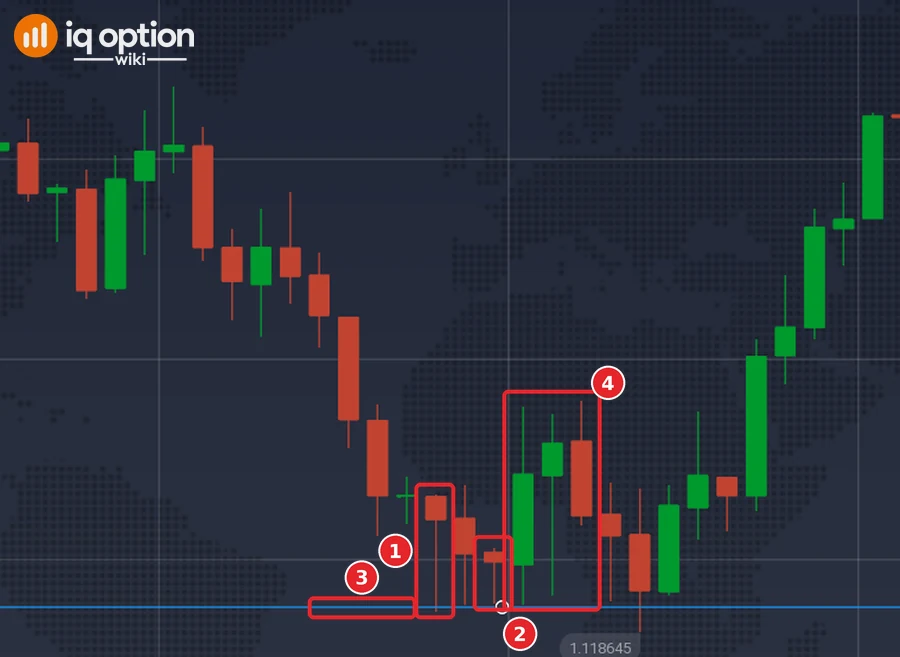
On 5 October 2026 the 10:45 and 10:55 candles both had a long lower shadow (4.5 and 2.1 pips, on bodies of 1.2 and 0.5 pip), and both lows (1.11875 and 1.11878) sat on the support line at 1.11875, the lowest low of the previous 50 candles. The rule fired at the close of the 10:55 candle, at 11:00 and 1.11899. A 15-minute Higher option ended at 11:15 with the price at 1.11922, 2.3 pips higher: a win, worth $0.85 on each $1 at an 85% payout. The rule fired once more, at the close of the 11:05 candle (1.11958), and that option lost: 1.11884 at expiry.
Second entry point: Price breaks the support
Support does not always hold. The entry for a break comes when a candle closes below the support line. Read as a rule: a candle closes below the lowest low of the previous 50 candles, and the previous candle did not. Open a 15-minute Lower option at that close.
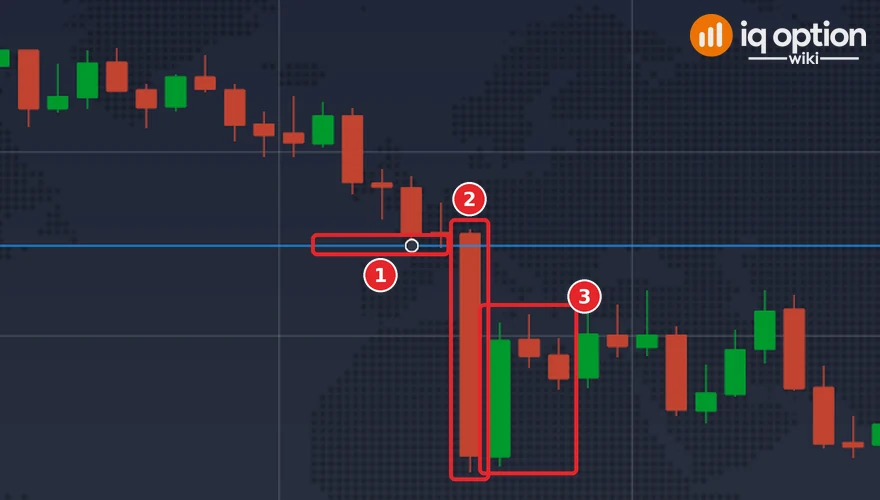
On 29 September 2026 the lowest low of the previous 50 candles was 1.13549. The 04:30 candle opened at 1.13556 and closed at 1.13435, 11.4 pips under that line, so the rule opened a Lower option at 04:35. When it ended, at 04:50, the price was 1.13477, 4.2 pips above the entry: a loss. This signal, the first close below support, is the one that fired 38 times in the week we replayed, 21 wins and 17 losses.
Third entry point: Hammer develops on support and RSI rising
IQ Option’s blog describes a hammer as a small body with a lower shadow at least twice the body, after a downtrend, and says the colour does not matter. It suggests a bounce, if the next candle confirms it. Here the confirmation is the RSI: the hammer’s low touches support and the RSI is higher than on the previous candle. Open a 15-minute Higher option at the close of the hammer.
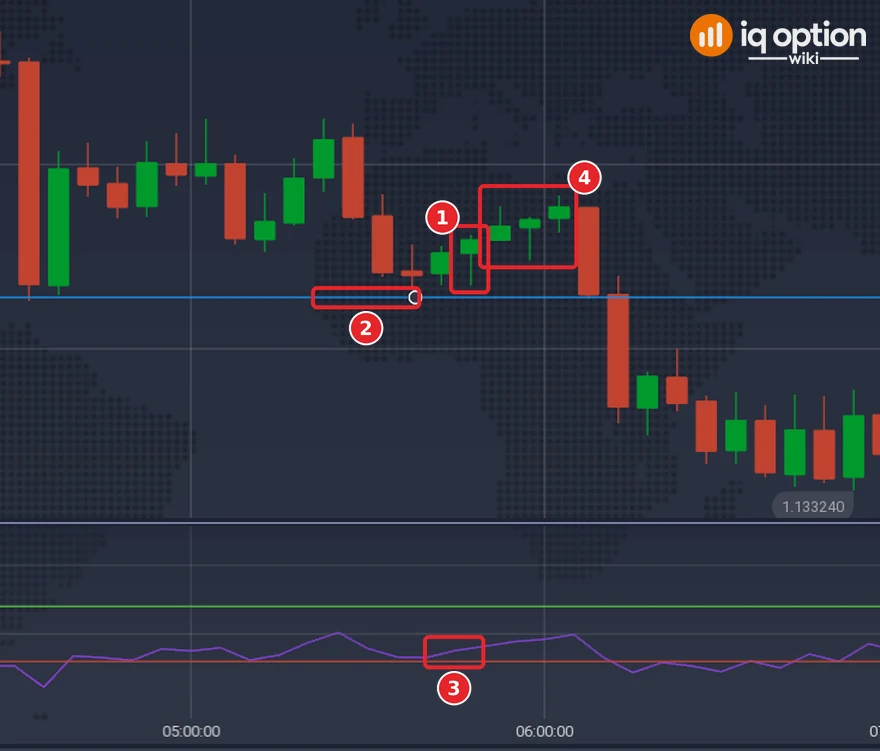
The 05:45 candle of 29 September 2026 opened at 1.13452 and closed at 1.13459 after a low of 1.13435: a body of 0.7 pip and a lower shadow of 1.7 pips, with its low 0.8 pip above the support of 1.13427. The RSI(14) of our replay read 41.2, up from 38.2 on the previous candle. The rule opened a Higher option at the close, 05:50, at 1.13459. It ended at 06:05 at 1.13477, 1.8 pips higher: a win.
Fourth entry point: Doji forms on support and RSI rising
A doji has its open and close very close together. IQ Option’s blog says it shows indecision and is not always a reversal, which is why this signal waits for the next candle. Read as a rule: a doji whose low touches support while the RSI is rising, followed by a bullish candle. Open a 15-minute Higher option at the close of that bullish candle.
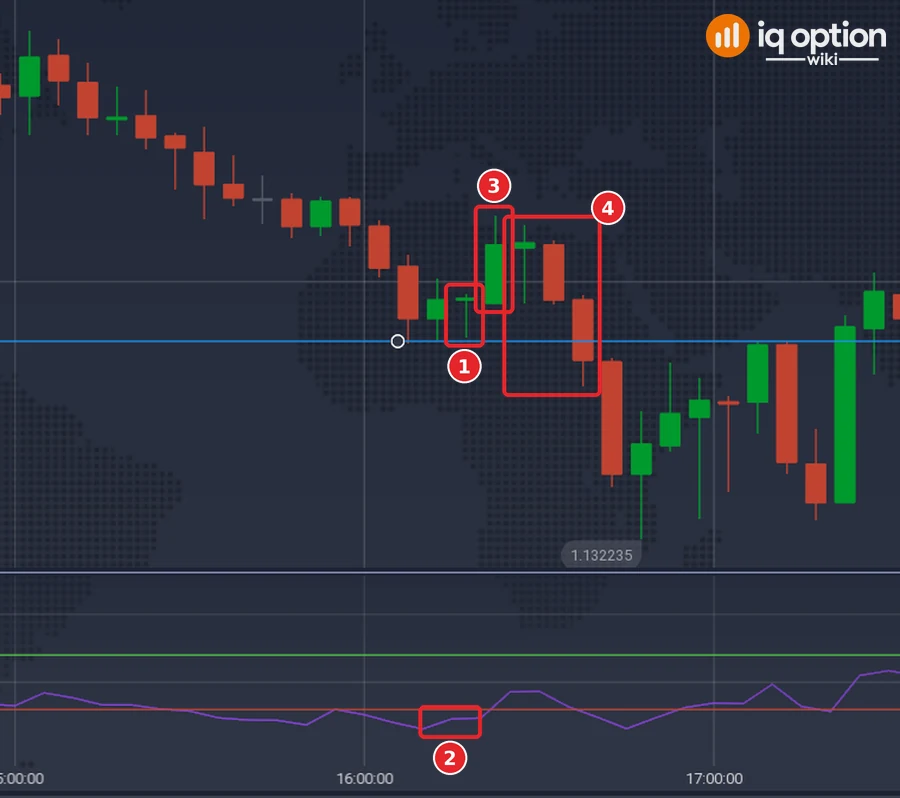
On 30 September 2026 the 16:15 candle opened and closed at 1.13295, a doji with a low of 1.13284, 0.2 pip above the support line at 1.13282. The RSI(14) of our replay read 23.9, up from 23.2 on the previous candle. The next candle, 16:20, was bullish (1.13294 to 1.13311), so the rule opened a Higher option at 16:25 at 1.13311. It ended at 16:40 at 1.13277, 3.4 pips lower: a loss. Both signals of this kind in the week we replayed lost.
Fifth entry point: a dragonfly doji after a solid bearish candle
A dragonfly doji is a doji with a long lower shadow and almost no upper one. After a solid bearish candle it can mean that sellers could not hold the lows within that candle, but, as with the doji above, one candle is not a trade: the signal waits for the next candle. Read as a rule: a bearish candle with a body of at least 70% of its range, then a dragonfly doji, then a bullish candle. Open a 15-minute Higher option at the close of the bullish candle.
The week of candles we replayed held no instance of this signal, so there is no example picture for it. The test counts it as zero signals, which says nothing for or against the rule.
Tested on IQ Option: EUR/USD candles of 29 September to 5 October 2026
| Asset and candles | EUR/USD (binary), 5-minute candles recorded from IQ Option’s Practice traderoom: 1,334 candles in two stretches without gaps, 29 September 01:55 (open of the first candle) to 2 October 21:00 UTC (close of the last candle; 1,093 candles in this stretch) and 4 October 21:00 to 5 October 17:05 UTC (241 candles). Signals are counted from the 66th candle of each stretch (50 candles for the support, plus the RSI warm-up). The replay places no orders and uses the logged prices. |
|---|---|
| Rules tested | The five signals as written above, with support set as the lowest low of the previous 50 candles (a low within 0.25 of the 14-period average true range counts as touching it), the RSI(14) as rising when it is higher than on the previous candle, and a 15-minute expiry measured as three candles from the close of the signal candle. |
| Signals | 46 signals: signal 1 twice, signal 2 thirty-eight times, signal 3 four times, signal 4 twice and signal 5 not at all. Each signal is its own trade, and signals can overlap in time, so the trades are not independent. |
| Outcomes | 24 won, 22 lost, none refunded: 52.2% of the 46 trades, a net of -$0.035 per $1 staked at an 85% payout. By signal: 1: 1 won, 1 lost; 2: 21 won, 17 lost (55.3%); 3: 2 won, 2 lost; 4: 0 won, 2 lost; 5: none in the week. |
| Break-even | At an 85% payout a trade has to win more than 54% of the time (1 / 1.85); at 87%, 53.5%. |
The numbers come from replaying candles recorded from IQ Option’s Practice traderoom: no order was placed, each trade is scored at its expiry from the logged candle closes, with no spread, at an 85% payout, and the RSI is the platform’s EMA-smoothed RSI. A short test proves nothing about the future: it covers one asset over a short stretch of candles, a signal that did well in it could lose tomorrow, and one that did badly could do better. A hand-drawn support line would give other signals than the numeric stand-in used here. No profit or win rate is promised. Compare the win rate with the break-even rate above, and repeat the test on your own Practice balance before you risk money.
Summary of the 5 trade entry points
| Signal | Condition on the chart | Direction |
|---|---|---|
| 1 | Two bullish pin bars with lows at support | Higher |
| 2 | A candle closes below support | Lower |
| 3 | A hammer at support while the RSI rises | Higher |
| 4 | A doji at support while the RSI rises, then a bullish candle | Higher |
| 5 | A dragonfly doji after a solid bearish candle, then a bullish candle | Higher |
Four of the five signals are Higher entries. The only Lower signal is a break of support; no mirror rules for resistance were written, so none was tested.
Which indicator does this guide use?
The signals are mostly chart analysis with candles and a support line. The RSI is the only indicator, and it is used in signals 3 and 4 as a second reading. IQ Option’s blog describes the RSI as an indicator that is overbought above 70 and oversold below 30 in its standard setting, and says divergence, when price moves and the RSI does not confirm it, can signal a shift. No source we read says the RSI is the most useful indicator on the platform. Our RSI guide covers the settings.
Pros and Cons of the five entry signals
| Pros | Cons |
|---|---|
| Each signal is a written condition, so you can count how often it appears and how often it wins. | The conditions depend on how you draw support, and two traders can draw different lines. |
| They use the candles on the chart, plus the RSI in two of them. | IQ Option’s blog says candle patterns on their own may be misleading and recommends confirming them. |
| You can rehearse them on a Practice balance at no cost. | A binary option pays a fixed percentage, so a rule has to win more than 54% of the time at an 85% payout to break even. |
| A 15-minute option leaves time to read the chart before the next candle. | The expiry list shows clock times, so a late click shortens the trade. |
Where can I find entry signals for binary options?
Entry signals are not delivered to you: you read them from the chart, as in the five above, or you mark them with an indicator. The site’s scripts library holds readable scripts that mark Higher or Lower setups on completed candles, each with its rule written out. A mark on the chart is still only a condition that appeared, not a prediction. Practise on the Practice balance, write down every trade and compare your win rate over a few hundred trades with the break-even rate for the payout you actually get before you risk money.
Troubleshooting and common mistakes
- The support line moves between traders. Support is a zone. Write down the rule you use for it, as the tests here do, and keep it the same from trade to trade.
- You entered before the candle closed. Every signal here is read on a closed candle. A forming candle has no final shape, and a pin bar or a doji can change until the close.
- The trade closed sooner than 15 minutes. The Expiration list shows clock times. Check the time remaining beside the time you click.
- You expected a stop loss. A binary option has none. It closes at the red line, and you can only choose the direction, the amount and the expiry.
- The payout is lower than planned. Recalculate the break-even rate, 1 / (1 + payout), with the figure next to the asset.
Related guides
- Support and resistance on IQ Option
- Pin bar candles and pin bars with support and resistance
- RSI and support and resistance strategy
- Guide to trading candles on IQ Option
- Expiry times on IQ Option and selling options before expiration
- Trading journal
- All indicator guides and all strategy guides
Frequently Asked Questions
Q: How can I improve my ability to identify trade entry signals on IQ Option?
A: Write each signal as a rule, count how often it appears on a Practice chart and keep a trade journal. IQ Option’s blog advises confirming candle patterns with other tools such as support and resistance or an indicator.
Q: Can I rely solely on trade entry signals?
A: No. A signal says that a condition appeared on the chart, not what the price will do next. Decide the amount per trade and the number of trades before you start, and compare your win rate with the break-even rate.
Q: How can I avoid false signals?
A: You cannot remove them. IQ Option’s blog recommends waiting for the next candle or a second tool to confirm a pattern, and the signals here already wait for the close of the pattern or of the candle that follows it. Counting signals and outcomes over many trades shows how often a rule fails.
Q: Are there risks in trading on entry signals?
A: Yes. Every option can lose its whole amount, and at an 85% payout a rule has to win more than 54% of its trades to break even.
Q: What expiry does this guide use?
A: A 15-minute option on 5-minute candles, which is three candles. Pick the expiry time from the Expiration list and check the time remaining.

