
Last updated: 8 October 2026. Every screenshot below was recorded on 5 and 8 October 2026 (the Chart analysis panel in Step 1 is from 5 October) on an IQ Option Practice account registered in Brazil, and nothing was traded with real money. The five example pictures show EUR/USD 5-minute candles from 29 September to 1 October 2026, scrolled back on the same chart; the times in them are the traderoom clock (UTC-3). This guide has no tested box: reading volume is a matter of judgement, not a rule with an entry and an expiry that could be replayed. Nothing here is a promise of profit.
Trading volume is the amount of an asset traded in a period. On IQ Option you switch it on as the volume widget in the Chart analysis panel, and it draws volume bars under the price chart that you compare with the bars just before them: rising volume behind a move means more participation, falling volume means less. IQ Option’s own blog treats volume as a complementary tool to be combined with other analysis, and warns that on forex the volume a retail chart shows may count ticks, or the activity of one data source, instead of all trading.
Quick answer
- What it is: the amount of an asset traded in a period. On forex, IQ Option’s blog says a retail chart’s volume may count ticks or one data source’s activity, not all trading.
- Where it is: indicators button, Chart analysis, Widgets tab, then Volume, set to Enabled. The bars appear under the price chart.
- How to read it: compare each bar with the bars just before it. A move on rising volume has more participation behind it than a move on falling volume.
- Limit: volume questions or confirms a move; it does not call one. IQ Option’s blog says to combine it with other indicators.
- Volume indicators: the Volume list holds four: Accumulation/Distribution, Net Volume, Volume Oscillator and Weis Wave Volume.
What is IQ Option trading volume?
Trading volume measures how much of an instrument has been traded over a specific time. On an exchange it is a count of contracts or shares. IQ Option’s blog lists a Trade Volume widget among its widgets for forex CFD trading and describes it as showing “what amount of the selected currency pair was sold and bought within a certain period of time”. It adds that the higher the volume, the higher the interest in the asset at its current price.
What the number counts depends on the market. Spot forex has no single exchange, and IQ Option’s blog warns that the volume shown on a retail chart “may represent ticks or activity from a particular data source, not all global FX trading”. It suggests treating it as a local measure of activity, not a complete count of everyone who is trading. The widget’s own description in the platform reads: “The Volume shows how much of the selected asset was bought and sold within a given period. High volume indicates strong interest in the asset at its current price, and low volume indicates the opposite.” It does not say whether the bars count ticks, contracts or something else, so this guide does not say either.
What information does trading volume provide?
IQ Option’s blog says that, as a rule, trading volume goes up during a strong trend and down during a flat market: when price keeps moving one way more trades take place, and when participants are unsure activity falls. Volume therefore gives a price move some context. The same blog adds that volume “should not be treated as a decision-making tool” on its own; combined with other indicators, it can help with a decision.
| Price | Volume | Usual reading |
|---|---|---|
| Rising | Rising | The rise has more participation behind it; the uptrend may be getting stronger. |
| Falling | Rising | The fall has more participation behind it; the downtrend may be getting stronger. |
| Rising | Falling | The rise is losing support. IQ Option’s blog calls a rally on shrinking volume bars “exhausted”. |
| Sideways | Falling | Typical of a flat market, according to IQ Option’s blog. |
How to attach the IQ Option trading Volume widget to the chart
These steps use the web traderoom on a Practice balance. The numbers in each screenshot match the numbers in the text.
Step 1: Open Chart analysis
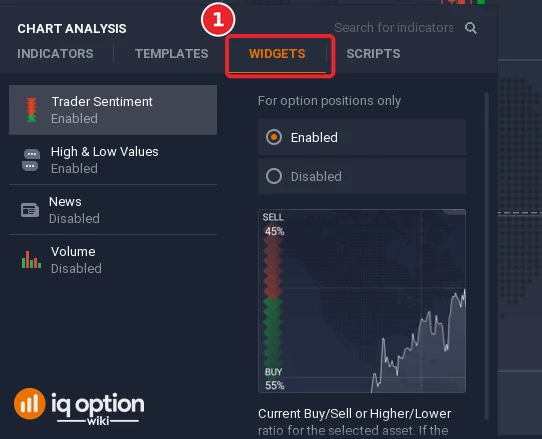
Click the indicators button (1), the wave icon in the chart toolbar at the bottom left of the chart. The Chart analysis panel opens with the tabs Indicators, Templates, Widgets and Scripts.

Step 2: Open the Widgets tab
Click the Widgets tab (1). The list under it shows four widgets: Trader Sentiment, High & Low Values, News and Volume. Each row shows its name and whether it is Enabled or Disabled; Volume starts as Disabled. IQ Option’s blog names Trade Volume, Traders’ Sentiment and High and Low Values among its widgets for forex CFD trading.
Step 3: Switch the volume widget on
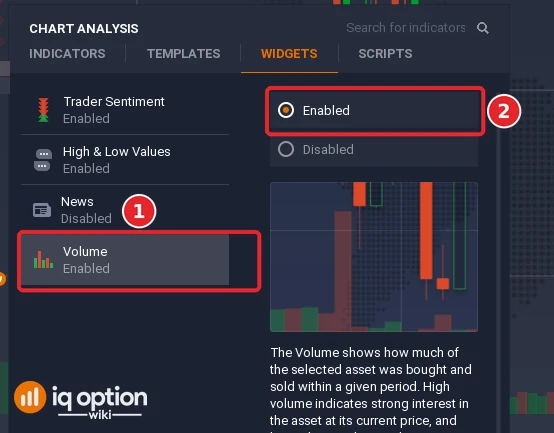
Click the Volume row (1). A pane opens on the right of the list with two options, Enabled and Disabled, a small preview and a short description. Select Enabled (2); the row now reads Enabled. In our recording the widget was listed with EUR/USD on the Binary tab; we did not check other assets.
Step 4: Read the volume bars
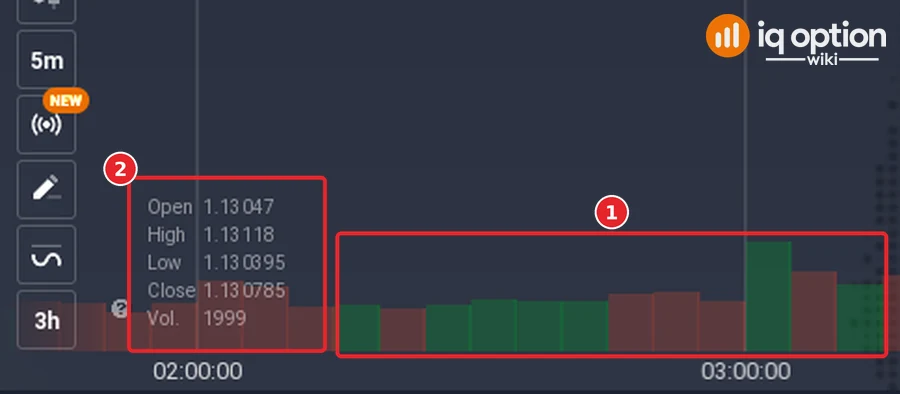
Once the widget is on, the volume bars appear beneath the price chart (1). There is one bar for each candle, in the colour of its candle: green when the candle closed above its open, red when it closed below. Point at a candle and the box at the bottom left of the chart lists its Open, High, Low and Close and a Vol. figure (2); the bar’s height follows that figure. The strip is scaled so that the tallest bar in view reaches its top, so the same volume looks taller or shorter depending on what else is on the screen: compare a bar only with the other bars you can see. To close the panel, press Escape.
Using volume in your trading
The readings below describe what a volume bar looks like next to a price move. They are questions to ask of a chart, not signals, and no success rate is attached to any of them. IQ Option’s blog advises comparing volume with recent activity: “Absolute numbers matter less than change and context.” Judge each bar against the bars just before it, not against volume from months ago.
Using IQ Option trading volume to confirm the trend
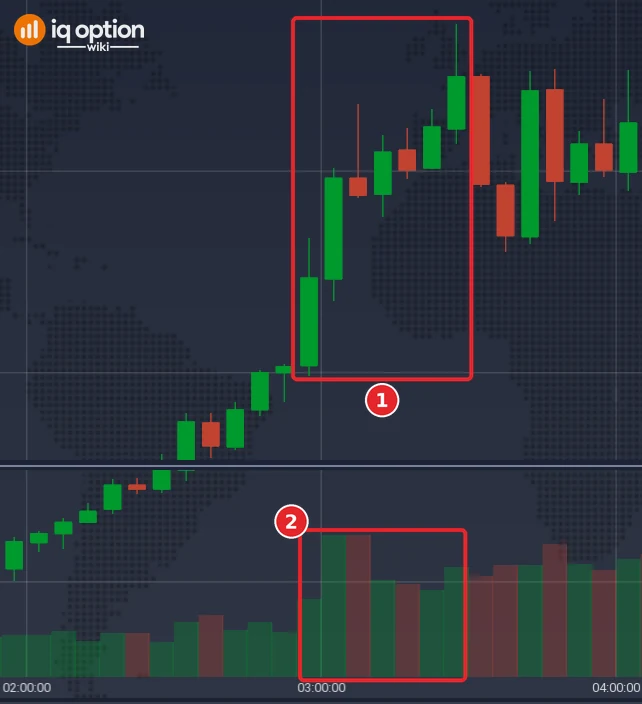
In an uptrend, look for volume bars that grow as price rises; in a downtrend, for bars that grow as price falls. IQ Option’s blog says that increasing volume in the direction of an existing uptrend “may serve as additional confirmation”, and that if volume declines the trend “might be coming to an end”. A move on little volume carries less weight than the same move on large volume. In our example, EUR/USD rose 14.4 pips (1) between the 02:50 close (1.13403) and the 03:25 close (1.13547) on 30 September 2026. The seven bars of that rise (2) averaged 1,359, against 568 from 01:00 to 02:50, and the two tallest, 1,800 and 1,803, came at 03:00 and 03:05. The trend did not carry on: for the next two hours price stayed between 1.1342 and 1.1357.
Using IQ Option trading volume to catch exhaustion moves
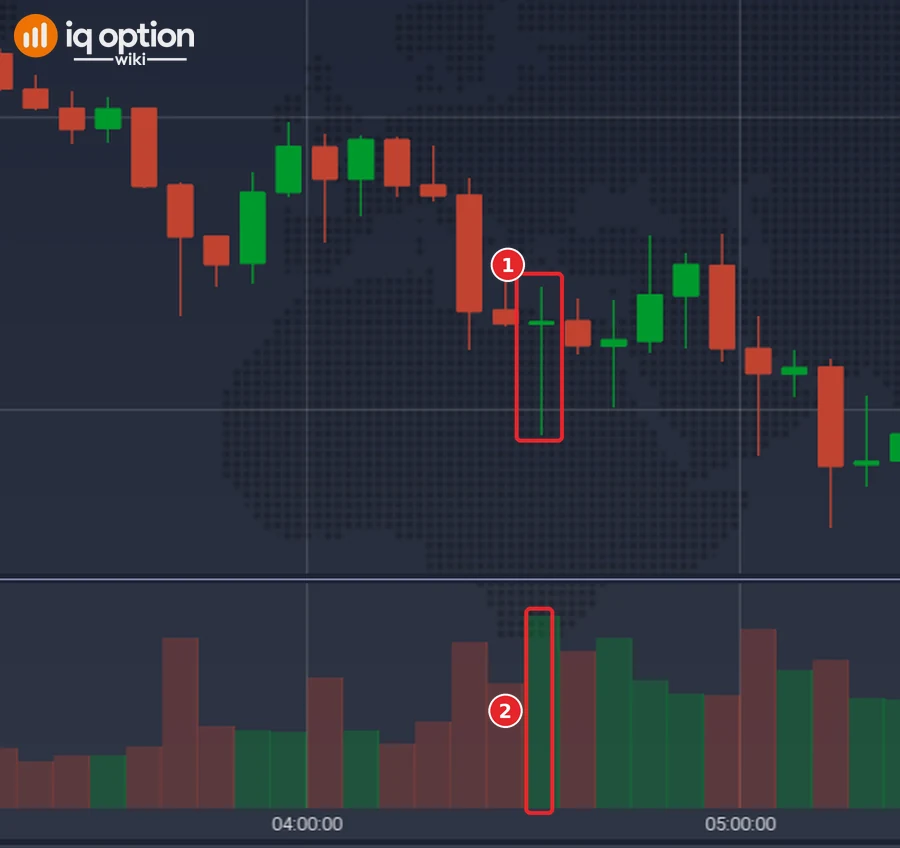
An exhaustion move is a push that runs out of fuel. IQ Option’s blog on reading charts describes one form: price keeps rallying while the volume bars get smaller and smaller, which it reads as buyers running out of steam. It describes another: a candle with a long wick and a huge spike in volume, which shows that one side tried to take control and the other pushed the price back. The mirror images apply to falls. Both describe a chart after the fact; neither tells you that a reversal will follow. Our example is the second form, on EUR/USD on 1 October 2026. The 04:30 candle (1) opened at 1.13058, fell to 1.12983 and closed back at 1.13060: a lower shadow of 7.5 pips on a body of 0.2 pip. Its volume, 3,034 (2), was the highest of the previous six and a half hours and about twice the 1,534 average of the hour before it. The shadow did not mark the low: price rose to about 1.1312 by 04:55, then fell to 1.12920 at 05:10 and to about 1.1287 at 05:50.
Using IQ Option trading volume to identify trend reversal
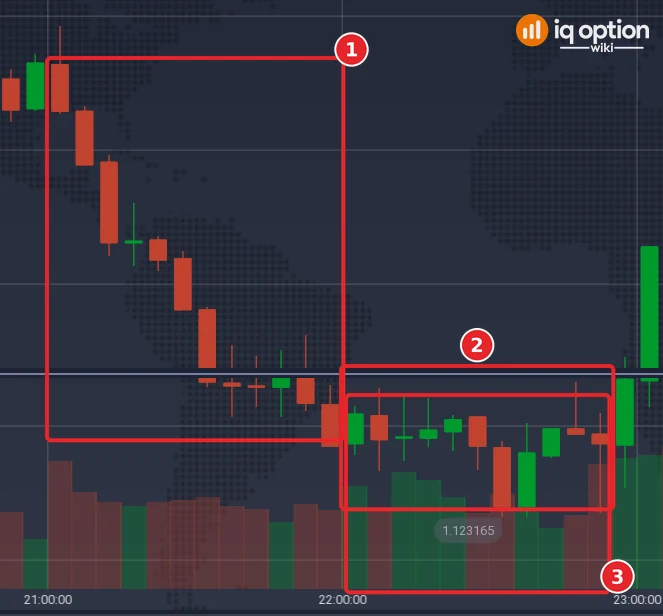
One reading of a possible reversal: after a long move up or down, price stops advancing and starts to range while volume stays heavy. Many trades take place, but price makes no further progress. It is a reason to look more closely, not a signal, because price can leave the range in the same direction as before. In our example, EUR/USD fell 14 pips on 1 October 2026, from 1.12482 at 21:00 to 1.12342 at 21:55 (1), then stopped: from 22:00 to 22:50 it stayed between 1.12316 and 1.12366 (2). The bars in the range (3) averaged 806, about the same as during the fall (770) and well above the 464 of the quiet hour before it. Price then left the range upward: 1.12414 at 23:00, 1.12455 at midnight and 1.12555 at 01:30, above the level where the fall began. It could as well have left it downward.
Using IQ Option trading volume to receive a bullish sign
A bullish sign can look like this:
- Price falls while volume rises.
- Price bounces.
- Price falls again but stops above the previous low.
- Volume on this second fall is lower than on the first.
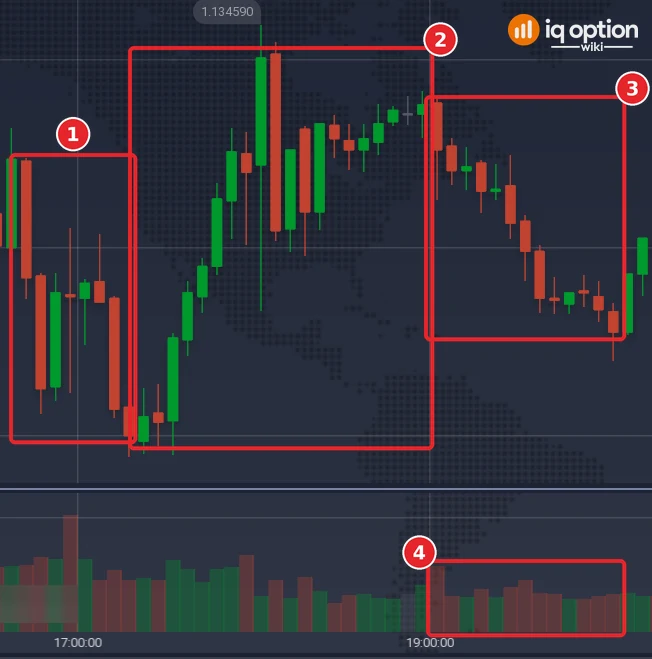
The idea is that the second fall had less selling behind it and did not break the earlier low. It becomes a bullish sign only if price then rises; the pattern alone does not say it will. In our example, EUR/USD fell on 29 September 2026 from 1.13431 at 16:35 to 1.13345 at 17:15 (1) on bars averaging 777, bounced to 1.13459 at 18:00 (2), then fell again from 19:00 to a low of 1.13370 at 20:00 (3), 2.5 pips above the first low, on bars averaging 443 (4). The pattern was there, and it led to little: price rose to 1.13431 at 22:35, then fell to 1.13336 at 22:55, under the first low.
Using IQ Option trading volume to discover false breakouts
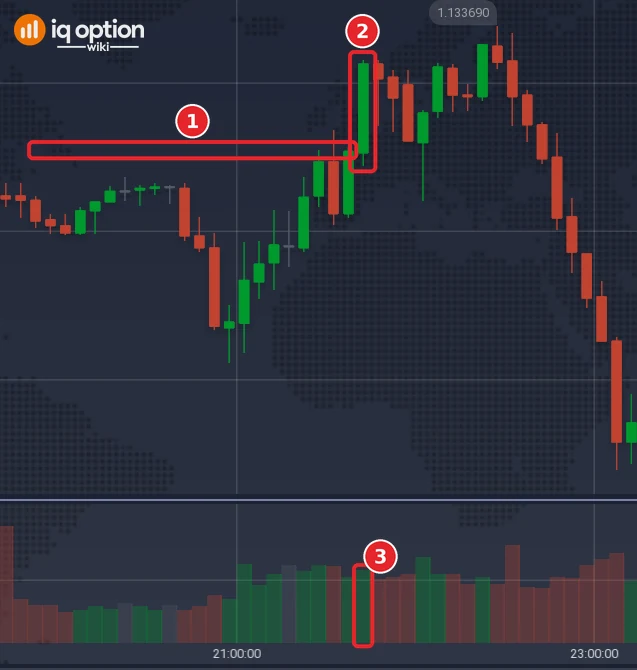
A breakout from a range or a pattern is more convincing when volume expands. IQ Option’s breakout article says a breakout “should show above-average volume, ideally 1.5 to 2 times recent levels”, and lists the signs of a false one: flat or declining volume, a long wick instead of a close near the high or low, an immediate reversal instead of follow-through, and a move against the higher-timeframe trend. That article and another IQ Option article, on liquidity sweeps, both say that a breakout can fail even on high volume, and the second adds that in spot forex the available volume data may not cover the whole market. Our guide to trading breakouts covers the price side. Our example is a failed one, on EUR/USD on 30 September 2026. Price ranged from 17:20 to 20:55 under a high of 1.13327 (1). The first candle to close above it was the 21:40 candle, at 1.13357 (2), on a volume of 802 (3): 1.6 times the 503 average of the range, but only 1.2 times the 676 average of the hour just before it, and the article does not say which stretch counts as recent. Price stayed above the level for an hour, peaked at 1.13369 at 22:25 and closed back under the level at 22:40; at 23:30 it was at 1.13254, 7.3 pips under it.
Pros and Cons of Analyzing Trading Volume
| Pros | Cons |
|---|---|
| It adds a second dimension to a price chart: how much activity stood behind a move. | What the volume counts differs by market; on forex a retail chart’s volume may be ticks or one data source’s activity. |
| It can be combined with any other tool, such as support and resistance levels. | A bar means little on its own; it has to be compared with recent bars. |
| It can help you question a breakout or a trend that is not backed by activity. | It does not predict direction: IQ Option’s blog calls it a complementary tool. |
Common mistakes
- Comparing with old volume. Compare each bar with the bars just before it, as IQ Option’s blog advises, not with volume from months ago.
- Treating forex volume as the volume of the whole market. IQ Option’s blog says it may be ticks or the activity of one data source.
- Acting on volume alone. A volume spike says that many trades took place, not which side won.
- Expecting the same bars on every asset. Check what the widget shows for the asset you trade before you rely on it.
Summary
Trading volume shows how much trading took place behind a price move. Compare each bar with recent bars, treat the readings above as questions to ask of a chart rather than signals, and check what the volume of your asset counts. To see whether a volume reading helps your own entries, note it beside each Practice trade and count the results over a few dozen trades before you rely on it.
Related guides
- Volume Oscillator and Net Volume on IQ Option
- Weis Wave Volume on IQ Option
- Accumulation/Distribution on IQ Option
- Support and resistance breakouts on IQ Option
- Support and resistance lines on IQ Option
- Chart types on IQ Option
- All indicator guides and all strategy guides
Frequently Asked Questions
Q: What is trading volume on IQ Option?
A: The amount of an asset traded in a period, shown as bars under the price chart when you switch on the volume widget. What it counts depends on the asset: IQ Option’s blog says the volume on a retail forex chart may represent ticks or the activity of one data source.
Q: Where is the volume widget?
A: Click the indicators button at the bottom left of the chart, open the Widgets tab in Chart analysis and select Volume and choose Enabled.
Q: Is the volume on IQ Option the real market volume?
A: It depends on the asset. On exchange-traded assets volume counts contracts or shares. For forex, IQ Option’s blog says a retail chart’s volume may represent ticks or one data source’s activity, not all global trading. The widget’s own description says only that it “shows how much of the selected asset was bought and sold within a given period”; it does not say what the bars count.
Q: Can I trade on volume alone?
A: No. IQ Option’s blog says volume should not be treated as a decision-making tool on its own; it complements other indicators and price analysis.
Q: Which volume indicators does IQ Option have?
A: Four, in the Volume list of Chart analysis: Accumulation/Distribution, Net Volume, Volume Oscillator and Weis Wave Volume. Our guides cover Accumulation/Distribution, the Volume Oscillator and Net Volume and Weis Wave Volume.
Q: How can volume help spot a false breakout?
A: IQ Option’s breakout article lists flat or declining volume, a long wick and an immediate reversal as signs of a false breakout, and says a breakout should show above-average volume. It also says a breakout can fail even with volume.

