Last updated: 8 October 2026. Every screenshot below was recorded on 8 October 2026 on an IQ Option Practice account registered in Brazil, on EUR/USD 5-minute candles of 30 September 2026, scrolled back on the same chart, and nothing was traded with real money. This guide has no tested box: the lines are drawn by hand, where you place them is a judgement, and there is no mechanical rule to replay. Nothing here is a promise of profit.
A trend line shows the direction of the trend; a horizontal support or resistance line shows a price where the market has turned before. Using them together means drawing both on the same chart and looking at what happens where candles reach them. On IQ Option you draw all of the lines with the Trend Line and Horizontal Line tools in the Graphical tools list. IQ Option’s blog says that when the price approaches levels it bounced back from in the past, “it can rebound again, thus forming a price channel”, and it adds “A touch is not a signal. A reaction is.”
Quick answer
- Tools: Trend Line and Horizontal Line, both in the Graphical tools list that the pencil icon at the bottom left of the chart opens.
- Three steps: draw the trend line if the chart has a trend; add the nearest horizontal support and resistance lines; look at the candles that reach a line.
- Reaction or break: a candle that touches a line and closes back away from it is a reaction; one that closes through it is a break. IQ Option’s blog says a touch is not a signal and a reaction is.
- Example: on 30 September 2026 a rising trend line and a resistance at 1.1361 closed in on each other; the price left through the trend line at 07:25 and every candle up to 09:15 closed under it.
- Limit: hand-drawn lines have no tested rule here, and a meeting point of two lines is not a signal.
Trend lines and support and resistance: what each one shows
IQ Option’s blog calls inclined levels trend lines: “In addition to horizontal levels, there are also inclined levels. These are called trend lines.” They are built “using the local maximums of the downtrend and minimums of the uptrend”. Horizontal levels are, in the blog’s words, “significant levels on the asset chart that the price has a chance of retracing from”. A support is a price area where buyers have stopped a fall before, a resistance one where sellers have stopped a rise. The blog also says old levels can switch sides: “It is also possible for an old resistance level to turn into a new support line (when the asset price goes up), and vice versa for a downward price movement.”
The two kinds of line answer different questions. The trend line tells you where the pullbacks of the trend have been stopping. The horizontal lines tell you where the price has stopped before, whatever the trend. Where they come close together, price is squeezed between them, and what happens next is decided by a candle’s close. Our guides cover each line on its own: trendline trading and support and resistance lines.
How do you use trend lines with support and resistance on IQ Option?
The method has three steps. These steps use the web traderoom on a Practice balance. The numbers in each screenshot match the numbers in the text.
Step 1: Draw the trend line
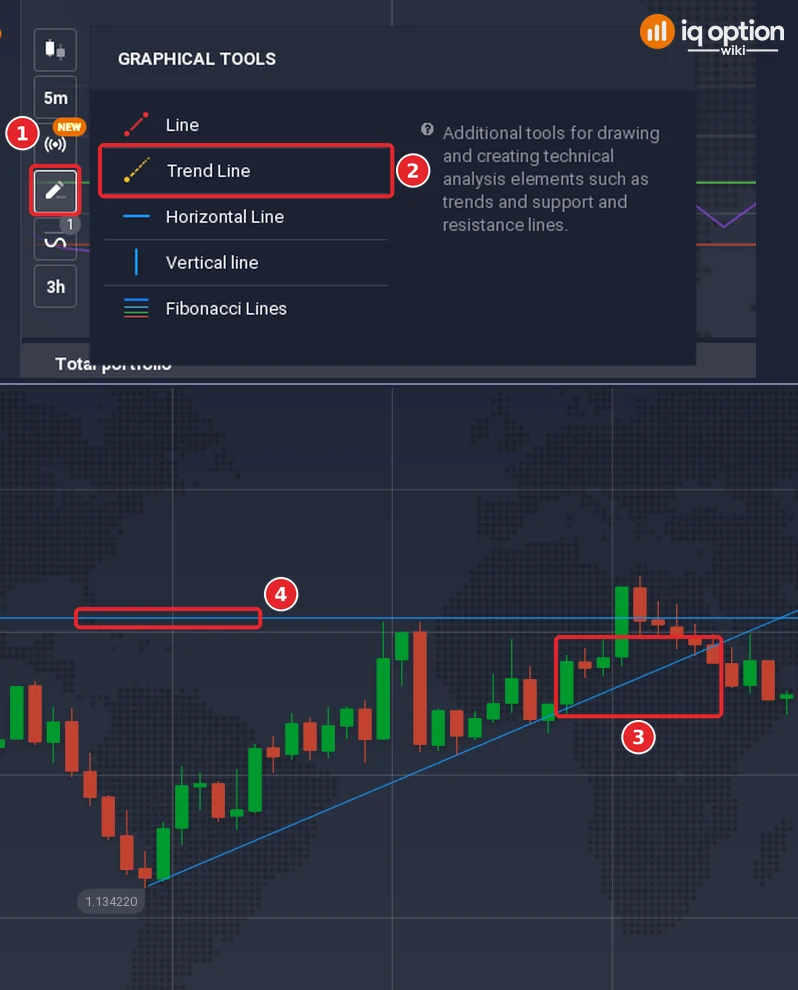
Click the drawing tools button (1), the pencil icon at the bottom left of the chart, choose Trend Line (2) and place the line through two rising lows in an uptrend, or two falling highs in a downtrend. Click the first low, move the cursor to the second low and click again; the line then runs on to the right edge of the chart. In the picture the line (3) runs through the lows of 04:50 and 06:15 on 30 September 2026 and on to the right; it was placed by hand and sits within a few tenths of a pip of the exact line.
Step 2: Add the local support and resistance
Choose Horizontal Line from the same list and click once at the price where several highs, or several lows, have stopped. In the picture the highs of 05:55, 06:05, 07:20 and 07:55 sit between 1.13605 and 1.13612, and the resistance line (4) is placed at 1.1361.
Step 3: Look for the reaction where price reaches a line
With everything on the chart, look at the candles that reach a line. A candle that touches a line and closes back away from it is a reaction; a candle that closes through the line is a break. IQ Option’s blog says “One candle is not gospel, but a strong rejection close is a much better entry trigger than a simple tag of the level.” The close is known only when the candle ends, so wait for it.
An example from 30 September 2026
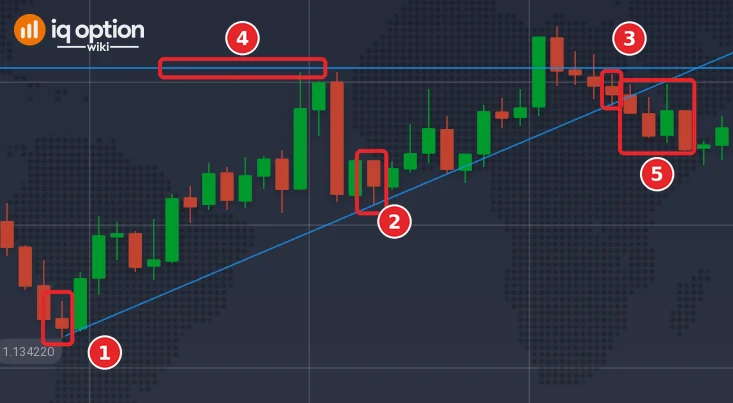
On 30 September 2026 the lows of 04:50 (1) at 1.13422 and 06:15 (2) at 1.13514 draw a line that rises 0.54 pip per 5-minute candle. Price touched it again at 06:20, 06:35 and 06:45, and at 07:20 (3), where the low of 1.13584 sat on the line. The highs of 05:55 and 06:05 (1.136065), 07:20 (1.13605) and 07:55 (1.136115) mark a resistance near 1.1361 (4), and the line reached that level at about 07:43. The squeeze ended through the trend line: the 07:25 candle closed at 1.13579, under the line at 1.13590, and every candle from 07:25 to 09:15 (5) closed under it. The resistance held as well: the highest high from 07:25 to 09:15 was 1.136115, and no candle closed above 1.1361 in that time. A trade on the touch of 07:20 would have been on the wrong side of the move; the picture shows where the lines met, not a signal.
Pros and cons of combining the two
| Pros | Cons |
|---|---|
| Two kinds of line on one chart show where the trend’s pullbacks have stopped and where price stopped before. | Both are drawn by eye, so the more lines you draw, the more your own choices decide what the chart shows. |
| The point where a trend line meets a level is easy to see and to wait for. | Where lines meet is not a signal: the price can leave in either direction, and in the example it left through the trend line. |
| A broken level can become the opposite level, which gives you the next line to watch. | Too many lines make a chart unreadable. IQ Option’s blog says: “Keep five levels maximum on the chart you actually trade.” |
Common mistakes
- Treating a meeting point as a signal. It is a place to look, not a reason to enter.
- Entering on the touch. Wait for the candle to close and show a reaction.
- Forcing the line. If you need to bend a trend line or a level to make it fit, it is not a strong line.
- Drawing lines after the fact. A line placed with hindsight always seems to have held; draw it before price comes back.
- Forgetting that lines break. Decide in advance what you do when a candle closes through one.
Related guides
- Trendline trading on IQ Option
- Support and resistance lines on IQ Option
- Triangle patterns on IQ Option
- The rebound pattern on IQ Option
- Support and resistance breakouts on IQ Option
- All indicator guides and all strategy guides
Frequently Asked Questions
Q: How do you use trend lines with support and resistance?
A: Draw the trend line first, add the nearest horizontal support and resistance lines, and look at the candles that reach a line. A candle that touches a line and closes back away from it is a reaction; one that closes through it is a break.
Q: Does combining the lines make entries more accurate?
A: We did not test that, and no source we read says so. IQ Option’s blog says no technical instrument is 100% accurate, as all of them can provide false signals.
Q: What happens where a trend line meets a resistance?
A: Price is squeezed between them and leaves in one direction, which is known only after a candle closes. In our example the price left through the trend line, not through the resistance.
Q: Which tools do I use on IQ Option?
A: Trend Line and Horizontal Line, both in the Graphical tools list that the pencil icon at the bottom left of the chart opens.
Q: How long should a trade last?
A: This guide has no tested rule, so it cannot say how long a trade should last. A binary option has a fixed expiry that you choose when you buy; see the guide to expiry times on IQ Option. A CFD has no expiry and can use a stop loss and a take profit.