
Last updated: 8 October 2026. Every screenshot below was recorded on 8 October 2026 on an IQ Option Practice account registered in Brazil, on 5-minute EUR/USD candles of 29 September 2026, scrolled back on the same chart, and we placed no real-money trade. The rule is written out so that it can be repeated and counted. The tested box shows what that rule did on a week of recorded candles; it says nothing about what it will do next.
The rebound pattern trades the moment price reaches a support or resistance line and fails to get through it. When the price reaches a resistance line and a candle closes back below it, you open a Lower option; when it reaches a support line and a candle closes back above it, you open a Higher option. On IQ Option you draw the lines with the Horizontal Line tool, and every trade here lasts 15 minutes. No part of this is a promise: in our week of 5-minute candles the written rule fired 138 times and won 50.7% of them, below the 54.1% that a trade needs at an 85% payout.
Quick answer
- Chart: 5-minute candlesticks on EUR/USD, a support line and a resistance line drawn with the Horizontal Line tool.
- Rule: a candle touches the lowest low (or the highest high) of the previous 50 candles and closes back away from it: Higher at its close after a support rebound, Lower after a resistance rebound.
- Trade: a 15-minute option (three candles). A binary option has no stop loss or take profit.
- Test result: in a replay on EUR/USD 5-minute candles from 29 September to 5 October 2026 the rule fired 138 times and won 70 (50.7%), below the 54.1% break-even rate at an 85% payout. Support rebounds won 45.1% of 82, resistance rebounds 58.9% of 56.
- Break-even: at an 85% payout a trade has to win about 54.1% of the time (1 ÷ 1.85); at 93%, more than 51.8%. With 138 trades the win rate has a margin of error of about ±4 points (one standard error), so 50.7% cannot be told from break-even.
What is the rebound pattern?
A rebound is a bounce off a level. IQ Option’s blog says that when the price approaches levels that it bounced back from in the past, “it can rebound again, thus forming a price channel”. The signal is a candle that reaches the level and closes back away from it. What makes a level worth trading is covered in our guide to support and resistance lines. IQ Option’s blog adds a warning: “A touch is not a signal. A reaction is.”
The rule we tested
A hand-drawn line cannot be replayed, so the test uses a rule that anyone can repeat:
- The levels. The support is the lowest low of the previous 50 candles; the resistance is the highest high of the previous 50 candles.
- The touch. A candle touches the support when its low is within a quarter of the 14-period average true range (ATR) of the support, about 1 pip on these candles, or below it. A candle touches the resistance when its high is that close to the resistance or above it.
- The rebound. The same candle closes back away from the level by more than that quarter ATR: above the support, or below the resistance.
- The trade. Open a Higher option at the close of a support rebound, or a Lower option at the close of a resistance rebound, with an expiry of 15 minutes (three candles).
How do you trade the rebound pattern on IQ Option?
These steps use the web traderoom on a Practice balance. The numbers in each screenshot match the numbers in the text.
Step 1: Choose the asset
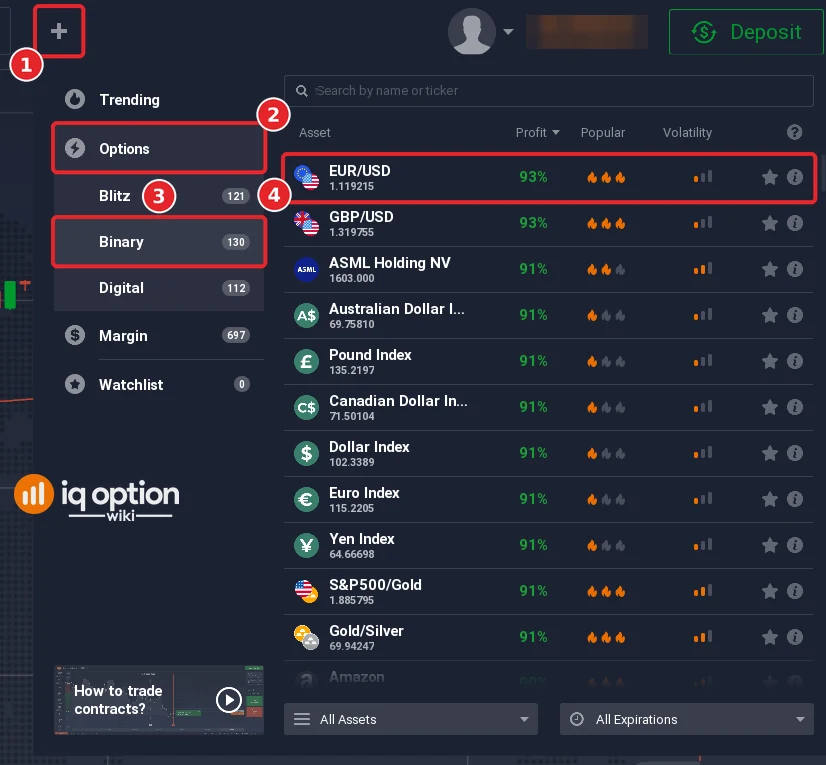
Click + in the top bar (1), open Options (2), choose Binary (3) and pick EUR/USD from the list (4). The list shows each asset’s payout: on 8 October 2026 EUR/USD showed 93%. The tests below assume 85%, a round figure, because the replay places no orders; at 93% the break-even rate is 51.8%. The payout changes by asset and over time, so read it next to the asset you choose.
Step 2: Set 5-minute candles
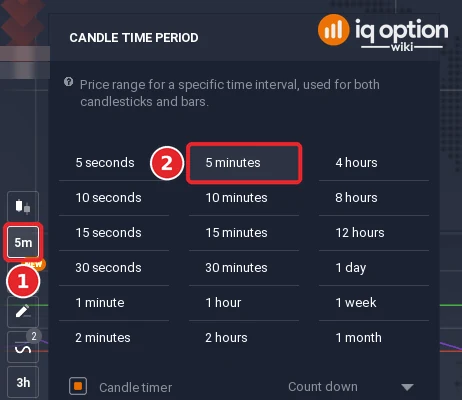
Click the candle time period button (1) in the chart toolbar and choose the 5-minute period (2). Each candle then covers five minutes, which is what the rule is written for.
Step 3: Draw the support and the resistance
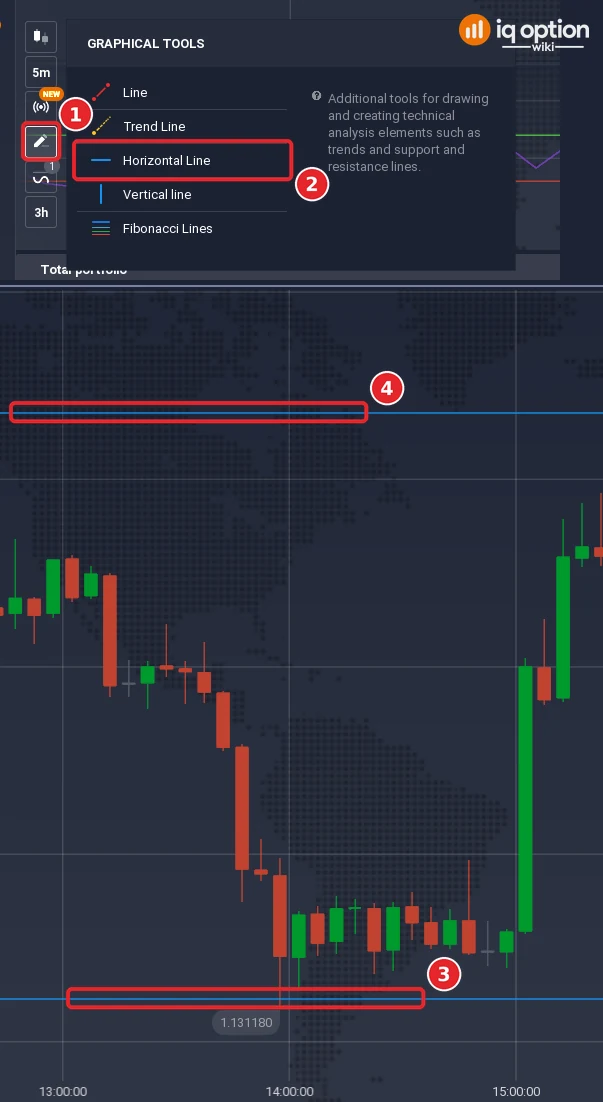
Click the drawing tools button (1), choose Horizontal Line (2) and click once on the chart at the lowest low of the last 50 candles; then do the same at the highest high. One click places each line, and it spans the whole chart. In the picture, 50 candles before 16:00 on 29 September 2026, the support (3) was 1.13118 and the resistance (4) 1.13437.
Step 4: Wait for a touch and for the close
Do nothing while the price is between the lines. When a candle reaches a line, wait until that candle has closed: the signal is only there if it closed back away from the line. A candle that closes through the line is a break, not a rebound.
Step 5: Choose a 15-minute expiry and click Higher or Lower
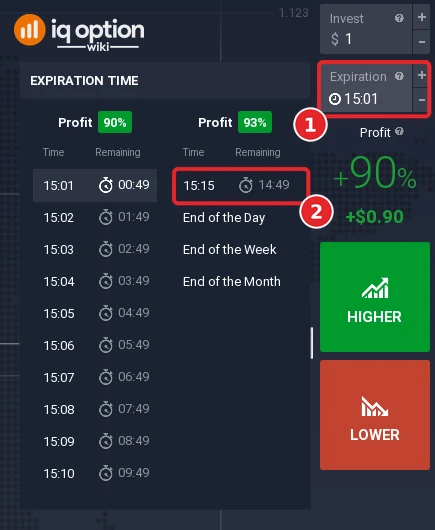
Right after the signal candle closes, open the Expiration box on the right-hand panel (1), pick the quarter-hour mark about 15 minutes ahead (2) and check the remaining time beside it, then click Higher after a support rebound or Lower after a resistance rebound. A binary option has no stop loss or take profit: it closes at expiry whatever the candles do.
Two signals from the tested week
Both examples are the first signal of their kind on 29 September 2026 after 10:00 on the traderoom clock (UTC-3), taken from the replay, not picked because of the result.
A support rebound that lost
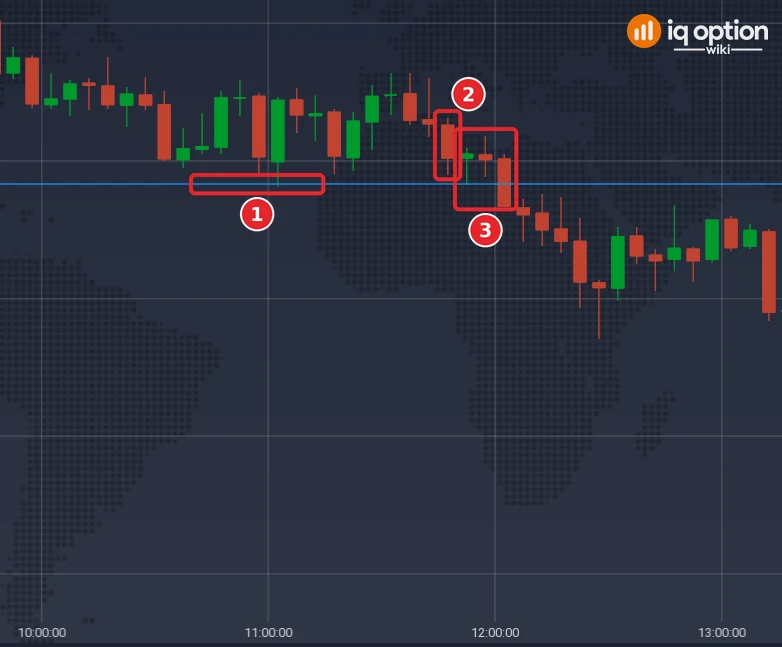
At 11:45 the lowest low of the previous 50 candles was 1.13382, set by the 11:00 candle. The 11:45 candle opened at 1.13426, fell to 1.13390, 0.8 pip above that line and inside the quarter-ATR band (1.13391), and closed at 1.13402, above the band: a support rebound (2). The line is marked (1) and the three candles that the option runs through (3). The rule opened a Higher option at 11:50 at 1.13402. It ended at 12:05 with the price at 1.13367, 3.5 pips lower: a loss. The same level gave two more signals, at 11:50 and 11:55, and both lost too: three trades on one touch, which is why the signals are not independent.
A resistance rebound that won
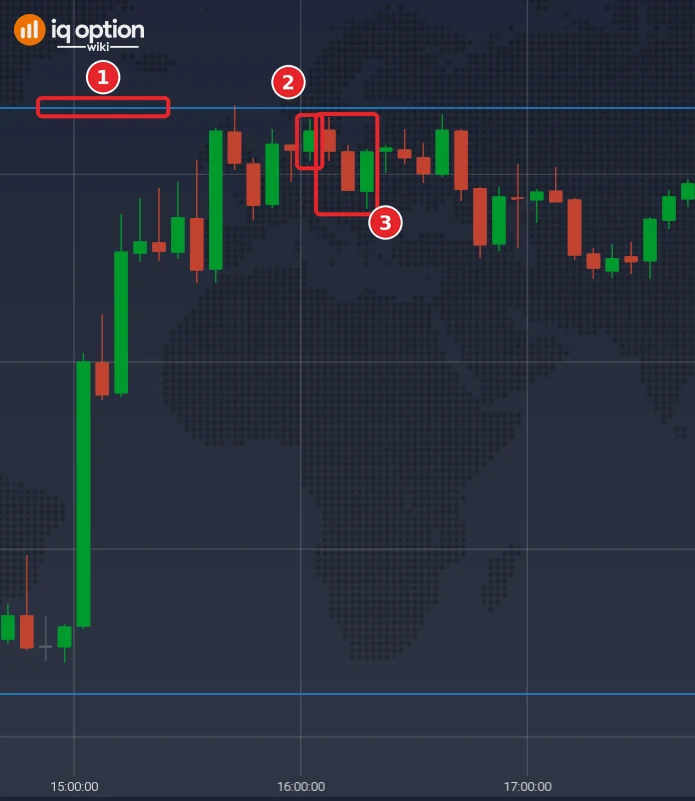
At 16:00 the highest high of the previous 50 candles was 1.13437, set by the 15:40 candle. The 16:00 candle opened at 1.13413, rose to 1.13429, 0.8 pip under that line and inside the band (1.13426), and closed at 1.13423, below the band: a resistance rebound (2). The line is marked (1) and the three candles that the option runs through (3). The rule opened a Lower option at 16:05 at 1.13423. It ended at 16:20 with the price at 1.13412, 1.1 pips lower: a win. The next candle gave another Lower signal, which lost.
Tested on IQ Option: EUR/USD candles of 29 September to 5 October 2026
| Asset and candles | EUR/USD (binary), 5-minute candles recorded from IQ Option’s Practice traderoom: 1,334 candles in two stretches without gaps, 29 September 01:55 (open of the first candle) to 2 October 21:00 UTC (close of the last candle; 1,093 candles in this stretch) and 4 October 21:00 to 5 October 17:05 UTC (241 candles). Signals are counted from the 66th candle of each stretch (50 candles for the levels, plus the ATR warm-up). The replay places no orders and uses the logged prices. |
|---|---|
| Rule tested | Support = lowest low and resistance = highest high of the previous 50 candles. A touch is a low or high within 0.25 x ATR(14) of the level, or beyond it; the same candle must close back away from the level by more than 0.25 x ATR. Higher at the close after a support rebound, Lower after a resistance rebound; expiry 15 minutes (three candles) from the close of the signal candle. A candle that qualifies on both sides is skipped. |
| Signals | 138 signals: 82 support rebounds (Higher) and 56 resistance rebounds (Lower). Each signal is its own trade, and signals can sit on neighbouring candles at the same level, so the trades are not independent. |
| Outcomes | 70 won, 68 lost, none refunded: 50.7% of the 138 trades, a net of -$0.062 per $1 staked at an 85% payout. Higher: 37 won, 45 lost (45.1%). Lower: 33 won, 23 lost (58.9%). |
| Other settings | With the levels taken over 30 candles: 192 signals, 93 won, 99 lost (48.4%). Over 100 candles: 63 signals, 30 won, 33 lost (47.6%). With a moving-average confirmation (a touch, then the EMA 9 crossing the EMA 13 within six candles): 15 signals, 7 won, 8 lost (46.7%). |
| Break-even | At an 85% payout a trade has to win more than 54% of the time (1 / 1.85); at 93%, more than 51.8%. |
The numbers come from replaying candles recorded from IQ Option’s Practice traderoom: no order was placed, each trade is scored at its expiry from the logged candle closes, with no spread, at an 85% payout. A short test proves nothing about the future: it covers one asset over a week of candles in which EUR/USD fell 108 pips in the first stretch and 56 pips in the second, which may explain why the support rebounds did worse than the resistance rebounds. A rule that did well in it could lose tomorrow, and one that did badly could do better. Lines drawn by hand would give other signals than the numeric stand-in used here. No profit or win rate is promised. Compare the win rate with the break-even rate above, and repeat the test on your own Practice balance before you risk money.
What the rebound pattern is used with
IQ Option’s blog says that a touch needs confirmation (“Wait for a reaction (rejection wick, slowdown, role reversal) — don’t buy the touch.”). Three kinds of confirmation can be added: an oscillator such as the RSI, the CCI or the Stochastic that shows an overbought or oversold market; a reversal candle at the level; and a pair of moving averages, for example the EMA 9 and the EMA 13, where a cross in the direction of the rebound is the confirmation. We tested only the last one, because it is the only one that gives a yes or no answer: after a touch, the EMA 9 had to cross the EMA 13 within six candles. That gave 15 signals in the week, 7 won and 8 lost (46.7%), too few to say anything. The other two are judgement calls that we did not turn into rules.
Pros and cons of the rebound pattern
| Pros | Cons |
|---|---|
| The rule is short: two lines, one touch, one close. | A touch is not a signal: IQ Option’s blog says a reaction is, and a candle that looks like a rebound can be the first candle of a break. |
| The lines can be drawn on any chart you can open, and the rule can be used next to other tools. | A level that held many times can still break: breakouts can be real or fake, according to IQ Option’s blog. |
| A trade lasts 15 minutes, so a wrong call costs one stake and no more. | In the tested week it did not beat the break-even rate, and the two sides behaved differently: support rebounds won 45.1% and resistance rebounds 58.9%, in a week when EUR/USD fell 108 pips and then 56 pips. |
Common mistakes
- Entering on the touch. Wait for the candle to close back away from the line.
- Treating a close through the line as a rebound. That is a break; see the guide to breakouts.
- Counting every signal as independent. Signals cluster: in the tested week several fired on neighbouring candles at the same level.
- Using a level that was drawn to fit the chart. A line drawn after the fact always looks as if it held. Draw it before the price comes back.
- Forgetting the break-even rate. At an 85% payout a trade has to win more than 54% of the time, and at 93%, more than 51.8%.
Related guides
- Support and resistance lines on IQ Option
- Trendline trading on IQ Option
- Support and resistance breakouts on IQ Option
- Five entry signals on IQ Option
- RSI and support and resistance strategy
- Chart patterns on IQ Option
- All indicator guides and all strategy guides
Frequently Asked Questions
Q: What is the rebound pattern?
A: A bounce off a support or resistance line: the price reaches the line, a candle closes back away from it, and you trade in the direction of the bounce.
Q: Does the rebound pattern work in every market?
A: IQ Option’s blog says that levels the price bounced from before can be hit again, but it also says no technical instrument is 100% accurate. In our week of recorded EUR/USD candles the written rule won 50.7% of 138 trades, below the break-even rate.
Q: How can I avoid false rebounds?
A: You cannot avoid them. A candle that closes back from the line can be the first candle of a break. Waiting for the candle to close, and checking the next candle before you rely on the level, removes some of them.
Q: Which tools confirm a rebound?
A: Three kinds of tool can be added as a confirmation: oscillators such as the RSI, the CCI and the Stochastic, reversal candles, and a cross of two moving averages such as the EMA 9 and the EMA 13. We tested only the moving-average cross (15 signals, 46.7%), which is too few signals to judge it.
Q: How long should a rebound trade last?
A: The tested rule uses 15 minutes, which is three 5-minute candles. That is a choice, not a finding; the guide to expiry times on IQ Option explains how the Expiration box works.
Q: Can I use the rebound pattern as a standalone method?
A: Our test does not support that. The rule did not reach the break-even rate on its own, and IQ Option’s blog says a touch alone is not a signal.

