Last updated: 8 October 2026. Every screenshot below was recorded on 8 October 2026 on an IQ Option Practice account registered in Brazil, on 5-minute EUR/USD candles of 29 and 30 September 2026 scrolled back on the same chart, and nothing was traded with real money. This guide has no tested box: a triangle is drawn by hand, where you draw it is a judgement, and there is no mechanical rule to replay. Nothing here is a promise of profit.
A triangle is a pattern made of two straight lines that move toward each other while price swings between them. You draw it on IQ Option with the Trend Line and Horizontal Line tools from the Graphical tools list, because the platform does not mark it for you. There are three kinds: the ascending triangle (a flat top and rising lows), the descending triangle (falling highs and a nearly flat bottom) and the symmetrical triangle (falling highs and rising lows). IQ Option’s blog says “Triangles are popular because they are easy to draw badly” and “Wait for the actual break, not the shape alone.” We scanned a week of 5-minute EUR/USD candles for triangles, drew the one with the most touches of each kind on the chart and followed what the price did next: the ascending triangle broke down, the descending one broke up by 0.2 pip and was back under its entry within 25 minutes, and the symmetrical one broke down and was back above its entry within 15 minutes.
Quick answer
- Tools: Trend Line and Horizontal Line in the Graphical tools list, opened with the pencil icon at the bottom left of the chart. The platform does not draw the pattern for you.
- Three kinds: ascending (flat top, rising lows), descending (falling highs, nearly flat bottom) and symmetrical (falling highs, rising lows).
- Entry idea: wait for a candle to close outside a line. IQ Option’s blog says the shape is not the signal and price still has to confirm.
- Examples: a scan of a week of 5-minute EUR/USD candles found 11 triangles. The best of each kind: the 30 September ascending one broke down, the 29 September descending one broke up by 0.2 pip, the 30 September symmetrical one broke down and reversed.
- Limit: no rule is tested: a hand-drawn pattern has no mechanical version, and triangles are easy to draw badly.
What does a triangle pattern show?
A triangle is a squeeze: the swings get smaller, buyers and sellers are closer together, and the price has to leave the pattern sooner or later. IQ Option’s blog lists where each kind is usually looked for: “Symmetrical triangles after a strong move. Ascending triangles below clear resistance in bullish conditions. Descending triangles above clear support in bearish conditions.” It also warns that the pattern depends on its surroundings: “The same triangle can be a high-quality continuation setup in a strong trend and a terrible trap in a choppy market.”
| Triangle | Shape | What it is usually read as |
|---|---|---|
| Ascending | A flat resistance line on top and a rising line under the lows | Bullish: buyers keep paying more at each dip while sellers hold one price. IQ Option’s blog: “Ascending triangles break upward often, but not always.” |
| Descending | A falling line over the highs and a flat or nearly flat support line at the bottom | Bearish: sellers keep selling at lower prices while buyers hold one price. |
| Symmetrical | A falling line over the highs and a rising line under the lows | Neutral until it breaks; IQ Option’s blog looks for it after a strong move. |
How do you draw a triangle on IQ Option?
These steps use the web traderoom on a Practice balance. The numbers in each picture match the numbers in the text.
Step 1: Draw the sloping line
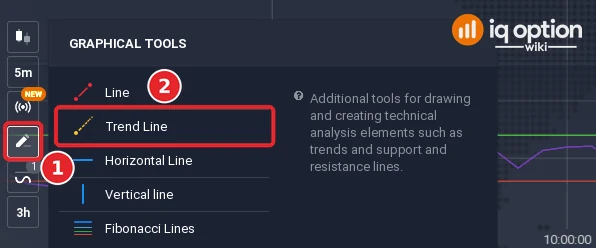
Click the drawing tools button (1), the pencil icon at the bottom left of the chart, choose Trend Line (2) and place the line through at least two highs or two lows: click the first point, move the cursor to the second and click again. The line runs on to the right edge of the chart.
Step 2: Draw the flat line, or the second sloping line
For an ascending triangle choose Horizontal Line from the same list and click once at the price where the highs stop. For a descending or a symmetrical triangle draw a second Trend Line on the other side. Each line needs at least two touches.
Step 3: Check that the lines move toward each other
The two lines must come closer from left to right. If they stay parallel the pattern is a channel or a range, and if they move apart it is not a triangle.
Three triangles from our charts
To avoid choosing the pictures by hand, we wrote the shape down and scanned the 1,334 recorded candles for it: two straight lines through swing highs and swing lows, at least three touches on each line, no candle more than half a pip outside them, a start at least 5 pips wide and an end at most 60% of that width. The scan found 11 triangles (4 descending, 5 symmetrical, 2 ascending). For each kind we show the one with the most touches. The times are the traderoom clock (UTC-3), and what a trade would have done is worked out from the logged candles, not traded. The lines in the pictures were placed with the tool through the anchor prices and sit within a few tenths of a pip of the exact lines.
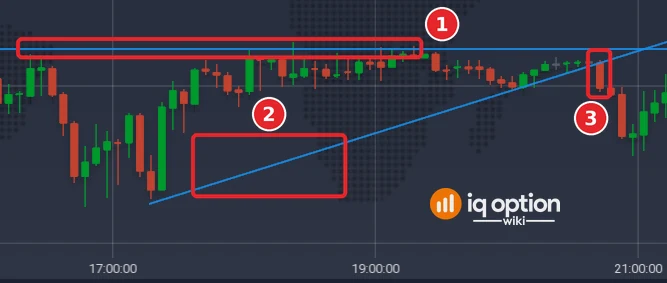
An ascending triangle: 30 September, 16:20 to 20:05
The highs, from 1.133195 at 16:20 to 1.13325 at 19:15, stayed within 0.7 pip of one price, about 1.1332, on 17 candles: a flat top (1). The lows rose from 1.13229 at 17:15 to 1.13299 at 20:05, 0.21 pip per candle, with six touches (2). The triangle narrowed from 11.3 pips at 16:20 to 2.8 pips at 20:05, and its lines meet at about 21:17. The first candle to close outside came after the last touch: the 20:40 candle closed at 1.13298, 1.5 pips under the rising line (3), which is against the usual bullish reading. A Lower option opened at its close, 20:45, would have ended 15 minutes later, at 21:00, at 1.13270: a win by 2.8 pips. A Higher option, the bullish reading, would have lost by the same amount.
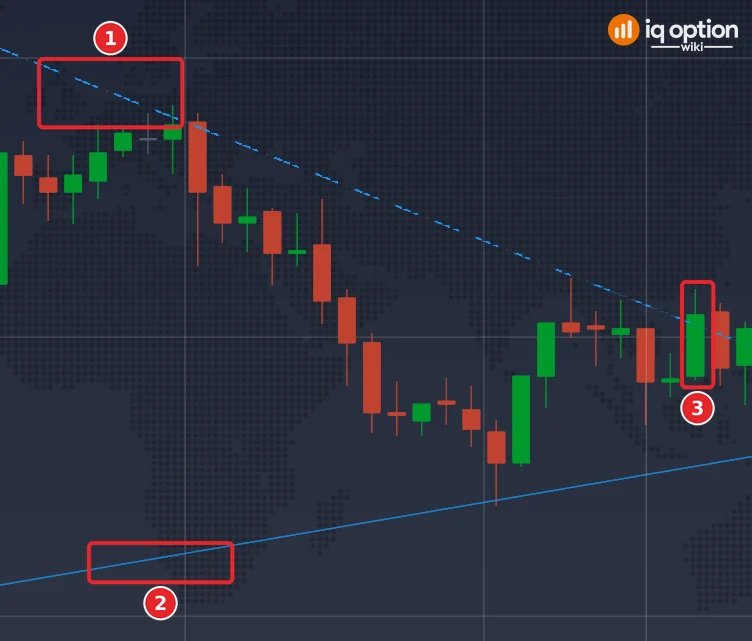
A descending triangle: 29 September, 17:15 to 20:15
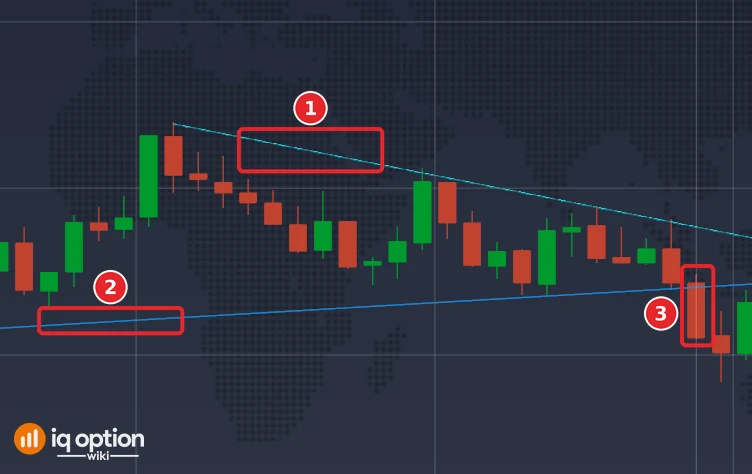
The falling line (1) runs from the high of 18:00 (1.13459) to the high of 20:15 (1.134105), 0.18 pip per candle, with ten touches. The lower line (2) is nearly flat: from the low of 17:15 (1.133445) to the low of 20:00 (1.1337) it rises 0.08 pip per candle, with six touches. The triangle narrowed from 13.1 pips at 17:15 to 3.8 pips at 20:15, and its lines meet at about 21:29. The first close outside came at 20:40, and it was upward: the candle closed at 1.13404, 0.2 pip above the falling line (3), against the usual bearish reading and by so little that it hardly counts. A Higher option opened at its close, 20:45, would have ended at 21:00 at 1.13407, a win by 0.3 pip. After 25 minutes, at 21:10, the price was at 1.13384, under the entry.
A symmetrical triangle: 30 September, 05:50 to 08:30
The falling line (1) runs from the high of 07:05 (1.13639) to the high of 08:30 (1.135885), 0.30 pip per candle, with five touches; the rising line (2) runs from the low of 05:50 (1.13509) to the low of 08:20 (1.135355), 0.09 pip per candle, with six touches. The triangle narrowed from 17.5 pips at 05:50 to 5.1 pips at 08:30, and its lines meet at about 09:36. The first close outside came at 08:50: the candle closed at 1.13511, 3.0 pips under the rising line (3), downward. A Lower option opened at its close, 08:55, would have ended at 09:10 at 1.13553, 4.2 pips above the entry: a loss. The break did not hold: at 09:20 the price was at 1.13575.
When do you enter?
The shape is not the signal. IQ Option’s blog says “Wait for the actual break, not the shape alone” and “Price still has to confirm.” In practice that means waiting for a candle to close outside one of the lines. The blog adds that “In practice, the best breakouts usually happen before the pattern gets too squeezed”, and it reminds you that “Just because it’s a continuation pattern doesn’t mean it won’t fail.” In our three examples the first close outside came 20 to 35 minutes after the last touch and 37 to 49 minutes before the apex, the point where the lines meet, in the last fifth of the pattern’s length, and it went against the usual reading or came to nothing.
A binary option has no stop loss or take profit: you choose the direction and the expiry when you buy and the trade closes at expiry whatever price does in between; see expiry times on IQ Option. A CFD (margin) trade has both, and a triangle’s lines can mark where the stop goes. We did not test an entry rule on triangles; the three examples show what the price did in each case, not what it will do.
Pros and cons of triangle patterns
| Pros | Cons |
|---|---|
| The shape is easy to see once the lines are drawn, and the break gives a clear moment to act on. | IQ Option’s blog says triangles are easy to draw badly: change a touch point and the pattern changes. |
| It can be found on any chart you can open, with the Trend Line and Horizontal Line tools. | A triangle in a choppy market can be a trap, according to IQ Option’s blog, and a continuation pattern can still fail. |
| It can be combined with other tools such as support and resistance, volume or an oscillator. | Breaks can be real or fake, and the first move out of the pattern can reverse, as it did in the symmetrical and the descending examples within 25 minutes. |
Common mistakes
- Trading the shape. Wait for a candle to close outside a line.
- Forcing the lines. If you need to bend a line to fit the touches, the pattern is not there.
- Reading the direction from the name. In our examples the ascending triangle broke down, the descending one broke up by 0.2 pip and the symmetrical one broke down and came back.
- Ignoring the market around it. A triangle after a strong move and one in a choppy market are different things.
- Expecting the break to continue. Plan what you do if the first move out reverses.
Related guides
- Trendline trading on IQ Option
- Support and resistance lines on IQ Option
- Support and resistance breakouts on IQ Option
- Trend lines combined with support and resistance
- Chart patterns on IQ Option
- All indicator guides and all strategy guides
Frequently Asked Questions
Q: How many touches does a triangle need?
A: Each of the two lines needs at least two touches to be drawn. Our scan asked for three on each, and the lines of the three examples above have between 5 and 17 (17 is the flat top of the ascending triangle, counted as highs within 0.7 pip of it). IQ Option’s blog says the pattern is easy to draw badly, so check that you did not bend a line.
Q: Is a triangle a continuation or a reversal pattern?
A: IQ Option’s blog presents triangles as continuation patterns and also says “Just because it’s a continuation pattern doesn’t mean it won’t fail.” Our ascending triangle broke down.
Q: Is a descending triangle bullish or bearish?
A: It is usually read as bearish: IQ Option’s blog looks for descending triangles above clear support in bearish conditions. The reading depends on the break, not on the shape: ours broke up by 0.2 pip and was back under its entry 25 minutes later.
Q: How can I confirm a breakout from a triangle?
A: Wait for a candle to close outside the line; IQ Option’s blog says “Price still has to confirm.” Volume or an oscillator can be looked at next to it.
Q: Can triangles be used on short time frames?
A: The examples in this guide use 5-minute candles. IQ Option’s blog says to use time frames you can watch and not to trade 1-minute noise.