Last updated: 8 October 2026. Every screenshot below was recorded on 8 October 2026 on an IQ Option Practice account registered in Brazil, on EUR/USD 5-minute candles of 1 October 2026, scrolled back on the same chart, and nothing was traded with real money. This guide has no tested box: a trendline is drawn by hand, where you anchor it is a judgement, and there is no mechanical rule to replay. Nothing here is a promise of profit.
A trendline is a straight line that joins at least two lows in an uptrend, or at least two highs in a downtrend, and is extended to the right so that you can see whether later candles respect it. IQ Option does not draw it for you: you choose the Trend Line tool in the Graphical tools list and place the line yourself. IQ Option’s blog says to “connect several points on the prices chart (recent lows for the potential uptrend and highs for the downtrend)” and adds “Keep in mind that the line should touch the chart at least three times.”
Quick answer
- Where it is: the drawing tools button (a pencil icon) at the bottom left of the chart, then Trend Line in the Graphical tools list. It is a drawing tool: the platform does not place the line for you.
- How to draw it: through two lows that each sit higher than the one before in an uptrend, or two highs that each sit lower in a downtrend, and extend it to the right. Click the first point, move the cursor to the second and click again.
- Entry idea: wait for the third touch and a candle that shows the line held, then enter in the direction of the trend. A CFD can use a stop loss just beyond that candle and a target at the previous high or low.
- Example: on 1 October 2026 the line through the lows of 14:15 and 15:05 was touched at 17:55; the target of 2.95 pips against a risk of 3.90 pips was reached at 18:15, and a candle closed under the line at 18:50.
- Limit: not a rule that has been tested: a hand-drawn line has no mechanical version. A touch is not a signal on its own, and every line can break.
Key concepts you need to understand regarding an uptrend
IQ Option’s blog gives the shortest definition: “Higher highs and higher lows show an uptrend. Lower highs and lower lows show a downtrend.” An uptrend is not a straight climb. Price rises, gives part of the rise back, and rises again, and each pullback stops above the previous one. The trendline joins the bottoms of those pullbacks. This guide follows an uptrend; for a downtrend, mirror every step: join the falling highs and look at the touches from below.
Inclined levels are related to horizontal ones. IQ Option’s blog says “In addition to horizontal levels, there are also inclined levels. These are called trend lines.” and “They are built using the local maximums of the downtrend and minimums of the uptrend.” Our guide to support and resistance lines covers the horizontal kind.
How do you draw a trendline on IQ Option?
These steps use the web traderoom on a Practice balance. The numbers in each screenshot match the numbers in the text.
Step 1: Choose the Trend Line tool
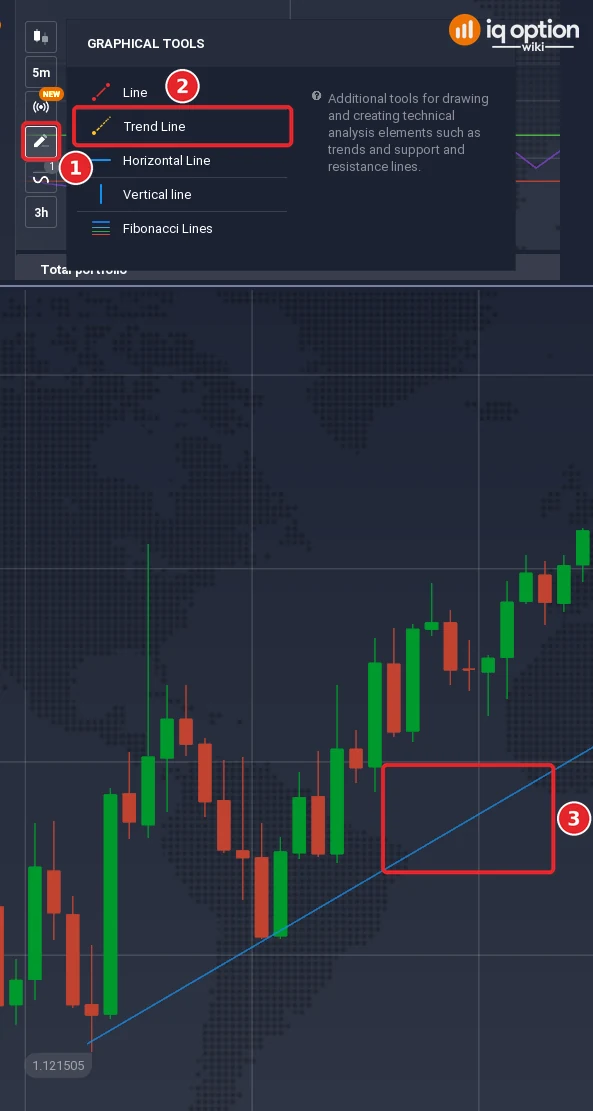
Click the drawing tools button (1), the pencil icon in the chart toolbar at the bottom left of the chart. It opens a list titled Graphical tools with Line, Trend Line, Horizontal Line, Vertical line and Fibonacci Lines. Click Trend Line (2).
Step 2: Place the line on two lows
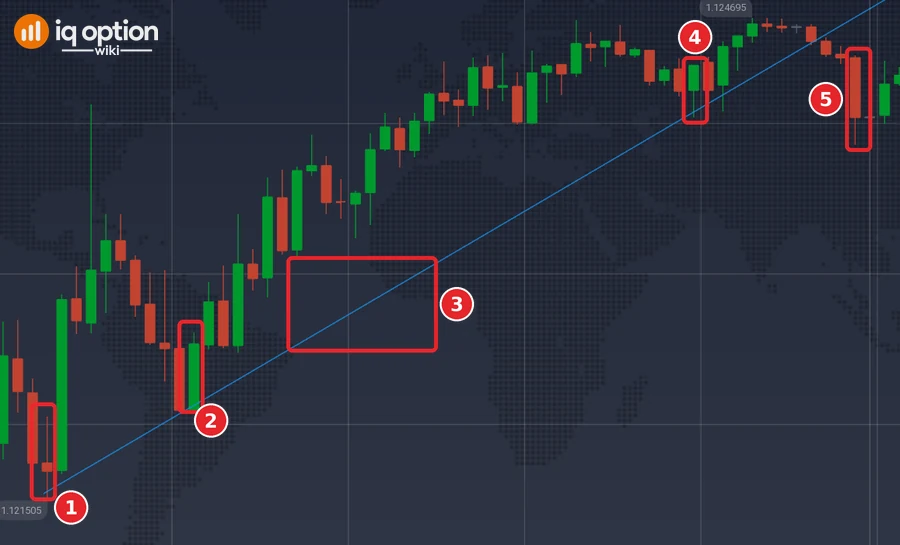
Find two lows of an uptrend, each higher than the one before. Click the first low, move the cursor to the second low and click again; the line then runs on to the right edge of the chart. In the picture the line (3) runs through the lows of 14:15 and 15:05 on 1 October 2026.
Step 3: Check the line
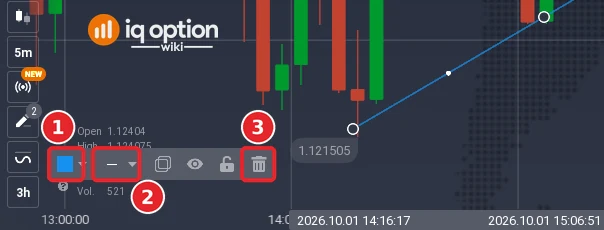
While the line is selected, the time axis shows when each point was placed (14:16:17 and 15:06:51 in our picture) and the price scale at the right edge shows their prices (1.12154 and 1.12212, a few tenths of a pip above the two lows we aimed at, because the pointer is placed by hand). A line that every candle between the two points stays above is a cleaner fit than one that candles cut through. If you have to bend the line to make it fit, the trend is not clear enough to trade.
Step 4: Change or remove the line
Click the line to select it. Two small circles mark the points you clicked, a dot sits in the middle, and a toolbar appears at the bottom left of the chart. Its tooltips read, from the left, Select color (1), Select line width (2), Clone, Hide, Unlock and Remove (3). Remove deletes the line, and so does the Delete key.
Trendline trading: where do you enter?
The points where price comes back down to the line are the places to look at. In an uptrend a pullback that reaches the line and turns back up is a touch; a candle that closes well under the line is a break. IQ Option’s blog says “A touch is not a signal. A reaction is.” and that a strong rejection close is a much better entry trigger than a simple tag of the level.
Entering on the third touch, with a stop loss and a target
Two points are needed to draw a line, so the third point is the first touch that tests it. An entry rule built on this waits for that touch and asks for two more things: the price returns to the line, and a candle shows that the line held, either a candle with a long shadow on the line or an engulfing candle. The rule is set out like this:
- Uptrend, long: enter when the shadow or the engulfing candle forms on the line. On a margin (CFD) trade, place the stop loss just below that candle and the take profit at the previous high.
- Downtrend, short: mirror the rule. Join the highs, wait for a shadow or an engulfing candle on the line, place the stop loss just above that candle and the take profit at the previous low.
Before you enter, compare the distance to your target with the distance to your stop. If the previous high is barely above your entry, the possible reward is smaller than the risk and the trade is not worth taking; the further the target is compared with the stop, the better the reward-to-risk ratio. A binary or digital option has no stop loss or take profit: you choose the expiry instead, so only the entry rule applies.
An example from 1 October 2026
The line runs through the lows of 14:15 (1) at 1.121505 and 15:05 (2) at 1.12209, a climb of 0.585 pip per 5-minute candle (3); the line in the picture was placed by hand and differs from this exact line by a few tenths of a pip. The first candle to reach it again was the 17:55 candle (4): it opened at 1.12422, dipped to 1.124045, 0.34 pip under the line (1.124079), and closed at 1.124385, a lower shadow of 1.75 pips on a body of 1.65 pips. Entering a CFD at that close with a stop 0.5 pip under the low (1.123995, a risk of 3.90 pips) and a target at the previous high of 1.12468 (17:15) would have offered 2.95 pips for 3.90 at risk, a ratio of 0.76: by the rule above, not worth taking. Price reached the target at 18:15 without touching the stop. A 15-minute Higher option opened at the same close entered at 1.124385 and ended at 1.12458, 1.95 pips higher. The line then failed: at 18:50 a candle closed at 1.12404, 6.8 pips under it (5).
Trading trendline breakouts
When a candle closes under an uptrend line, one of two things may be starting. “There may be breakouts: sometimes they can point to a change in the trend”, says IQ Option’s blog; and “If the retracement is stronger and the price breaks through the trend support, traders consider applying a breakout strategy.” It can also be a pause in a trend that goes on, and a single candle does not tell you which. With nothing else to confirm the break, waiting for a few more candles costs little. Our guide to breakouts goes through the steps.
Pros and cons of trendline trading
| Pros | Cons |
|---|---|
| One line shows the direction of the trend and where its pullbacks have stopped. | It is drawn by eye: two traders can draw different lines on the same chart. |
| It is quick to draw on IQ Option and quick to delete. | A line can fail: the one in the example failed 55 minutes after the third touch. |
| It combines with other tools such as support and resistance lines and candlestick signals. | A pullback can be a reversal. IQ Option’s blog says no technical instrument is 100% accurate and breakouts can be real or fake. |
Common mistakes
- Forcing the line. If you need to bend it to make it fit, there is no clean trend.
- Trading against the line’s direction. In an uptrend, a touch from above is the place to look for a Higher trade, not a Lower one.
- Entering on the touch itself. Wait for the candle to close and show that the line held.
- Ignoring the reward-to-risk ratio. If the target is closer than the stop, skip the trade, as the example shows.
- Holding on after a close under the line. A break is a reason to look again, not to hope.
Related guides
- Support and resistance lines on IQ Option
- Trend lines combined with support and resistance
- Triangle patterns on IQ Option
- Support and resistance breakouts on IQ Option
- Fibonacci levels on IQ Option
- All indicator guides and all strategy guides
Frequently Asked Questions
Q: Can trendline trading work in a downtrend?
A: Yes, mirror the steps: join the falling highs and look at touches from below. The guide above follows an uptrend.
Q: How do you draw a trendline on IQ Option?
A: Click the pencil icon at the bottom left of the chart, choose Trend Line in the Graphical tools list and place the line through two rising lows in an uptrend, or two falling highs in a downtrend.
Q: How many touches does a trendline need?
A: Two points draw the line. IQ Option’s blog says the line should touch the chart at least three times, so the third point is the first test of it.
Q: What should you do if the price breaks the trendline?
A: A break may point to a change in the trend, or the trend may go on. IQ Option’s blog says traders consider a breakout strategy when the price breaks through the trend support. A single candle does not tell you which it is, so wait for confirmation.
Q: Is there a stop loss on a trendline trade?
A: A binary option has no stop loss or take profit. A CFD (margin) trade has both, and you choose where to place them.