

One pattern that commonly develops along trends is the stair step pattern. This guide will show you what it looks like and an easy way to trade it using a trendline.
One of the skills every trader must acquire is identifying patterns on the price chart. If you trade long enough, you’ll notice certain patterns repeating themselves almost at the same time interval every day. This could be in the morning hours, afternoon or evening. If you notice such a pattern on IQ Option, it’s best to develop a strategy to profit from it each time it develops.
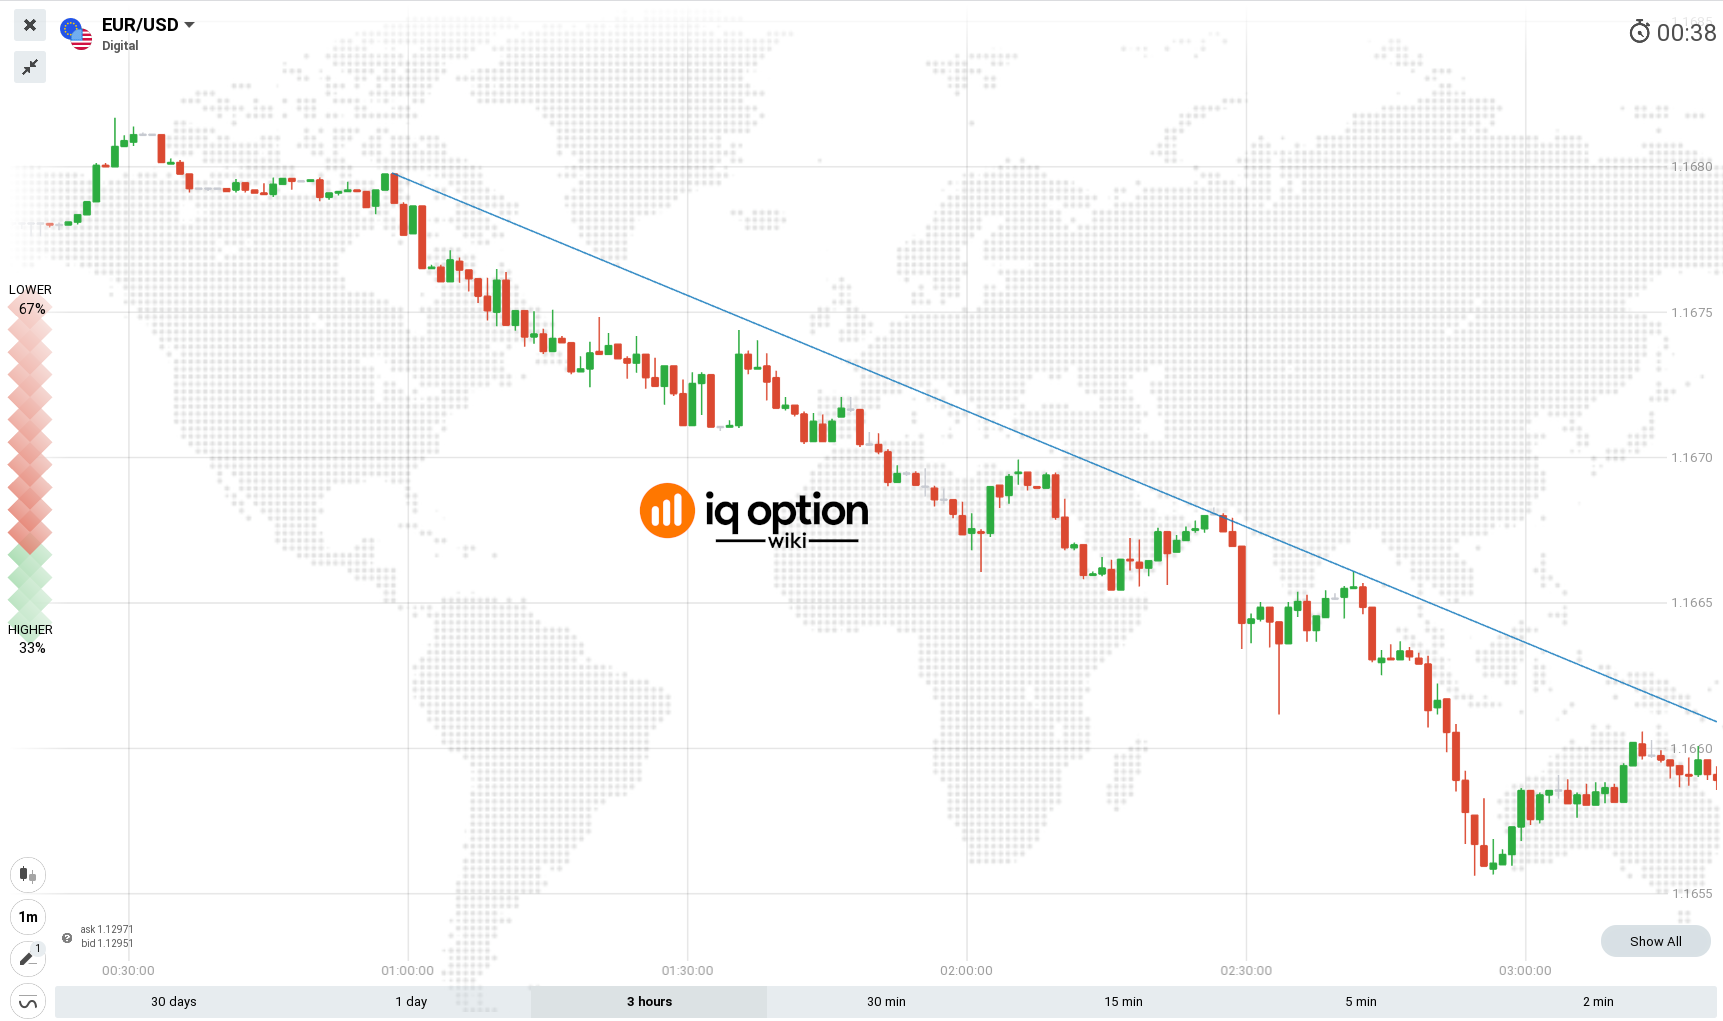 Trendline on downtrend
Key Takeaways🔑
| →Stair step pattern is a common trend-based pattern that can be traded using trendlines. |
| →Identifying support and resistance levels is crucial for trading the stair step pattern effectively. |
| →Combining stair step pattern with other technical analysis tools can lead to more accurate trading decisions. |
What is a stair step pattern?
The stair step pattern develops along with a trend. In the case of a downtrend, prices will experience sharp drops (long consecutive bearish candles) followed by price adjustments in repeating cycles. The result is a pattern that looks like stairs steps. The price adjustment zones will create new support and resistance levels from which breakouts occur continuing the trend.
Take a look at the chart below.
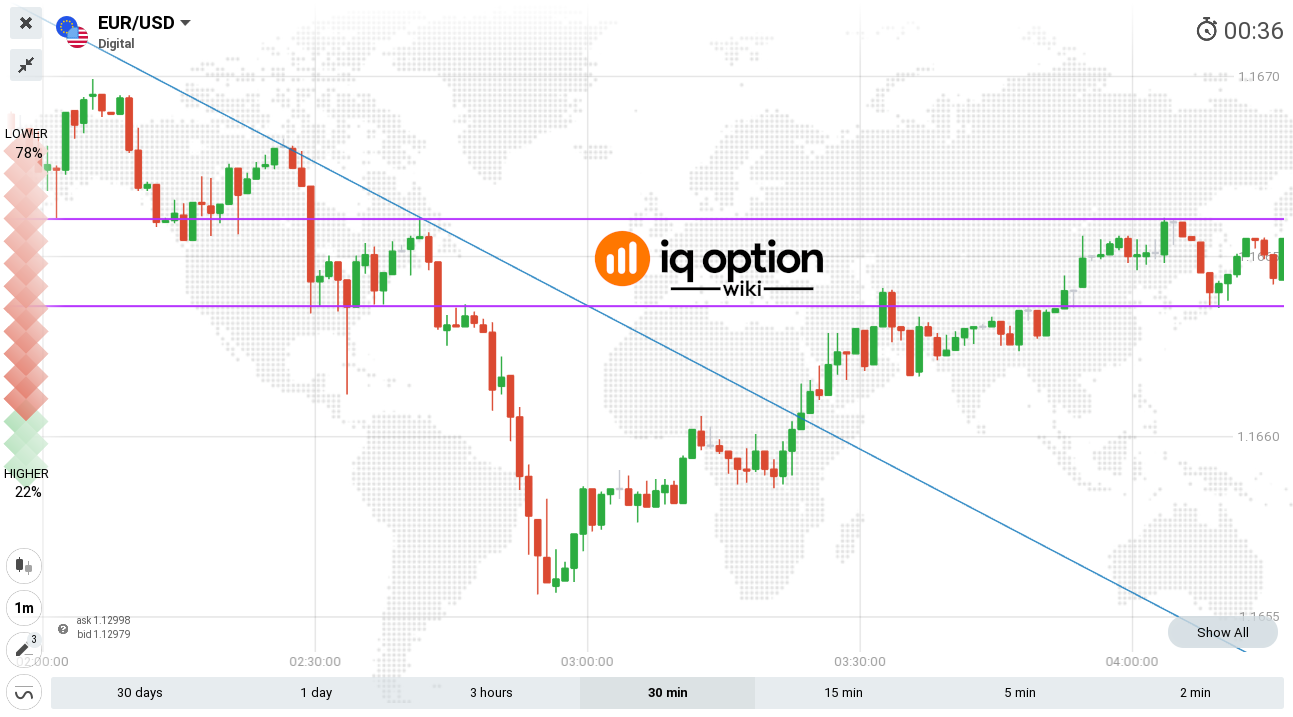 Stair step pattern
You’ll notice that once a trendline is drawn to connect the lower highs in the downtrend above, the line touches the breakout points of the resistance levels. These breakouts occur after a period of price adjustment before the trend resumes downward movement. Right where the breakout occurs, you’ll notice that the pattern looks like the steps on a staircase.
Looking at the stair steps pattern alone doesn’t give you much information. But coupled with the trendline, you will have an idea about where prices are likely to breakout and continue with the previous trend.
How do you trade with a step chart?
Using the chart below, you’ll notice that a stair steps pattern has developed along with the downtrend. A similar pattern forms when the trend finally reverses adopting an uptrend. So how do you trade this pattern?
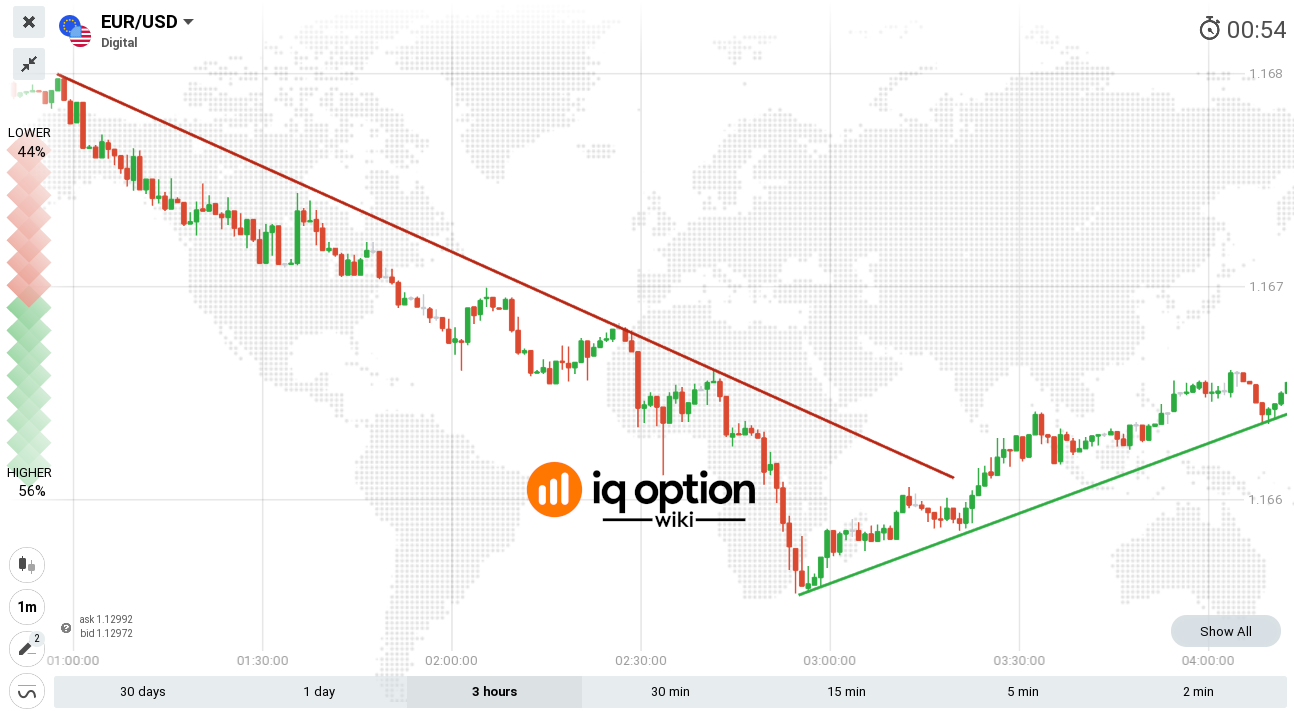
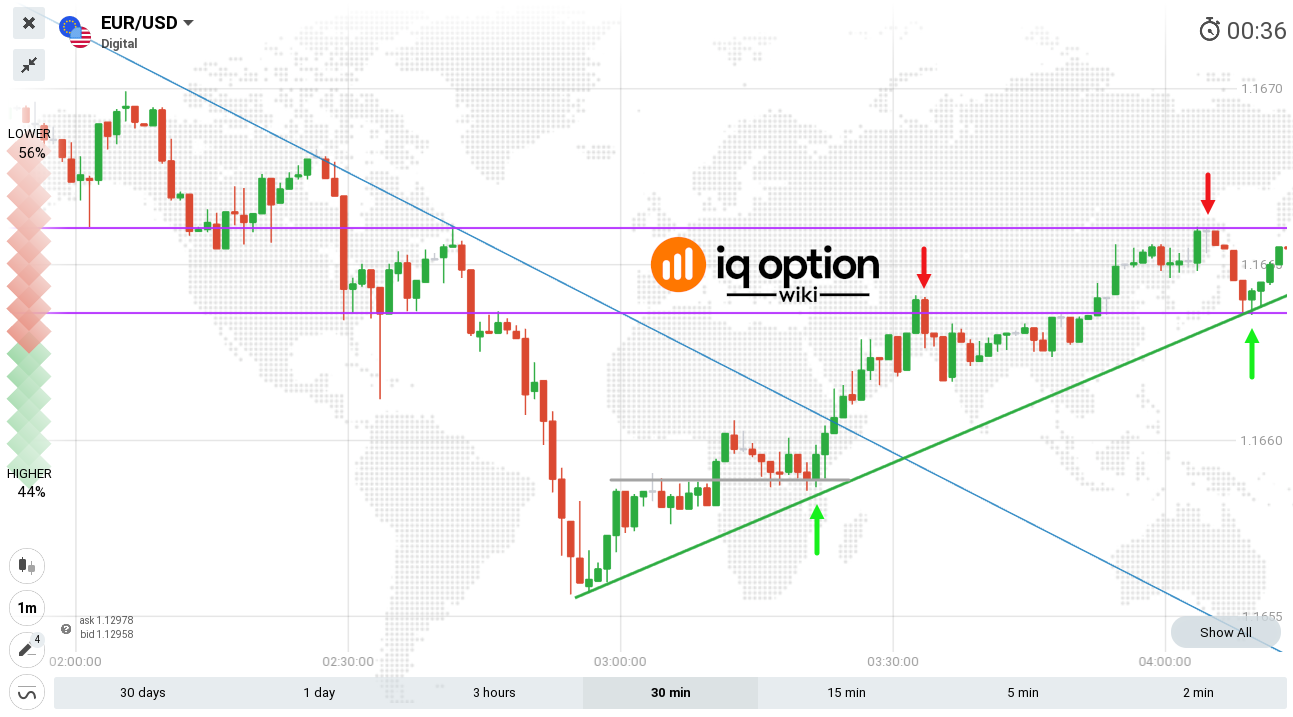
First, you’ll need to draw the support and resistance levels that form along with the trend. Take a look at the chart below.
Pros and Cons of the Stair Step Pattern 🔍
| Pros 😊 | Cons 😞 |
|---|---|
| Easy to identify on a price chart | Not always reliable on its own |
| Helps to identify support and resistance levels | Requires additional technical analysis tools for better accuracy |
| Can be used in both uptrends and downtrends | May not work well in highly volatile markets |
| Stair Step Pattern Strategies 📈 | Tips for Success 💡 |
|---|---|
| Trading breakouts at support/resistance levels | Combine with other technical indicators for better accuracy |
| Using trendlines to confirm entry points | Monitor overall market trend and sentiment |
| Trading reversals after a stair step pattern ends | Practice risk management and set appropriate stop-loss levels |
Enter long sell positions when the trendline touches a breakout point on a downtrend
After the price adjustments occur along with the downtrend, a sharp price drop follows (breakout) creating new resistance levels. Right where the price breaks out is the perfect place to enter a long sell position. You know that the trend will continue moving down once the breakout occurs. If you’re using 1-minute interval candles, your trades should last 5 minutes or more.
Enter short sell positions when prices touch resistance levels on an uptrend
Once the trend finally reverses, you’ll notice that price adjustments along the uptrend will occur at around the same resistance levels that formed during the downtrend. Once prices touch these levels, you should enter short sell positions lasting 1 to 5 minutes.
Enter long buy positions when the trend finally reverses
Still using the chart above, the downtrend finally ends and a new uptrend develops. At the point of reversal, you should enter a long buy position.
You’ll also notice that there will be some price adjustments along the new trend forming new support and resistance levels. Here, you can enter short sell positions as described above.
Trading the stair-step pattern with the trendline is an easy way to identify possible trade entry points along with a trend. The stair steps pattern also makes it easy to identify support and resistance levels which can be used to enter short positions.
Now that you’ve learned how to trade using the stair step pattern with the trendline, try this strategy on your IQ Option practice account today. We’d love to hear your views about this strategy in the comments section below.
Good luck!
📈 More Chart Patterns
Frequently Asked Questions 🤔
- Q: What timeframes work best for trading the stair step pattern?
A: The stair step pattern can be observed across various timeframes. However, higher timeframes such as 1-hour or 4-hour charts may provide more reliable signals. - Q: How can I improve the accuracy of my trades when using the stair step pattern?
A: Combine the stair step pattern with other technical analysis tools, such as moving averages or RSI, to confirm entry points and improve accuracy. - Q: Can I use the stair step pattern for both long and short trades?
A: Yes, the stair step pattern can be used to trade both long and short positions, depending on the direction of the trend. - Q: How can I manage risk when trading the stair step pattern?
A: Set appropriate stop-loss levels, monitor overall market sentiment, and use proper position sizing to manage risk effectively. - Q: Can the stair step pattern be used in all market conditions?
A: The stair step pattern works best in trending markets. It may not be as effective during periods of high volatility or range-bound market conditions.

