Last updated: 8 October 2026. Every screenshot below was recorded on 8 October 2026 on an IQ Option Practice account registered in Brazil, on 5-minute EUR/USD candles. We placed no real-money trade. Support and resistance are drawn by hand, so the tested box does not test hand-drawn levels. It tests a fixed rule that stands in for them (the lowest low and the highest high of the previous 60 candles) together with the Stochastic, and it shows what that rule did on 5-minute EUR/USD candles recorded from 29 September to 5 October 2026. It says nothing about what the rule will do next.
Support and resistance mark the prices where buyers or sellers have stepped in before, and the Stochastic oscillator shows whether the latest close sits near the top or the bottom of its recent range. The idea of this guide is to let price reach a level first and to use a cross of %K and %D below 20 or above 80 as the timing signal, not the other way round. The page shows the clicks that add the Stochastic and draw the levels on IQ Option’s chart, how to read the buy and sell conditions, and a test in which a fixed rule replaces the levels you would draw by eye.
Quick answer
- The pairing: support or resistance chooses the place and the Stochastic chooses the moment. Price comes first: if it closes through the level, an oversold or overbought reading does not rescue the setup.
- Buy (Higher): price touches support and closes back above it, and %K crosses above %D at or below 20.
- Sell (Lower): price touches resistance and closes back below it, and %K crosses below %D at or above 80.
- Stochastic defaults: Period K 13, Smoothing 3, Period D 3, levels 80 and 20, as the dialog showed on 8 October 2026 (the Quadcode repository lists 14). The test below uses a Period K of 14 and also runs the default 13.
- Levels are zones: IQ Option’s blog suggests a width of about 0.25 × ATR(14) and no more than five levels on the chart you trade.
- Test result: on 1,334 five-minute EUR/USD candles (29 September to 5 October 2026) the stand-in rule gave 48 scored trades (30 Higher, 18 Lower) with a three-candle expiry and won 26 (54.2%, no ties), level with the 54.1% break-even rate at an 85% payout; with the platform default Period K of 13 it gave 47 trades and won 26 (55.3%). A short replay predicts nothing. With 48 trades the win rate has a margin of error of about ±7 points (one standard error), so 54.2% cannot be told from break-even.
Stochastic Oscillator alongside Support and Resistance
Support is a price area where buyers have stepped in hard enough to stop a decline. Resistance is the mirror image: an area where sellers stopped an advance. IQ Option’s blog describes both as zones where buying or selling pressure has shown up often enough that, the next time price returns, something reactive tends to happen more often than not. They are tendencies, not physical walls, so the blog says to know where your idea is wrong before you enter. Traders use levels for rebounds and for breakouts (see the rebound pattern and how to identify breakouts); this guide trades rebounds.
The Stochastic answers a different question. It shows where the latest close sits inside the range of the last N candles, from 0 at the bottom to 100 at the top, and it knows nothing else: not the news, not the next candle, and not how far price will go before it turns. The blog says it is easiest to read when price is rotating between visible support and resistance, and it puts the order this way: support and rejection define the trade idea, and the oscillator describes the momentum change. If price closes below support, an oversold reading does not rescue the setup.
The same blog says indicators do not replace support and resistance. They summarize price action, so start from price structure and use an indicator, if at all, as a secondary filter. For drawing the levels, see how to draw support and resistance lines on IQ Option; for the indicator on its own, see the Stochastic guide.
How to use Stochastic Oscillator on IQ Option
These steps use the web traderoom on a Practice balance. The numbers in each screenshot match the numbers in the text.
Step 1: Open Chart analysis
Click the indicators button, the wave icon in the chart toolbar at the bottom left of the chart (1). The Chart analysis panel opens with the tabs Indicators, Templates, Widgets and Scripts.

Step 2: Find the Stochastic
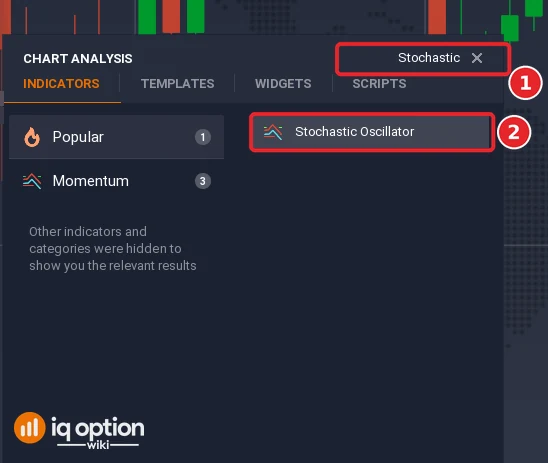
On the Indicators tab, type “Stochastic” into the search box, “Search for indicators” (1), and click the Stochastic Oscillator result (2). The indicator is also in the Popular and Momentum lists.
Step 3: Set up the Stochastic Oscillator and click Apply
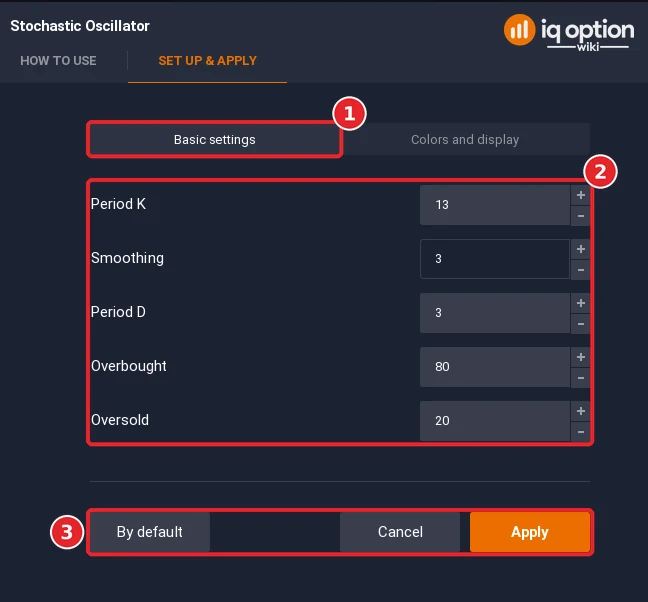
The dialog opens with the tabs How to use and Set up & apply, and the settings are on Basic settings (1). A new Stochastic starts with Period K at 13, Smoothing at 3, Period D at 3 and the levels Overbought at 80 and Oversold at 20 (2). The tested rule below uses a Period K of 14, the value the Quadcode repository lists, so change that one box from 13 to 14 if you want to follow the test exactly; a second replay with the default 13 is in the tested box. Line colours and widths are on Colors and display. Click Apply (3). The Stochastic appears in its own panel below the price chart.
Step 4: Open the drawing tools
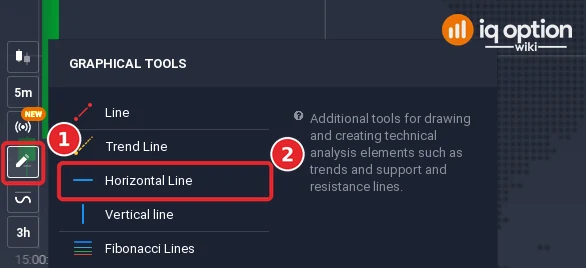
Click the drawing tools button in the chart toolbar (1) and choose the horizontal line tool (2). IQ Option’s blog uses the same tool, the horizontal line in its Graphical Tools menu, for support and resistance.
Step 5: Draw support and resistance
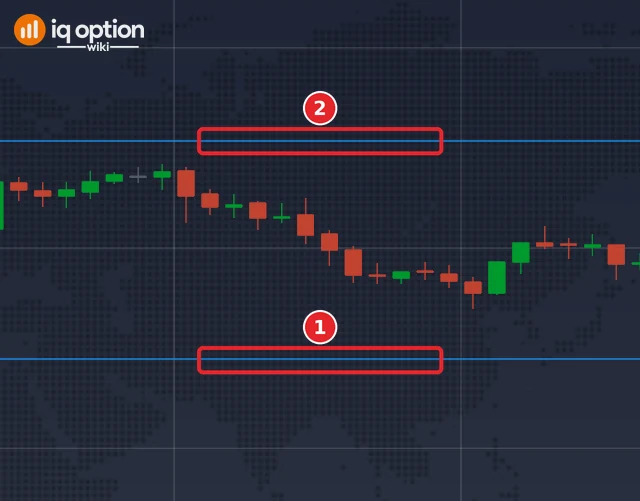
Look for the most recent swing low and swing high that anyone would agree on. A swing low is a trough with higher lows on both sides, a swing high is a peak with lower highs on both sides, and the ones worth marking were followed by a visible move away. Click at the price of the swing low to place support (1) and at the swing high to place resistance (2). IQ Option’s blog treats each level as a zone rather than a hairline, about 0.25 × ATR(14) wide as a starting point, and keeps at most five levels on the chart it trades. ATR(14) is the average true range of the last 14 candles, a measure of how far price has been moving.
Step 6: Choose the candle size
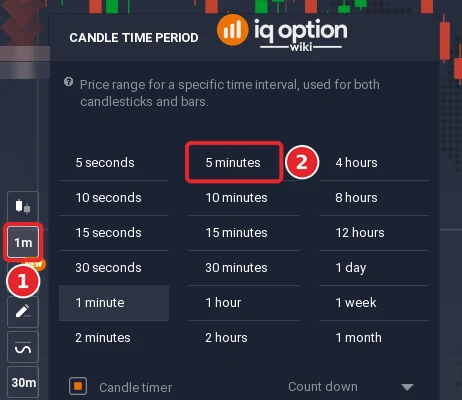
IQ Option’s blog uses two time frames: the levels come from a higher one and the entries from the lower one. For a 5-minute chart it looks at the 1-hour chart for context, and for a 15-minute chart at the 4-hour chart. Click the candle time period button (1) and choose 5 minutes (2) for entries.
Stochastic indicator buy and sell signals
How do you analyze a stochastic oscillator?
The panel has four things to look at: the %K line, the %D line and the two horizontal lines at 80 (overbought) and 20 (oversold). In the screenshots %K is the light blue line and %D the red line. Read them in this order:
- Where is %K? Near 100 the latest close is near the top of the recent range; near 0 it is near the bottom.
- Is %K above or below %D? %K above %D means the faster line is above its smoothed average, so short-term momentum has improved. %K below %D means it has weakened.
- Is the cross inside a zone? A cross of %K above %D below 20 says price has started to close higher in a range where it had recently been near the bottom. That is more specific than a cross in the middle of the range, but it still needs a price level that defines failure.
A buy condition is %K crossing above %D, and a sell condition is %K crossing below %D. Above 80 is not an automatic sell and below 20 is not an automatic buy: in a persistent advance prices often close near the top of their range, so the oscillator can stay above 80 for a long time.
Placing buy order on IQ Option
A buy order here means a Higher option, or a Buy on a margin asset. Three things have to be true together:
- Price reaches support: a candle’s low comes into the support zone, on the signal candle or on one of the two candles before it.
- Price rejects it: a candle closes back above the support. IQ Option’s blog says a touch is not a signal and a reaction is.
- The Stochastic %K crosses above %D at or below the oversold line (20).
Open the option after the candle that completes all three has closed. Name the price that proves the idea wrong before you do; here it is a close below the support. A binary option has no stop loss or take profit and closes at expiry. A CFD (margin) trade has both.
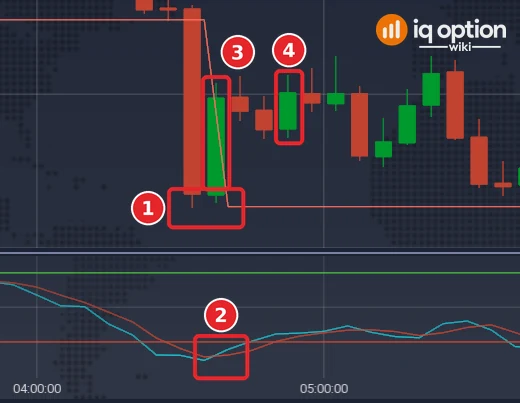
The first Higher signal of the test: a 5-minute EUR/USD candle that opened on 29 September 2026 at 07:35 UTC (04:35 on the platform clock, UTC-3). The candle before it, 07:30 UTC, fell to 1.13427, and that low is the Lowest Low (60) level, the stand-in for support. (1) The signal candle’s low, 1.13430, stopped just above that level, and it closed at 1.134975, back above it. (2) On its close %K crossed above %D at about 14, below the 20 line. (3) That candle is the entry candle: the replay opens the option at its close, 1.134975. (4) Three candles later, at the 07:55 UTC expiry (04:55), the closing price was 1.13501, 0.000035 higher, so the Higher option won, by a very small margin. The distance from the low to the level is a figure from the recorded candles, not something the screenshot shows.
The platform’s Stochastic lines matched a calculation from the highs, lows and closes of the candles, and a calculation from closing prices only did not match them, so the test calculates it the first way; the closes-only version gives a different list of signals.
Placing a sell order on IQ Option
A sell order here means a Lower option, or a Sell on a margin asset. The three conditions are the mirror image:
- Price reaches resistance: a candle’s high comes into the resistance zone.
- Price rejects it: a candle closes back below the resistance.
- The Stochastic %K crosses below %D at or above the overbought line (80).
Open the option after the candle that completes all three has closed. A close above the resistance shows that the idea has failed.
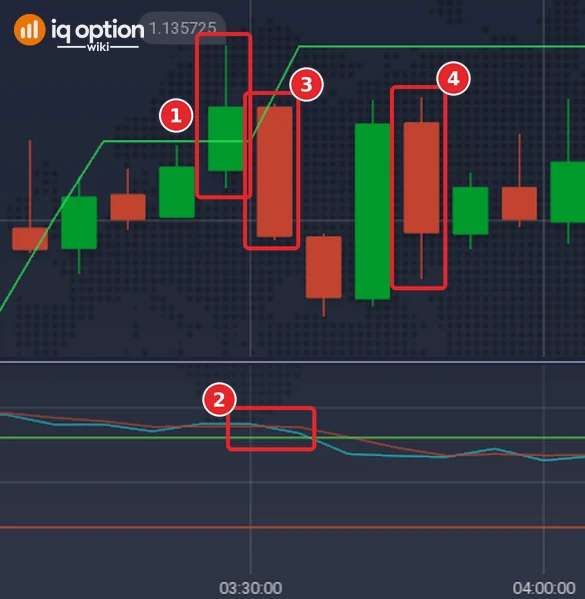
The first Lower signal of the test: a 5-minute EUR/USD candle that opened on 30 September 2026 at 06:30 UTC (03:30 on the platform clock, UTC-3). The candle before it, 06:25 UTC, rose to 1.13573 and closed at 1.13547, through the Highest High (60) level of 1.13533 that the 60 candles before it had set, and that level is the stand-in for resistance. (1) That candle touched the resistance, and the Highest High line steps up to its high on the next candle. (2) On the close of the signal candle %K crossed below %D at about 83, above the 80 line: %K was 82.9 and %D 87.1, after %K 89.1 and %D 87.5 one candle earlier. (3) The signal candle closed at 1.134935, back below 1.13533, and it is the entry candle: the replay opens the option at its close. (4) Three candles later, at the 06:50 UTC expiry (03:50), the closing price was 1.13495, 0.000015 higher than the entry, so the Lower option lost, by a very small margin. The values of the levels and of %K and %D are figures from the recorded candles, not something the screenshot shows.
How long to hold the option is not part of the rule; the tested box states the expiry used in the test.
Tested on IQ Option: 29 September to 5 October 2026
| Asset and candles | EUR/USD (binary), 5-minute candles recorded from IQ Option’s Practice traderoom, from 29 September 2026 01:55 UTC to 5 October 2026 17:05 UTC: 1,334 candles in two unbroken runs (the weekend gap separates them). |
|---|---|
| Support and resistance | Drawn by hand in the article, so the test uses a stand-in that a program can run: support is the lowest low and resistance the highest high of the 60 candles before a candle (the lines the platform’s Lowest Low and Highest High indicators draw with a period of 60). A candle touches a level when it comes within half an ATR(14) of it or goes beyond it. |
| Rule tested | Higher: on the signal candle the Stochastic (14, 3, 3, the value the Quadcode repository lists, calculated from highs, lows and closes as the platform’s chart values fit) %K crosses above %D at or below 20, one of the last three candles (this one included) touched support, and the signal candle closes above that support. Lower: the mirror at resistance, with %K crossing below %D at or above 80. Entry at the close of the signal candle, expiry three candles. |
| Signals | Stochastic (14, 3, 3): 48 scored signals, 30 Higher and 18 Lower. Stochastic (13, 3, 3), the platform default, same rule: 47 scored signals, 31 Higher and 16 Lower. |
| Outcomes | Stochastic (14, 3, 3): 26 wins, 22 losses, 0 ties; win rate 54.2% (26 of 48); net result per dollar staked at an 85% payout +$0.00 (+$0.03 at 91%). Stochastic (13, 3, 3): 26 wins, 21 losses, 0 ties; win rate 55.3% (26 of 47); net +$0.02 at 85% (+$0.06 at 91%). |
| Break-even | A trade has to win more than 1 / (1 + payout) of the time: about 54.1% at an 85% payout, 53.5% at 87%. Payout during the test: assumed to be 85%, because the replay placed no orders (IQ Option showed 91% for EUR/USD binary options expiring within about ten minutes on 5 October 2026 and 82% to 91% on options on 2 to 4 October; at 91% the break-even rate is 52.4%). |
This is a replay of a fixed rule on candles recorded from IQ Option’s Practice traderoom, not an order placed on the platform, and a fixed rule is not the same thing as levels drawn by eye. It used no real money and placed no order, so the result says nothing about what the rule will do next. Signals are not de-duplicated: neighbouring candles can each give a trade at the same level, and the trades overlap in time. The replay scores each trade from the close of the signal candle to the close at expiry, counts an equal close as a tie and ignores spread and delays. The Stochastic is calculated from the highs, lows and closes of the candles: a calculation from closing prices only did not match the values the platform’s chart showed. Signals within three candles of the end of a data run cannot be scored and are left out. With 47 or 48 trades one standard error of the win rate is about seven percentage points, so the two win rates are not different in any way the replay can show; both runs are reported because the guide and the platform name different default settings. A short test predicts nothing; IQ Option’s blog on backtesting says most strategies need dozens, often hundreds, of trades before the results mean anything. Nothing here is a promise of profit or of any win rate.
Pros and cons of the combination
| Pros | Cons |
|---|---|
| Price decides where to look, so a cross in the middle of a range is ignored. | Levels are placed by eye and take practice; two traders draw different ones. |
| The Stochastic adds timing evidence at the level. | False signals still occur: price can close through the level, and in a strong trend the Stochastic can stay at an extreme. |
| Both tools can be tried on the Practice balance without risking money. | In our replay of the stand-in rule on 1,334 five-minute EUR/USD candles it gave 48 scored trades and won 26 of them (54.2%), level with the 54.1% break-even rate at an 85% payout. |
BONUS: Typical concerns when using the Stochastic Oscillator
What is the best setting for stochastic oscillator?
No setting is right for every market. IQ Option’s blog says most traders start with the platform’s default settings and change them later to suit their own goals. On 8 October 2026 the platform’s dialog showed Period K 13, Smoothing 3, Period D 3 and levels 80 and 20, and the chart label read “Stoch (13, 3, 3)”; the Quadcode repository lists a %K period of 14, so the test below covers both 14 and 13.
Some traders move the levels in to 30 and 70, which marks the zones earlier and flags them more often. An earlier flag is not an earlier reversal: IQ Option’s blog warns that an asset can stay in the oversold or overbought zone for quite some time. The blog’s rule for any change is to state the problem the change solves and to apply the same settings to enough trades to count signal frequency, false starts and results after costs.
Is Stochastic a good indicator?
It does one thing correctly: it shows where the latest close sits inside its recent range. That is arithmetic on past prices, with no forecast in it, so whether it helps depends on the rule around it. IQ Option’s blog says a crossover is useful when it answers a question already visible on the price chart, and it lists when to pass on a Stochastic signal:
- price has no clear support, resistance or trend structure;
- the signal appears in the middle of a noisy range;
- a strong trend is pinning the oscillator at an extreme and the trade would fade it;
- the expected move is too small after spread and other costs;
- the price that would prove the idea wrong cannot be named.
Common mistakes
- Trading the touch. A touch is not a signal; the reaction is. Wait for the candle to close back off the level.
- Letting the oscillator overrule price. If price closes through the level, an oversold or overbought reading does not rescue the setup.
- Drawing the level after choosing the trade. IQ Option’s blog lists drawing levels to justify a trade you already wanted, and moving a level after price disagrees, among the mistakes it sees repeatedly. Mark levels first, decide later.
- Too many levels or hairlines. Keep at most five levels and draw zones, not single lines.
- Trading through news. The blog says economic releases disrupt normal behaviour for 10 to 30 minutes. Check the economic calendar first.
- Looking for a stop loss on a binary option. There is none; the option closes at expiry.
Related guides
- How to draw support and resistance lines on IQ Option
- Stochastic oscillator settings and reversals on IQ Option
- Double Stochastic strategy
- RSI with support and resistance
- Pin bars at support and resistance
- Time frames on IQ Option
- All indicator guides and all strategy guides
Frequently Asked Questions
Q: What is the Stochastic Oscillator?
A: A momentum indicator that shows where the latest close sits inside the high-low range of the last N candles, on a scale from 0 to 100. It draws a %K line, a %D line that averages it, and two levels, by default 80 and 20.
Q: How does the Stochastic Oscillator work with support and resistance levels?
A: The level chooses the place and the Stochastic chooses the moment. Price has to reach the level and close back off it first; then a cross of %K and %D at or below 20 (at support) or at or above 80 (at resistance) is used as the timing signal. It does not make the level hold.
Q: What are the default settings of the Stochastic Oscillator on IQ Option?
A: On 8 October 2026 the dialog showed Period K 13, Smoothing 3, Period D 3, Overbought 80 and Oversold 20. The Quadcode repository lists a %K period of 14, so read the dialog on your own platform. Step 3 above shows it.
Q: How can I set up the Stochastic Oscillator on the IQ Option platform?
A: Click the indicators button at the bottom left of the chart, search for Stochastic, click it, check the settings on Basic settings and click Apply. Steps 1 to 3 above show each click.
Q: What is the formula for the Stochastic Oscillator?
A: Raw %K = 100 × (Close − Low N) ÷ (High N − Low N). %K is a simple moving average of raw %K over the smoothing period and %D is a simple moving average of %K over the %D period.
Q: Can the platform draw support and resistance for me?
A: Not levels judged by their reaction. The Other list has Highest High and Lowest Low indicators that plot the highest and lowest price of the last N candles. They are mechanical lines, and the tested box uses lines of that kind as a stand-in for hand-drawn levels.
Q: Does combining the Stochastic with support and resistance raise the win rate?
A: We cannot say, and none of the IQ Option articles used for this guide gives a win rate for this pairing. IQ Option’s blog says support and resistance do not tell you what will happen; they tell you where the odds shift and where risk is cheapest to define. The tested box shows what one fixed rule did on the candles recorded for this page.
Q: What win rate does a trade need to break even?
A: A binary option pays a fixed percentage. At an 85% payout a trade needs to win more than 54% of the time to break even (1 ÷ 1.85); at 87% the figure is 53.5%. Read the payout next to the asset when you trade.
Q: What should I consider when using the Stochastic Oscillator in a strategy?
A: The candle size you trade and the higher time frame you take levels from, the settings, whether price shows a clear level or trend structure, and where the idea is wrong. Skip a signal in the middle of a noisy range or when a strong trend is pinning the oscillator at an extreme.