Last updated: 8 October 2026. Every screenshot below was recorded on 8 October 2026, between 13:15 and 13:30 on the traderoom clock, on an IQ Option Practice account registered in Brazil, and we traded no release. The times in the calendar follow the traderoom clock, which is UTC minus three hours. This guide has no tested box: a calendar is read, not replayed, and we did not trade any release. Nothing here is a promise of profit.
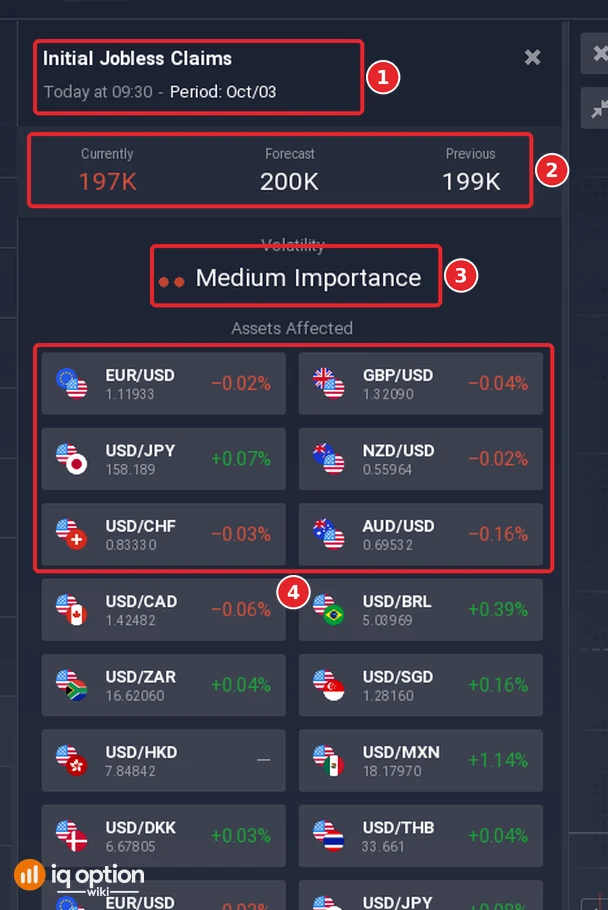
The Economic calendar of IQ Option lists the data releases of the coming hours and days, with their forecast, their previous value and an importance rating, and it opens from the Market analysis button of the left panel. This guide shows where to find it, what each part of an event means and how the earnings calendar next to it differs. On the day we recorded, an event released at 09:30, the weekly Initial Jobless Claims, was rated Medium Importance and showed 197K against a forecast of 200K and a previous value of 199K.
Quick answer
- Where: Market analysis in the left panel, then the dollar-sign tab for the Economic calendar; News and Earnings calendar are the tabs beside it.
- The list: flag, report name, time (traderoom clock, UTC-3 on our account) and one to three dots (Low, Medium, High Importance); past events are greyed and the next one has a red time.
- An event page: the period, Currently, Forecast and Previous, the importance in words and the Assets Affected. Currently shows a dash until the release.
- Our example: Initial Jobless Claims on 8 October 2026 at 09:30, Medium Importance: Currently 197K, Forecast 200K, Previous 199K.
- Earnings calendar: companies by reporting day with Currently, Forecast and Previous; the cards do not label the unit.
- Not tested: we did not trade any release.
Where are the calendars on IQ Option?
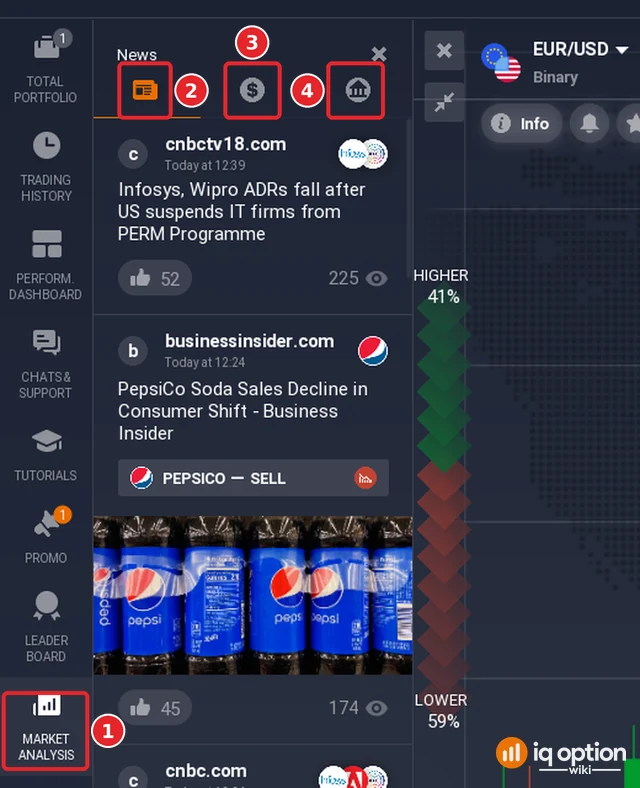
The calendars are in the Market analysis section. Click Market analysis (1) in the left panel. A panel opens with three tabs: News (2), Economic calendar (3) and Earnings calendar (4). The panel opens on News, a feed of articles with their source, time, headline and a picture. Our guide on trading the news shows one article in detail.
How do you read the economic calendar?
Step 2: The list of events
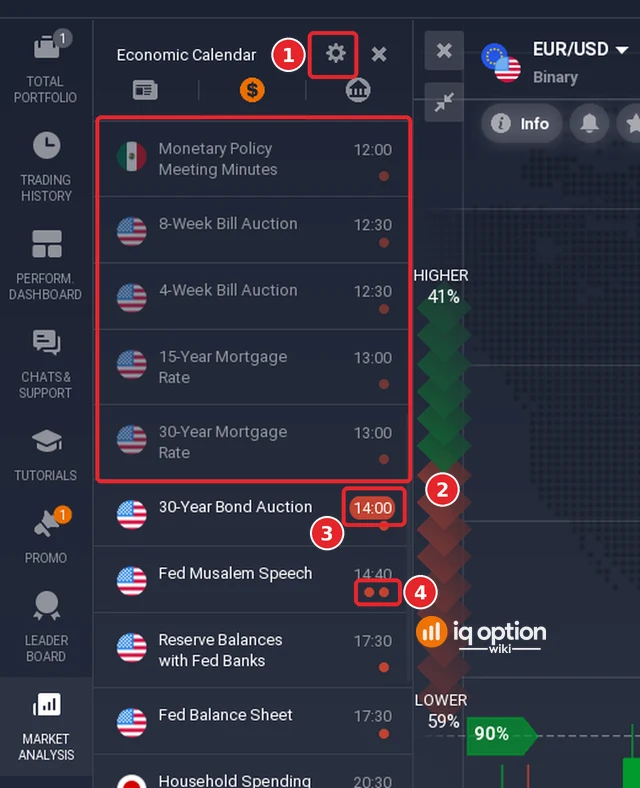
Click the second tab, the dollar sign. The list shows one row per release, in time order: the flag of the country that publishes it, the name of the report, the time and one to three dots that rate its importance. Releases that have already come out are greyed (2); the next one has its time in a red pill (3), here the 30-Year Bond Auction at 14:00; the days after today are separated by a date line such as 9 OCTOBER. The dots (4) are the rating: one dot reads Low Importance, two dots Medium Importance and three dots High Importance. The gear at the top (1) opens the filter; see our guide to the market analysis filters.
Step 3: The page of one event
Click the name of a report. A page opens beside the list. Its title (1) gives the name, the day and time, and the period the figure covers: Initial Jobless Claims, Today at 09:30, Period: Oct/03. Under it come three values (2): Currently, Forecast and Previous. For an event that has been released, Currently holds the figure; in ours 197K, against a forecast of 200K and a previous value of 199K. For one that has not, such as the Michigan Consumer Sentiment Prel of the next day, Currently shows a dash. The numbers are shown in red or white, and the page does not explain the colours; in the two events we opened, this one and the next day’s Michigan Consumer Sentiment (forecast 47.6 against a previous 48.1), the red figure was the one lower than the figure beside it, and we did not see a green one.
Below the values come the Volatility line (3), which gives the rating in words, Medium Importance for jobless claims, and the Assets Affected (4): a grid of currency pairs with the current price and a percentage in red or green. The page does not say over what period the percentages are measured, and we read it about four hours after the release, so we do not use them to say what the release did. At the bottom, a short paragraph headed In Numbers, auto-translated into English, with a Show Original link, gives background on the figure.
As a rule of thumb, a result better than the forecast can lift the currency and a worse one can weigh on it, with an exception for unemployment figures, which are better for the currency when they are lower than the forecast. In our example the claims came out below the forecast, 197K against 200K, which the rule reads as good for the dollar. We cannot say whether the market read it that way: the percentages next to the pairs are not dated, and a single release proves nothing.
What is the earnings calendar?
Step 4: Companies and their results
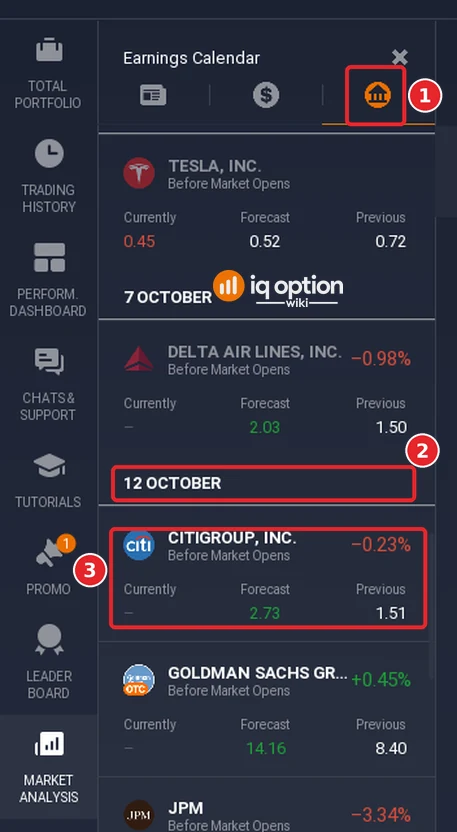
The third tab (1), the bank icon, is the Earnings calendar. It groups companies by the day they report (2) and shows for each a card (3): the company name, “Before Market Opens” under it, a percentage at the right and three figures, Currently, Forecast and Previous. The percentage at the right sits in red or green like a price change; the page does not explain it, so we do not interpret it. Tesla, in the first card, reported before our recording: Currently 0.45 against a forecast of 0.52 and a previous 0.72. Citigroup, due on 12 October, showed a dash for Currently, a forecast of 2.73 and a previous 1.51.
EPS means earnings per share, a figure that companies publish in their financial reports. The cards do not label the unit, so we cannot say whether their three figures are EPS, and we did not test how a result above or below the forecast moves the share.
How do the usual releases move the market?
The table gives the usual reading of the main releases. It is a general rule of thumb, not something the platform shows, and any single release can do the opposite.
| Release | Usual reading |
|---|---|
| Gross domestic product (GDP) | Faster growth can lift the currency and share prices. |
| Unemployment rate | A higher rate can weigh on the currency and on share prices; claims and the rate are better for a currency when they are lower than forecast. |
| Inflation rate | Higher inflation can lead central banks to raise interest rates, which affects currencies and bonds. |
| Interest rates | Higher rates can support a currency, lower rates can weaken it. |
| Company earnings | Results above the forecast can lift the share, results below it can pull it down. |
We did not trade any release, and this guide does not recommend doing so. The calendar is most useful for knowing when a release is due.
Pros and cons of the economic calendar
| Pros | Cons |
|---|---|
| It is built into the platform: one click from the chart, no second website. | The page gives no unit or colour key for some figures: the red numbers and the earnings percentages are not explained. |
| Each event shows a forecast, a previous value and an importance rating before the release. | The percentages of the Assets Affected have no stated period, so they do not show what a release did. |
| Past events are greyed and the next one is marked, so the list is quick to scan. | An importance rating says a release may move prices, not in which direction. |
| The filter lets you keep only the events and countries you follow. | The forecast is only a forecast: the result can differ a lot. |
Common mistakes
- Trading the minute of the release because the rating is High. The rating says a release may move prices, not which way.
- Forgetting the time zone. The calendar follows the traderoom clock, UTC minus three hours on our account; a 09:30 release is not at 09:30 local time everywhere.
- Reading the Assets Affected percentages as the reaction to the release. The page does not date them.
- Mixing up the two calendars. The economic calendar covers countries and their reports; the earnings calendar covers companies whose shares are on the platform.
- Treating the forecast as the result. It is the value expected before the release; Currently is the result.
Related guides
- The market analysis feature on IQ Option
- How to trade the news on IQ Option
- Trading stocks with CFDs on IQ Option
- Leading and lagging indicators
- All strategy guides
Frequently Asked Questions
Q: Where is the economic calendar on IQ Option?
A: Click Market analysis in the left panel and then the dollar-sign tab. The News and Earnings calendar tabs are beside it.
Q: What do Currently, Forecast and Previous mean?
A: Currently is the released figure, and shows a dash until the release. Forecast is the figure expected before the release. Previous is the figure of the earlier release.
Q: What do the dots mean?
A: The importance of the release: one dot Low, two dots Medium, three dots High. The page of an event spells it out as, for example, Medium Importance.
Q: What does a red time mean in the list?
A: In our screenshot the next event of the list had its time in a red pill. The platform does not explain it; we read it as the next release.
Q: Does the platform tell me which way a release will move a pair?
A: No. It lists the pairs that a release may affect, with their prices and percentages, but not a direction.
Q: Should I trade during a release?
A: We did not test it, and this guide does not recommend it. A release can move prices sharply in either direction.