Last updated: 8 October 2026. Every screenshot below was recorded on 5 and 8 October 2026 on an IQ Option Practice account registered in Brazil, on 5-minute EUR/USD candles. We placed no real-money trade. The tested box replays two readings of the strategy on 5-minute EUR/USD candles recorded from 29 September to 5 October 2026; it says nothing about what they will do next.
The Bollinger Bands and RSI strategy puts Bollinger Bands (a 20-candle average with bands two standard deviations away) on the price chart and a 14-period RSI in a panel under it. One reading (Reading 1 below) waits for narrow bands while the RSI moves toward 20 or 80 and holds the trade for a long time. IQ Option’s own blog describes a different pairing (Reading 2 below): a close outside a band while the RSI is in its overbought or oversold zone, then a turn back. This guide shows how to set up both indicators on IQ Option’s current platform, writes each reading as a rule with numbers, and shows what each rule did on recorded EUR/USD candles.
Quick answer
- Setup: Bollinger Bands (period 20, deviation 2) on the price chart and RSI (period 14) in its own panel, on 5-minute candles.
- Reading 1, narrow bands and an RSI beyond 20 or 80: the bands were narrow on the candle before and the RSI closes below 20 (Lower) or above 80 (Higher), with 6 candles (30 minutes) to expiry.
- Reading 2, IQ Option’s blog pairing: a close outside a band with the RSI beyond 30 or 70, then a close back inside the bands. Our library script bollinger-rsi-reversal marks it.
- What the sources say: a band touch is not a signal, a squeeze shows low volatility but neither direction nor timing, and the RSI can stay above 70 or below 30 in a strong trend.
- Tested on IQ Option: a replay run on 8 October 2026 on 1,334 recorded 5-minute EUR/USD candles (29 September to 5 October 2026), with the platform’s formulas (RSI with EMA smoothing, Bollinger Bands with the sample deviation). Reading 1 gave 2 signals with the bands in the lowest quarter of their last 100 values, 9 with the lowest 40% and 11 with the lowest half (6 won, 5 lost). Reading 2 gave 62 signals, of which 32 won and 30 lost (51.6%), below the 54.1% break-even rate at an 85% payout. Both are far too few trades to separate skill from chance.
- Break-even: a trade has to win about 54.1% of the time at an 85% payout, and about 53.5% at 87%.
The idea of Bollinger Band and RSI strategy
Is Bollinger Bands a good indicator?
It is a measuring tool, and IQ Option’s blog is careful about what it measures. Bollinger Bands are a volatility indicator plotted around price. The middle band is normally a 20-period simple moving average of the close, and the upper and lower bands sit two standard deviations above and below it; the default settings are written 20, 2. The bands answer two questions: is the current price high or low compared with its recent range, and is recent volatility contracting or expanding. The blog says they do not tell you that price must reverse at a band and do not predict the direction of the next breakout, and that in a strong trend price can keep following one band.
What indicator works well with Bollinger Bands?
IQ Option’s blog on indicator combinations lists RSI with Bollinger Bands as its first example and advises choosing indicators from different groups instead of several of the same type. Bollinger Bands sit on the price chart and describe volatility. RSI sits in its own panel and compares recent gains with recent losses on a scale from 0 to 100 (see our RSI guide). The two are not fully independent, because both are calculated from closing prices: the bands show how stretched price is, and RSI adds a second view of the same stretch. The same blog adds that more indicators on a chart do not automatically improve results, because they can give different indications and confuse novice traders.
What you look at with both indicators
You look at two things: where price sits against the bands and how wide the bands are, and what the RSI reads. A squeeze, when the bands contract, shows that recent price variation is low compared with the same market’s recent history. IQ Option’s blog says a squeeze may come before a larger move, but that it does not give the direction or the timing of that move. In Reading 1 below the RSI is meant to supply the direction. To put a number on the squeeze you can use BandWidth, which is the upper band minus the lower band, divided by the middle band; a falling value means the bands are contracting. The blog does not use a universal threshold, because a 3% reading may be quiet for one asset and normal for another. It compares BandWidth with the same instrument and time frame over a fixed historical window, and the test below does the same.
Setting up Bollinger Bands and RSI indicators on IQ Option
These steps use the web traderoom on a Practice balance. The numbers in each screenshot match the numbers in the text. The calculation details come from the Quadcode Script library, which publishes the source code of the platform’s built-in indicators; the dialog values were read on the platform.
Step 1: Open Chart analysis
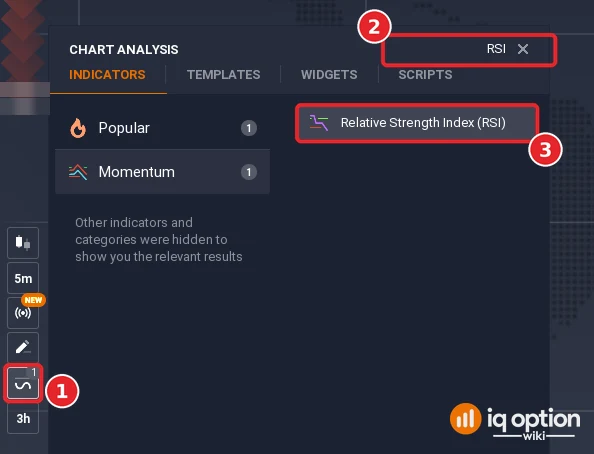
Click the indicators button (1), the wave icon in the chart toolbar at the bottom left of the chart. It opens the Chart analysis panel, which has the tabs Indicators, Templates, Widgets and Scripts and the lists Added, Popular, Momentum, Trend, Volatility, Moving Averages, Volume and Other.

Step 2: Find Bollinger Bands
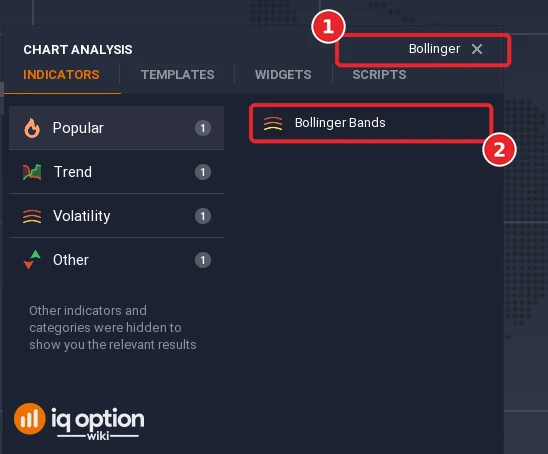
Type Bollinger in the Search for indicators box (1) and click Bollinger Bands (2). It is also in the Popular list.
Step 3: Set the period to 20 and the deviation to 2
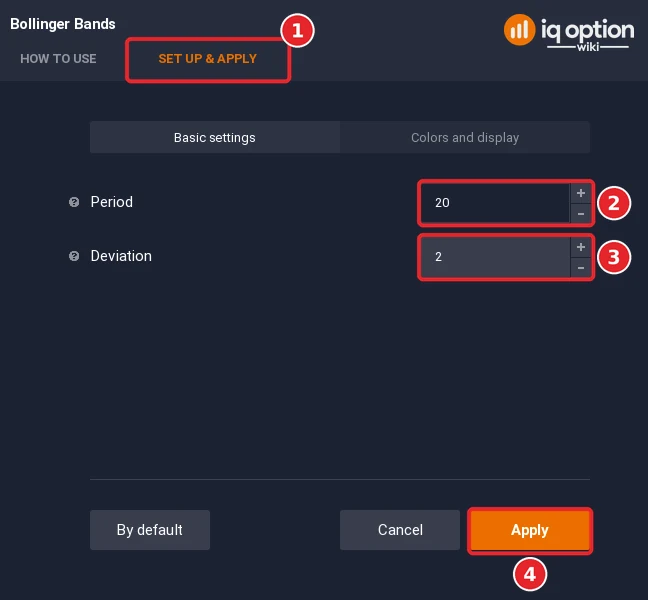
In the Set up & apply tab (1) set the Period to 20 (2) and the Deviation to 2 (3), then click Apply (4). The published source starts at a period of 20 and a deviation of 2, but the dialog opened with a period of 14 when we recorded it, so check the number instead of relying on the default. The dialog has no other number fields on Basic settings; the line colours are on Colors and display.
Step 4: Add the RSI
Click the indicators button (1) again, type RSI in the search box (2) and click the RSI result (3).
Step 5: Keep the RSI period at 14 and choose the levels
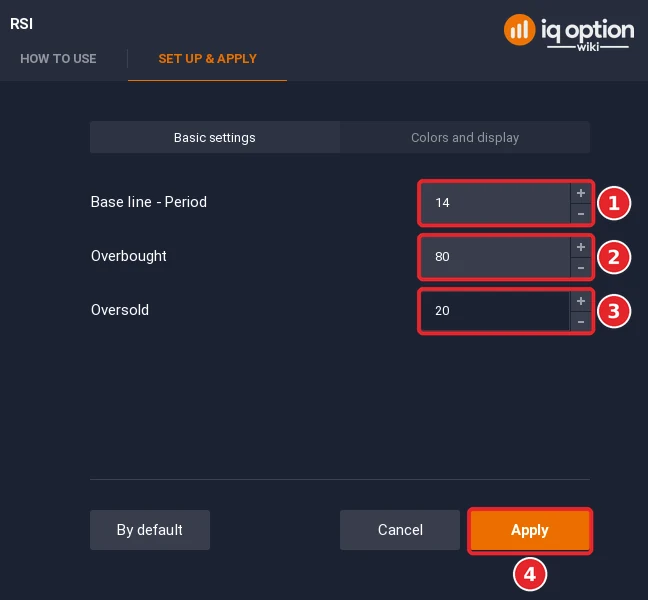
Keep the Period at 14 (1). The Overbought (2) and Oversold (3) levels start at 70 and 30. For Reading 1 below, set Overbought to 80 and Oversold to 20; Reading 2 uses 70 and 30. Click Apply (4).
Step 6: Use 5-minute candles
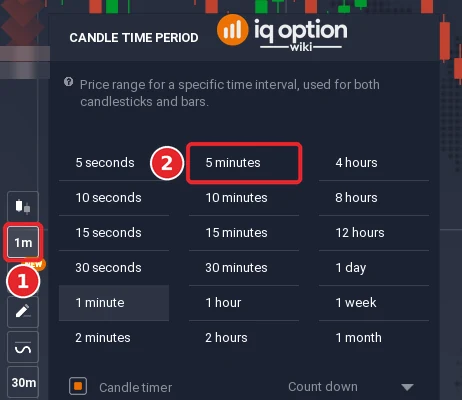
Click the candle time period button (1) in the chart toolbar and choose 5 minutes (2). The menu runs from 5 seconds to 1 month. The test below uses 5-minute candles.
Step 7: Read the chart
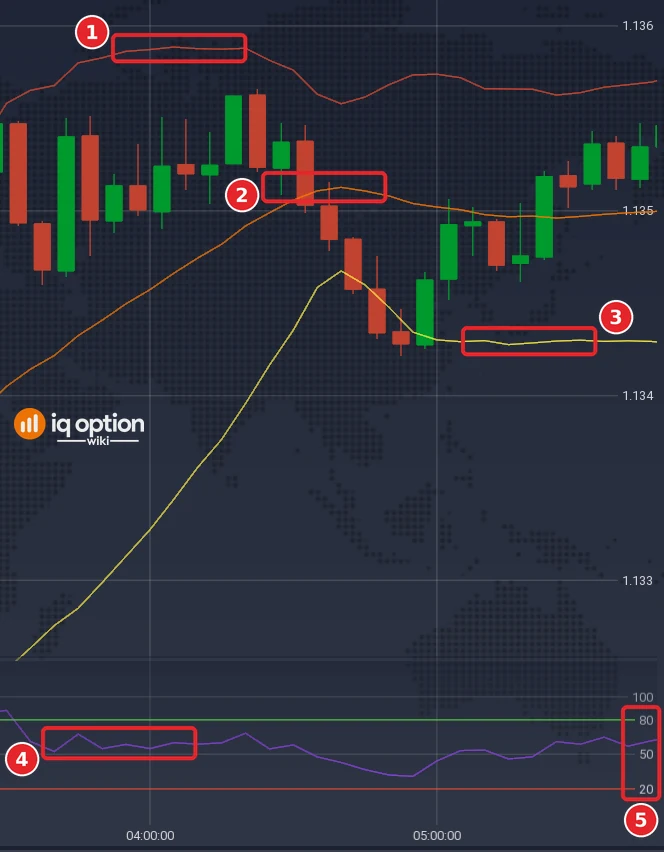
The bands are drawn on the price chart: the upper band (1), the middle line (2) and the lower band (3). The RSI is in its own panel under the chart: the RSI line (4) and its overbought and oversold lines (5).
Trading long-lasting positions using Bollinger Bands and RSI strategy on IQ Option
The idea behind Reading 1 is to look for a stretch where price is ranging and the gap between the bands narrows while the RSI falls below the 20 line or moves toward the 80 line. You then open a “long-lasting” position, one that runs for a long time compared with the chart’s candle: at least 10 minutes on a one-minute chart and at least 30 minutes on a five-minute chart. The test turns this idea into a rule with numbers for “narrow”, for the RSI move and for the expiry. The table sets Reading 1 beside the pairing that IQ Option’s blog describes for the same two indicators (Reading 2).
| Item | Reading 1: narrow bands and an RSI beyond 20 or 80 | Reading 2: IQ Option’s blog pairing |
|---|---|---|
| Candles | 5-minute candles | 5-minute candles |
| Indicators | Bollinger Bands (20, 2) and RSI(14) with lines at 80 and 20 | Bollinger Bands (20, 2) and RSI(14) with lines at 70 and 30 |
| Signal on a closed candle | The bands were narrow on the candle before (their BandWidth was in the lowest quarter of its last 100 values; the test also tried the lowest 40% and the lowest half) and the RSI closes below 20 or above 80 for the first time | The previous candle closed outside a band with the RSI beyond 30 or 70, and this candle closes back inside the bands as a bullish candle (Higher) or a bearish candle (Lower) |
| Direction | Lower after an RSI close below 20, Higher after an RSI close above 80 | Higher after a close below the lower band, Lower after a close above the upper band |
| Expiry | 6 candles (30 minutes), counted from the close of the signal candle | The same 6 candles, so the two can be compared |
| Where it comes from | The idea described above, written as numbers for this test | IQ Option’s blog on indicator combinations and our library script bollinger-rsi-reversal |
Reading 1 trades in the direction of the RSI move after a squeeze, which is a breakout idea. Reading 2 trades against a stretch, which is a reversal idea, so the two can give opposite answers on the same chart. The RSI move in Reading 1 is a close through the 20 or 80 line, not a divergence, which is a disagreement between price and RSI. However long it runs, no position can ensure that a trade ends in the money: a binary option has no stop loss and no take profit, and it pays or loses at its expiry.
Entering a long-lasting sell position on IQ Option
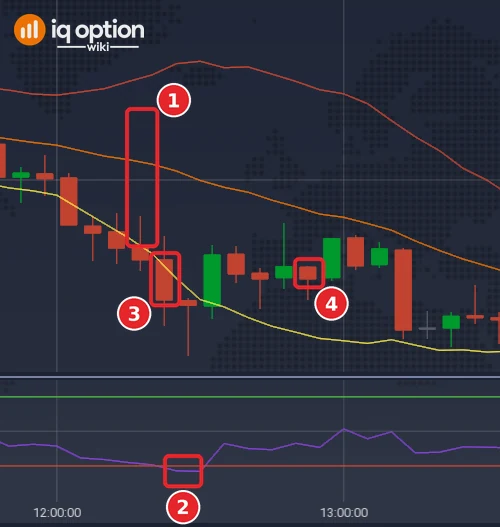
Reading 1 gives a Lower signal when the bands were narrow on the candle before and the RSI closes below 20 for the first time. You open a Lower option at the close of that candle with an expiry 6 candles later, which is 30 minutes on 5-minute candles. The first Lower signal in the replay, with “narrow” set to the lowest half of the last 100 BandWidth values (the run that gave 11 signals, see the tested box), is the 5-minute candle that opened at 12:20 platform time (15:20 UTC) on Tuesday 29 September 2026. The RSI closed at 15.7 (2), below 20, after 20.9 on the candle before, and the candle closed at 1.13312 below the lower band (3). The bands on the candle before are marked (1). The Lower option opened at that close and ran for 6 candles, to the candle marked (4), which closed at 1.133275, above the entry, so the trade lost.
Entering a long buy position on IQ Option
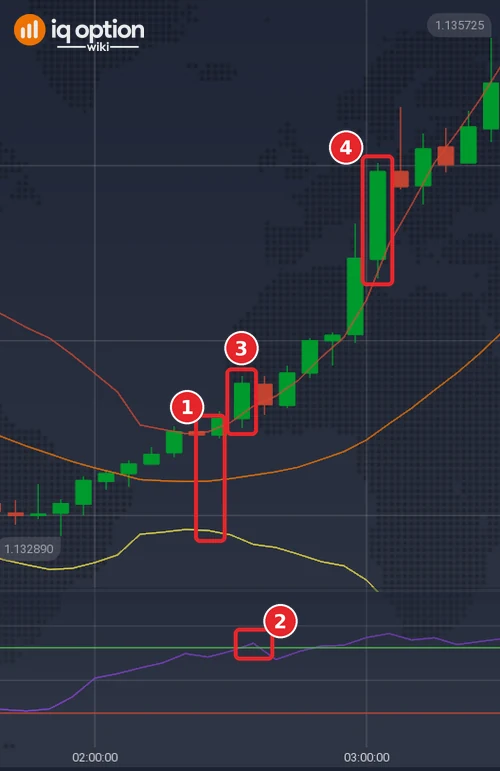
Reading 1 gives a Higher signal when the bands were narrow on the candle before and the RSI closes above 80 for the first time. You open a Higher option at the close of that candle with an expiry 6 candles later, which is 30 minutes on 5-minute candles. The first Higher signal in the same run is the candle that opened at 02:30 platform time (05:30 UTC) on Wednesday 30 September 2026. The RSI closed at 84.1 (2), above 80, after 76.8 on the candle before, and the candle closed at 1.133755 (3), after the bands had narrowed (1). The Higher option opened at that close and ran for 6 candles, to the candle marked (4), which closed at 1.134965, above the entry, so the trade won. Reading 1 gave only 2 Higher signals in the whole run, so one winner shows nothing about the rule.
A second reading: closing back inside the bands
IQ Option’s blog on indicator combinations describes the pairing like this. When candles cross the lower Bollinger Band and the RSI crosses the oversold level and starts moving up, it may be a possibility for a long position. When price crosses the upper band and the RSI is in its overbought zone and starting to reverse down, it may be a possible short trade or a reason to exit.
Our script library turns that into a chart script, bollinger-rsi-reversal, named “IQOW Bollinger RSI Reversal”. It marks HIGHER on a candle when the previous candle closed below the lower band (20, 2) with the RSI(14) below 30 and this candle closes back inside the bands as a bullish candle. LOWER is the mirror at the upper band with the RSI above 70 and a bearish candle. The script’s notes list 5-minute candles or longer as its time frame. They say it uses a standard stretch-and-return rule, and they warn that in a strong trend price can keep closing outside the bands, so a return inside can fail. You can import it as shown in our scripts guide.
Tested on IQ Option: a replay run on 8 October 2026
| Asset and candles | EUR/USD binary (regular, not OTC), 1,334 five-minute candles recorded from IQ Option’s Practice traderoom in two stretches: 29 September 2026, 01:55 UTC, to 2 October 2026, 20:55 UTC (1,093 candles), and 4 October 2026, 21:00 UTC, to 5 October 2026, 17:00 UTC (241 candles). Reading 1 was also run on 1,505 one-minute candles (2 October 18:23 to 20:59 UTC and 4 October 21:01 to 5 October 19:28 UTC). The replay places no orders; it scores each rule on closed candles, and it uses the platform’s formulas from the published source (Bollinger Bands with the sample standard deviation, RSI with EMA smoothing, factor 2 ÷ (n + 1)). Reading 1 signals start 150 candles into each stretch. |
|---|---|
| Reading 1: narrow bands and an RSI beyond 20 or 80 | 5-minute candles. Bollinger Bands (20, 2) and RSI(14). On a closed candle, the bands were narrow on the candle before (BandWidth in the lowest quarter of its last 100 values) and the RSI closes below 20 for the first time (Lower) or above 80 for the first time (Higher). Expiry 6 candles (30 minutes) from that close. |
| Reading 1: signals and outcomes | 2 signals with "narrow" set to the lowest quarter of the last 100 values (both Lower; 1 won, 1 lost). Relaxing it to the lowest 40% gave 9 signals (2 Higher, 7 Lower): 4 won, 5 lost. The lowest half gave 11 signals (2 Higher, 9 Lower): 6 won, 5 lost, none refunded; 54.5% of the 11 decided trades won and the net was about +$0.01 per $1 staked at an 85% payout, but with 11 trades a win rate anywhere from roughly 28% to 79% would fit the result (95% interval). On one-minute candles with a 10-candle expiry the same three thresholds gave 3, 4 and 8 signals (1 of 3, 2 of 4 and 5 of 8 won). The relaxed thresholds were chosen in advance because the first run gave fewer than about 10 signals, and all three are shown. None of these runs has enough trades to say whether the idea works. |
| Reading 2: the library script | 5-minute candles. The previous candle closed outside a Bollinger band (20, 2) with RSI(14) beyond 30 or 70, and this candle closes back inside the bands as a bullish candle (Higher, after a close below the lower band) or a bearish candle (Lower, after a close above the upper band). Expiry 6 candles (30 minutes) from that close. |
| Reading 2: signals and outcomes | 62 signals (37 Higher, 25 Lower), expiry 6 candles. 32 won, 30 lost, none refunded; 51.6% of the 62 decided trades won; net −$0.05 per $1 staked at an 85% payout. Higher: 17 of 37 won. Lower: 15 of 25 won. This is below the break-even rate; with 62 trades a win rate anywhere from roughly 39% to 64% would fit the result (95% interval). |
| Break-even | A trade has to win more than 1 ÷ (1 + payout) of the time: more than 54% at an 85% payout and about 53.5% at 87%. The replay assumes an 85% payout; payouts on options ranged from 82% to 91% between 2 and 4 October 2026. |
A short replay on one pair and about a week of candles proves nothing about the future. It replays candles recorded from IQ Option’s Practice traderoom on the dates above and placed no real orders. These numbers show how the two readings were counted and what they did on those candles; they do not promise a profit or a win rate for either reading. Reading 1 gave only a handful of trades and Reading 2’s 62 trades overlap in time and are too few to separate skill from chance. Repeat the test on your own Practice account, on more candles and more assets, before you trust either reading with money.
Pros and Cons of Bollinger Band and RSI Strategy
| What the pairing gives you | Where it falls short |
|---|---|
| Two different views: volatility from the bands and momentum from the RSI. | Both come from closing prices, so they can look at the same stretch and agree for the same reason. |
| Few settings: 20 and 2 for the bands, 14 for the RSI. | A close outside a band is not a signal by itself, and the RSI can stay above 70 or below 30 for a long time in a strong trend. |
| A rule you can write as numbers, which means you can replay it on past candles and count the result. | A squeeze gives neither direction nor timing, and different uses of the bands can give mixed or conflicting indications. |
| Indicator | Function |
|---|---|
| Bollinger Bands | A volatility indicator plotted around price: a moving average with a band two standard deviations above and below it. It shows where price sits against its recent range and whether volatility is contracting or expanding. |
| Relative Strength Index (RSI) | A momentum oscillator from 0 to 100. It compares recent gains with recent losses; on most charts above 70 is called overbought and below 30 oversold. |
What to remember when using Bollinger Bands and RSI strategy on IQ Option
- A binary option has no stop. It has no stop loss and no take profit, so the “long-lasting” part of this idea is really a choice of expiry. A CFD (margin) trade has both, and the test did not cover CFDs.
- No source says a longer expiry helps. The test counts wins and losses at the expiry, and the result is in the tested box.
- Know the break-even rate. At an 85% payout a trade has to win more than 54% of the time (1 ÷ 1.85), and at 87% about 53.5%. Payouts on options ranged from 82% to 91% when we looked from 2 to 4 October 2026.
- Change settings only with a test. IQ Option’s blog starts with 20 and 2 and changes them only when the complete rule can be tested on the instrument and time frame in use. Adjusting the bands until they fit one historical chart is not a test.
Related guides
- Trading with Bollinger Bands on IQ Option
- RSI indicator on IQ Option
- Bollinger Bands strategy with candle colours
- BB1 Bollinger Bands strategy
- Pin bar candles with Bollinger Bands
- Donchian Channel and RSI strategy
- IQ Option scripts, which explains how to import a library script
- All indicator guides and all strategy guides
Frequently Asked Questions
Q: Can the Bollinger Band and RSI strategy be applied to all financial instruments?
A: Both indicators are calculated from the candles of whatever chart you open, so you can draw them on any asset. That says nothing about whether either reading works on every asset; the test above covers EUR/USD on candles from 29 September to 5 October 2026.
Q: How can I avoid false signals when using this strategy?
A: You cannot remove them. IQ Option’s blog says a band touch is not a signal, that strong trends can produce repeated touches and closes outside either band, and that a reversal idea needs evidence from price and a defined invalidation level. A binary option has no stop loss, so decide before you buy which price would prove the idea wrong.
Q: Can I use this strategy for short-term trading?
A: No source we read says whether it suits short-term trading or scalping. The test above uses 5-minute candles and a 30-minute expiry, and the library script’s notes list 5-minute candles or longer; we also tried Reading 1 on one-minute candles with a 10-candle expiry, where it gave only 3 to 8 signals depending on how narrow the bands had to be, too few to say anything. Reading 2 was not tested on shorter candles.
Q: Do I need to be an expert to use the Bollinger Band and RSI strategy?
A: No, but you need to know what each indicator measures and what it does not. The sections above and our guides to Bollinger Bands and the RSI cover that. Practise on the Practice balance first.
Q: Which Bollinger Bands settings does this guide use?
A: A period of 20 and a deviation of 2, the standard version in IQ Option’s blog and in the published source. The dialog opened with a period of 14 when we recorded it, so type the number you want instead of trusting the default.
Q: What other indicators can be combined with Bollinger Bands and RSI?
A: IQ Option’s blog describes other combinations, such as the RSI with a simple moving average and MACD, and the bands as dynamic support and resistance. It also advises not to overdo it, because more indicators do not automatically improve results and can contradict each other. Add one thing at a time and test the complete rule.
Q: What win rate does a trade need to make money?
A: At an 85% payout it has to win more than 54% of the time to break even (1 ÷ 1.85), and at 87% about 53.5%. For scale, in our Practice test of seven other library strategies on 2 October 2026 (reported here), 29 of 70 one-dollar orders won. That was a different test and says nothing about this strategy.