Last updated: 8 October 2026. Every screenshot below was recorded on 8 October 2026 on an IQ Option Practice account registered in Brazil, on EUR/USD 1-minute candles; the Chart analysis picture in Step 1 was recorded on 5 October 2026. We placed no real-money trade. The tested box shows what a rule version of the strategy did on EUR/USD candles recorded between 29 September and 5 October 2026. The strategy gives no numbers for a pin bar, so the thresholds below are ours; the result says nothing about what will happen next.
A pin bar is a candle with a small body and one long wick: the price went far in one direction and was pushed back before the close. The strategy combines it with Bollinger Bands on 1-minute candles. When a bullish pin bar, with its long wick down, touches the lower band, it buys for one minute; when a bearish pin bar, with its long wick up, touches the upper band, it sells for one minute, ideally while the gap between the bands is widening. We wrote that as a rule and replayed it on 1,505 one-minute candles: 16 signals, and the 1-minute trades won 3 and lost 13, 18.8% of the decided trades. Eleven of the 16 signals were Higher trades and none of them won; eight of the eleven fell within one steep drop of EUR/USD on 4 and 5 October.
Quick answer
- Indicator: Bollinger Bands with the period changed from the platform’s 14 to 20; deviation 2.
- Pin bar: a small body and a long wick; bullish when the long wick is below the body, bearish when it is above.
- Higher: a bullish pin bar whose range contains the lower band; enter at its close for 1 minute.
- Lower: a bearish pin bar whose range contains the upper band; enter at its close for 1 minute.
- Bands: the gap between the bands should start widening, which is read as the start of a trend.
- Tested: 16 signals on 1-minute candles; 3 won, 13 lost (18.8% of the decided trades). On 5-minute candles 13 signals, 53.8%. Break-even is 54.1% at an 85% payout, and a few days of one pair prove nothing.
How do you set up pin bars with Bollinger Bands?
Set the chart
Choose the asset, the chart type and the candle size first: the indicator is calculated from the candles on the chart. The examples in this guide use 1-minute candles on EUR/USD. These steps use the web traderoom on a Practice balance, and the numbers in each screenshot match the numbers in the text. If you do not have an account yet, see how to register.
Step 1: Open Chart analysis
Click the indicators button (1), the wave icon in the chart toolbar at the bottom left of the chart. The Chart analysis panel opens with the tabs Indicators, Templates, Widgets and Scripts. Stay on Indicators.

Step 2: Find Bollinger Bands
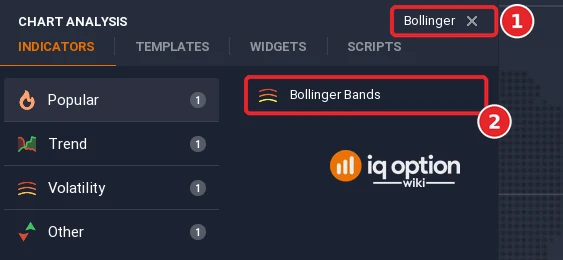
Type “Bollinger” in the Search for indicators box (1) and click Bollinger Bands (2).
Step 3: Keep the deviation at 2 and set the period to 20
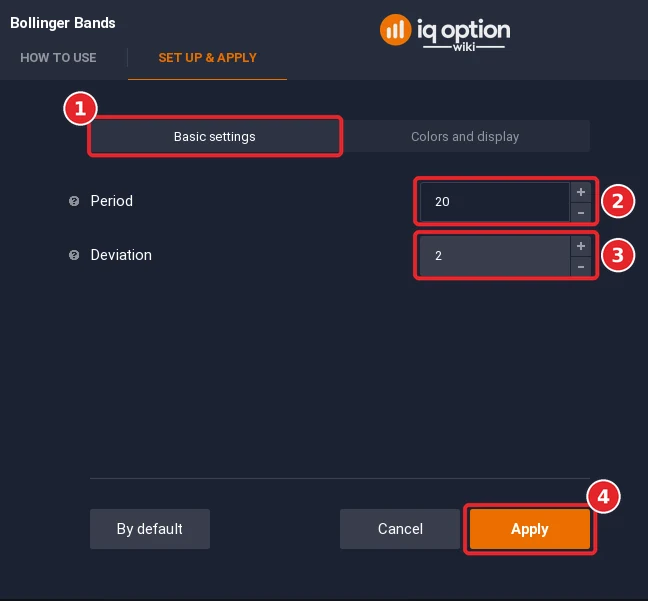
The dialog opens on the Set up & apply tab, on Basic settings (1), with Period 14 and Deviation 2. The strategy asks for a period of 20 and a deviation of 2: replace the 14 in Period (2), leave Deviation (3) at 2 and click Apply (4).
Step 4: Use 1-minute candles
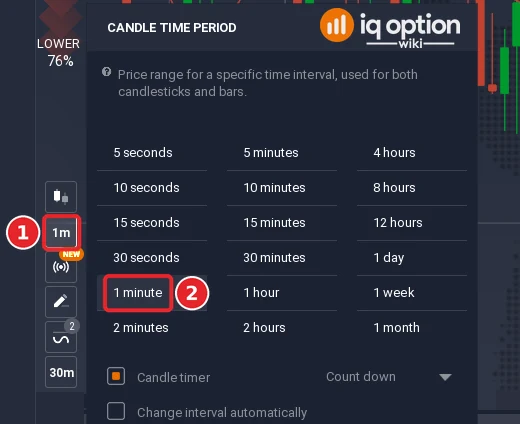
Click the candle time period button (1) in the toolbar at the left of the chart; it shows the current period. In the menu that opens, choose 1 minute (2). The strategy uses a Japanese candlestick chart with 1-minute candles and 1-minute trades.
Step 5: Read the chart
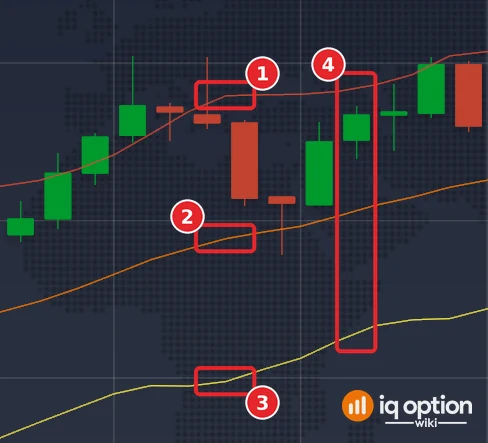
Three lines are drawn over the candles: the upper band (1), the middle line (2) and the lower band (3). The gap between the bands (4) grows when the price moves more; the picture shows 01:57 to 02:09 on 5 October, when the bands widen. A pin bar is a candle with a small body and a long wick.
What is a pin bar?
A pin bar is described by its shape: a small body and a long wick, also called a tail. The wick shows a price that was reached and rejected. A bullish pin bar has the wick at the bottom and the small body at the top: buyers pushed back a low price. A bearish pin bar has the wick at the top and the small body at the bottom: sellers pushed back a high price. Pin bars are not infallible and should be used with other tools, such as trend lines or moving averages, and at support or resistance.
What are the entry rules?
The Bollinger band is the place where a pin bar counts. When the upper band touches or crosses a bearish pin bar, sell for one minute, and the mirror holds for a bullish pin bar at the lower band. The gap between the bands should be widening, and the trade is entered at the close of the pin bar, which is the open of the next candle. Written so that every condition is checked on closed candles:
| Part | Usual rule | Our rule for the replay |
|---|---|---|
| Chart | 1-minute Japanese candles | 1-minute candles (we also scored 5-minute candles) |
| Indicator | Bollinger Bands, period 20, deviation 2 | The same |
| Bullish pin bar | A small body at the top, a wick at the bottom | The lower wick is at least twice the body and at least 60% of the candle’s range; the upper wick is no longer than the body or 10% of the range |
| Bearish pin bar | A small body at the bottom, a wick at the top | The mirror of the bullish rule |
| Size | Not given | The candle’s range is at least half the average range of the last 14 candles, so a flat candle does not count |
| Higher signal | A bullish pin bar where the lower band meets it | The pin bar’s range contains the lower band |
| Lower signal | A bearish pin bar where the upper band meets it | The pin bar’s range contains the upper band |
| Bands | The gap should start to widen | The gap between the bands is wider than on the previous candle |
| Entry and expiry | At the close of the pin bar, for 1 minute | The same |
Two signals of the recording, step by step
The first Higher signal and the first Lower signal of our rule on 1-minute candles, in time order, not picked by outcome. All times are the platform clock, which is UTC minus three hours.
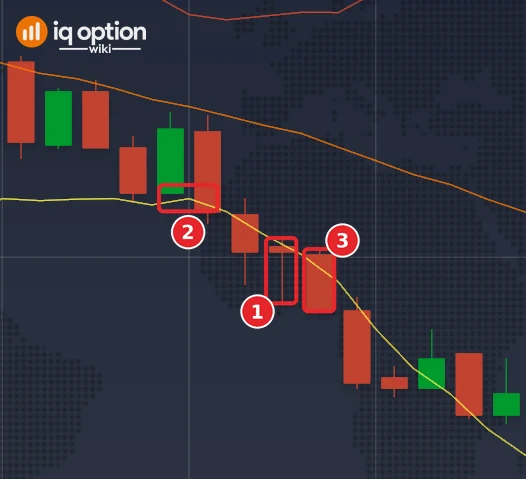
Higher signal, 4 October at 22:07
The candle (1) that opened at 22:07 and closed at 22:08 at 1.12401 had a body of 0.1 pip, an upper wick of 0.1 pip and a lower wick of 0.95 pip, a range of 1.15 pips: a bullish pin bar by our thresholds, with the lower wick more than nine times the body and 83% of the range. The lower band (2), at 1.124006, lay between its low (1.123915) and its high (1.12403), and the gap between the bands was 4.5 pips against 4.1 on the candle before: widening. All the conditions held, so the rule says Higher, and the 1-minute trade opens at that close. It ends at 22:09, when the candle (3) that opened at 22:08 closes at 1.1239, 1.1 pips lower: it lost.
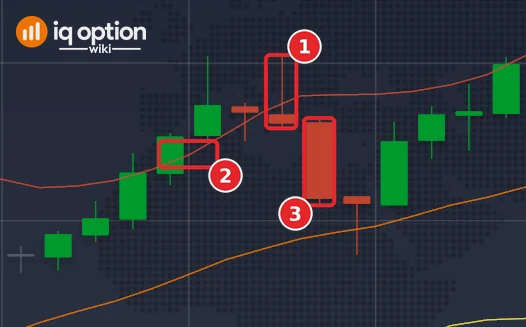
Lower signal, 5 October at 02:02
The candle (1) that opened at 02:02 and closed at 02:03 at 1.11831 had a body of 0.25 pip, an upper wick of 1.8 pips and a lower wick of 0.15 pip, a range of 2.2 pips: a bearish pin bar, with the upper wick more than seven times the body and 82% of the range. The upper band (2), at 1.118396, lay between its low (1.118295) and its high (1.118515), and the gap between the bands was 9.1 pips against 8.7: widening. The rule says Lower, and the 1-minute trade opens at that close. It ends at 02:04, when the candle (3) that opened at 02:03 closes at 1.11807, 2.4 pips lower: it won.
The pin bar rule, tested
We scored the rule on the 1,505 one-minute candles of our recording and on the 1,334 five-minute candles, entering at the close of every signal candle.
Tested on IQ Option: the pin bar and Bollinger Bands rule, EUR/USD candles of 29 September to 5 October 2026
| Asset and candles | EUR/USD binary (regular, not OTC): 1,505 one-minute candles (2026-10-02 18:23 to 2026-10-02 20:59 UTC and 2026-10-04 21:01 to 2026-10-05 19:28 UTC); 1,334 five-minute candles (2026-09-29 01:55 to 2026-10-02 20:55 UTC and 2026-10-04 21:00 to 2026-10-05 17:00 UTC). The candles were recorded from IQ Option’s Practice traderoom. The replay places no orders; it only scores the rule on those closed candles, at an 85% payout. |
|---|---|
| Rule tested | The rule on closed candles, the option opening at the close of the signal candle and lasting 1 minute: Higher on a bullish pin bar whose range contains the lower Bollinger band, Lower on a bearish pin bar whose range contains the upper band, when the gap between the bands is wider than on the previous candle. A pin bar has a lower (upper) wick of at least twice the body and 60% of the range, the other wick at most the body or 10% of the range, and a range of at least half the average range of the last 14 candles. Bollinger Bands (20, 2) as the platform draws them. The box lists 1-minute candles first, then the variants and 5-minute candles. |
| Signals | Pin bar at the band with widening bands, 1-minute candles, 1-minute trade: 16 signals (11 Higher, 5 Lower) same without the widening condition: 23 signals (16 Higher, 7 Lower) same, 5-minute candles, with widening bands: 13 signals (11 Higher, 2 Lower) same, 5-minute candles, without widening: 18 signals (14 Higher, 4 Lower) |
| Outcomes | Pin bar at the band with widening bands, 1-minute candles, 1-minute trade: 3 won, 13 lost, 0 tied; 18.8% of the 16 decided trades won; net −$0.65 per $1 staked at 85% (−$0.64 at 91%) same without the widening condition: 5 won, 18 lost, 0 tied; 21.7% of the 23 decided trades won; net −$0.60 per $1 staked at 85% (−$0.58 at 91%) same, 5-minute candles, with widening bands: 7 won, 6 lost, 0 tied; 53.8% of the 13 decided trades won; net −$0.00 per $1 staked at 85% (+$0.03 at 91%) same, 5-minute candles, without widening: 10 won, 8 lost, 0 tied; 55.6% of the 18 decided trades won; net +$0.03 per $1 staked at 85% (+$0.06 at 91%) |
| Break-even | At an 85% payout a trade needs to win more than 54.1% of its decided trades to break even (1 ÷ 1.85); at 91%, more than 52.4% (1 ÷ 1.91). |
A replay is only a look back at candles recorded on the dates above: it placed no real orders, covers about four and a half days of one pair, and counts overlapping trades as if they were independent. A short test proves nothing about the future, and no profit and no win rate is promised here. IQ Option’s own blog on backtesting says that most strategies need dozens, and often hundreds, of trades before a result means anything.
On 1-minute candles the rule gave 16 signals (11 Higher, 5 Lower): 3 won and 13 lost, 18.8% of the decided trades, with a 95% interval of 7% to 43%. Without the condition on the bands it gave 23 signals and 5 won (21.7%). All 11 Higher signals lost. Eight of them came between 22:07 on 4 October and 00:41 on 5 October (platform clock), while EUR/USD fell from 1.1242 to 1.1175; a bullish pin bar at the lower band was followed each time by a lower close. Of the 5 Lower signals, 3 won. On 5-minute candles there were 13 signals with the bands widening, and 7 won (53.8%).
These numbers come from a short, one-sided sample, and the signals cluster in a single move, so they do not show that pin bars at the band lose in general. They do show that the rule, a pin bar at the band bought or sold against the move, was not safe in a trending market.
Pros and Cons of pin bars with Bollinger Bands
| Pros | Cons |
|---|---|
| A pin bar is easy to see on the chart, and the band gives it a place. | The result depends on thresholds that are not given; ours are one choice among many. |
| Gives few signals, 16 on 1-minute candles, so there is little to over-trade. | A few signals in one trend can all lose: 8 of the 16 did, within three hours. |
| A fixed 1-minute trade that is quick to test on a Practice balance. | Pin bars are not infallible and should be confirmed with other tools. |
Common mistakes
- Calling any candle with a wick a pin bar. The body has to be small and the wick long compared with the range.
- Buying every bullish pin bar at the lower band in a falling market. In our recording eight of them lost in a row during one drop.
- Ignoring the gap between the bands. It should be widening, as the sign of a developing trend.
- Entering before the pin bar closes. A candle only becomes a pin bar when it closes; enter at its close.
- Trading it without a second tool. Trend lines, moving averages or support and resistance serve as confirmation.
Related guides
- Bollinger Bands on IQ Option and Candle colours with Bollinger Bands
- Pin bar candles and Trading candles on IQ Option
- Bollinger Bands with support and resistance
- All indicator guides and all strategy guides
Frequently Asked Questions
Q: What is a pin bar?
A: A candle with a small body and one long wick. A bullish pin bar has the long wick below the body, a bearish one has it above.
Q: Which Bollinger Bands settings does the strategy use?
A: A period of 20 and a deviation of 2. The platform opens the indicator with a period of 14, so change it in the dialog.
Q: How long should the trade last?
A: 1 minute on 1-minute candles, entered at the close of the pin bar.
Q: What does the widening of the bands mean?
A: The gap between the upper and lower band grows when the price moves more. It is read as the start of a trend.
Q: Does the strategy win?
A: Not in our replay. On 1-minute candles it gave 16 signals and 3 won, with eight of the losing Higher trades in one drop of EUR/USD. The sample is small and one-sided, but it is a reason to test on a Practice balance first.
Q: Can I use pin bars on 5-minute candles?
A: The platform draws them on any candle size. With the same rule our recording had 13 signals on 5-minute candles and 7 won.