
Last updated: 8 October 2026. Every screenshot below was recorded on 8 October 2026 on an IQ Option Practice account registered in Brazil, on five-minute EUR/USD candles. We placed no real-money trade. The tested box shows what two readings of the rule did when we replayed them on recorded five-minute EUR/USD candles from 29 September to 5 October 2026; it says nothing about what the rule will do next.
The Vortex indicator draws two lines, VI+ and VI-, that measure upward and downward price movement over a number of candles, and a crossing of the two lines marks a possible change of direction. This strategy acts on a Vortex crossing only when the MACD crosses its signal line in the same direction within a few candles of it, on a five-minute chart. This guide shows how to add both indicators on IQ Option’s current platform, how the entry works and what the rule did when we replayed it on recorded candles.
Video tutorial
Quick answer
- Indicators: Vortex Indicator with period 21 (the platform default is 14) and MACD with its defaults 12, 26 and 9, on five-minute candles.
- Buy (Higher): VI+ crosses above VI- and the MACD line crosses above its signal line, on the same candle or within four candles of each other.
- Sell (Lower): the mirror: VI+ crosses below VI- and the MACD line crosses below its signal line.
- Time in the trade: the rule holds each trade for about 30 minutes on a five-minute chart, which is six candles.
- Support lines: the Vortex dialog’s defaults are 1.1 and 0.9; the strategy reads the crossings, not these levels.
- Replay on recorded candles: on 1,334 five-minute EUR/USD candles (29 September to 5 October 2026), with a six-candle (30-minute) expiry, Reading 1 gave 67 signals: 39 won, 27 lost and 1 was refunded (59.1% of decided trades). Reading 2 gave 36 signals: 22 won and 14 lost (61.1%). Break-even at an 85% payout is 54.1%; the samples are too small to show an edge.
What is the Vortex indicator?
IQ Option’s blog describes the Vortex indicator as an oscillator that is used to find the beginning of a new trend and to confirm a trend that is already running, with its direction and strength. It has two lines: the uptrend line VI+ and the downtrend line VI-. By default the uptrend line is blue and the downtrend line is purple. As a rule, the line that is on top points to the prevailing trend, and the distance between the lines reflects its strength. The blog credits Etienne Botes and Douglas Siepman with developing the indicator. It says they were inspired by the work of the Austrian inventor Viktor Schauberger on the flow of water, suggested that market movements may resemble vortex motions in flowing water, and added the true range to the calculation.
The platform draws the two lines from the highs, lows and true range of the candles. With n as the period:
| Part | Calculation |
|---|---|
| Upward movement | The distance between this candle’s high and the previous candle’s low |
| Downward movement | The distance between this candle’s low and the previous candle’s high |
| VI+ | The sum of the upward movement over n candles divided by the sum of the true range over n candles |
| VI- | The sum of the downward movement over n candles divided by the sum of the true range over n candles |
The larger the distance between a candle’s high and the previous candle’s low, the larger the upward movement, and the other way round for downward movement. The two support lines at 1.1 and 0.9 are the overbought and oversold levels of the platform’s default setup. The strategy below uses the crossings of VI+ and VI-, not these levels.
How to add the Vortex indicator to the IQ Option chart
These steps use the web traderoom on a Practice balance. The numbers in each screenshot match the numbers in the text. Every period below counts candles, not minutes.
Step 1: Open Chart analysis
Click the indicators button, the wave icon in the toolbar at the bottom left of the chart (1). The Chart analysis panel opens with the tabs Indicators, Templates, Widgets and Scripts. Its search box, “Search for indicators”, finds an indicator by name.

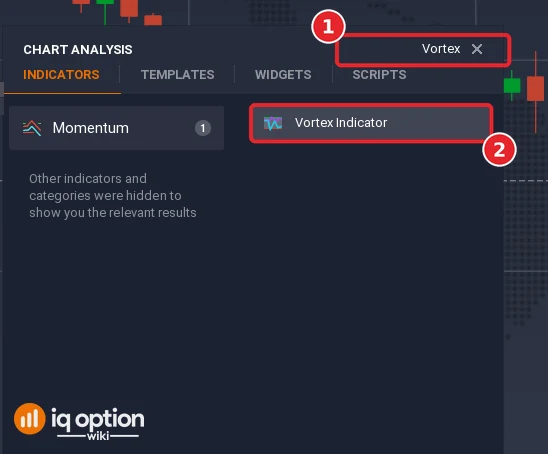
Step 2: Find the Vortex indicator
Type Vortex in the search box (1) and click Vortex Indicator in the results (2). The indicator is in the Momentum list, so you can also open that list and find it there.
Step 3: Set the period
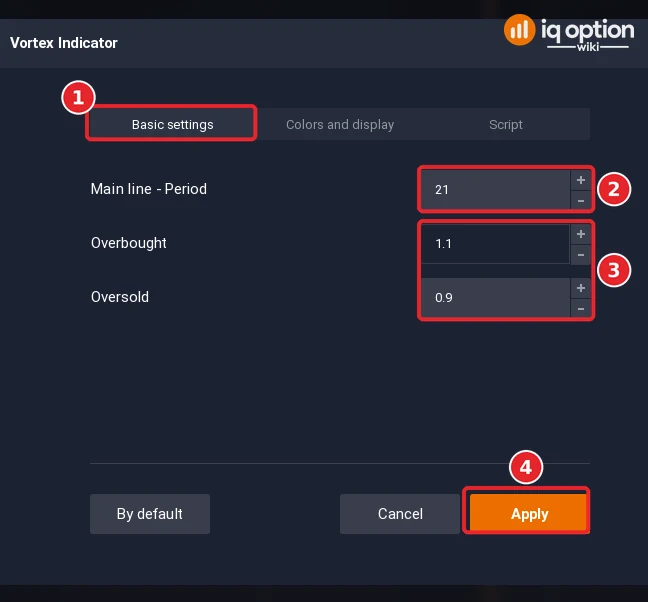
The dialog that opens is on the Basic settings tab (1). The field Main line – Period is 14 by default (2), and the support lines are Overbought 1.1 and Oversold 0.9 (3). The test below uses a period of 21, so change the Period to 21 and click Apply (4). A longer period smooths the two lines, so they cross less often; a shorter period makes them react faster and cross more often.
Step 4: Add the MACD
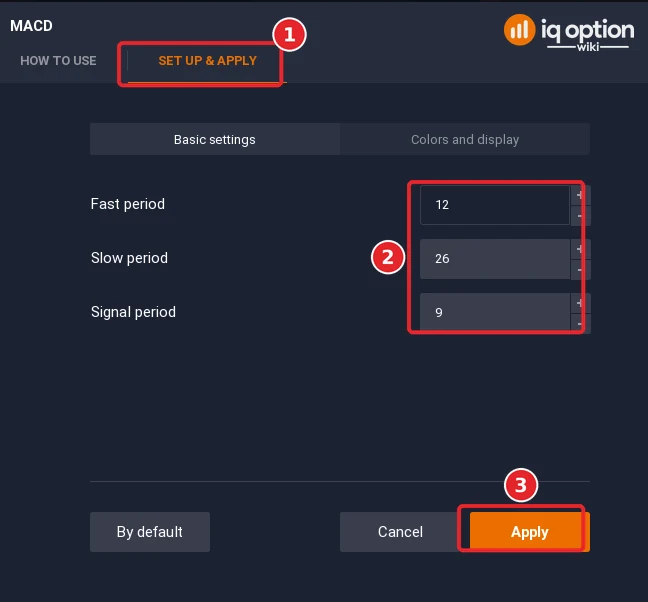
Click the indicators button again, type MACD in the search box and click MACD; it is also in the Popular list. Leave the settings as they are: on Set up & apply (1), Fast period is 12, Slow period 26 and Signal period 9 (2). Click Apply (3). The MACD opens in its own panel with the MACD line, the signal line and a histogram. The MACD line is the 12-period EMA minus the 26-period EMA of the closing price, the signal line is a 9-period EMA of the MACD line, and the histogram is the MACD line minus the signal line, so it crosses zero on the same candle on which the two lines cross: that is one event, not two.
Step 5: Use five-minute candles
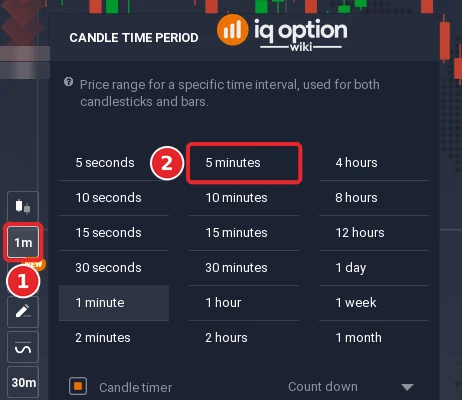
Click the candle time period button in the toolbar at the bottom left (1) and choose 5 minutes (2). The chart should show Japanese candles; if it shows a line or bars, change it with the chart type button in the same toolbar (see chart types on IQ Option). On this chart a Vortex period of 21 covers 21 five-minute candles, which is 105 minutes.
Step 6: Read the two panels
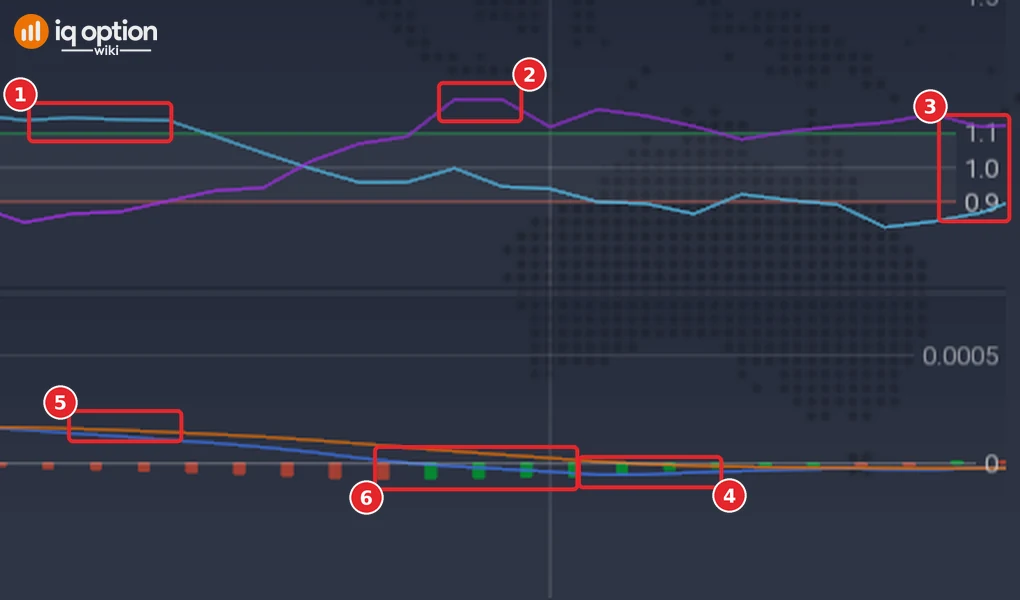
The Vortex panel shows VI+ (1) and VI- (2) with the support lines at 1.1 and 0.9 (3). The MACD panel shows the MACD line (4), the signal line (5) and the histogram (6). The strategy watches two events: VI+ and VI- crossing each other (1, 2) and the MACD line and the signal line crossing each other (4, 5).
How does a Vortex indicator work?
The two lines cross when the balance between upward and downward movement changes. IQ Option’s blog reads the crossings like this: a buy signal appears when VI+ is below VI-, crosses above it and stays on top, and a sell signal appears when VI- is below VI+, crosses above it and stays on top. The blog adds that not every signal should become an open position: a crossing is a prompt to look closely at the market and consider a trade in that direction.
This reading shows the direction of movement, but it gives many crossings when price moves sideways, because the lines cross back and forth. Our script library’s note on this strategy says the same: Vortex crossings are frequent in consolidation, and agreement from the MACD helps but does not remove false marks.
Using the Vortex indicator together with the MACD on IQ Option
IQ Option’s Vortex article suggests the MACD or the ADX as a second indicator to help avoid false entry signals. It also advises against combining two indicators of the same type, because their signals can stem from the same source. The Vortex and the MACD are both momentum indicators, but they are built from different data, and both still react to the same price move, so their agreement is a filter and not proof.
| Indicator | Built from | What the strategy reads |
|---|---|---|
| Vortex (period 21) | Highs, lows and true range of each candle | VI+ crossing VI- |
| MACD (12, 26, 9) | Two EMAs of the closing price | The MACD line crossing its signal line |
The entry rule has three parts. The test below reads them like this:
- Buy (Higher): VI+ crosses above VI-, and the MACD line crosses above its signal line on the same candle or within four candles of it, in either order. Open a Higher option when the candle of the later crossing closes.
- Sell (Lower): the mirror: VI+ crosses below VI-, and the MACD line crosses below its signal line within four candles. Open a Lower option when the candle of the later crossing closes.
- Time in the trade: the rule holds each trade for about 30 minutes on a five-minute chart, which is six candles. The test uses six candles (30 minutes), counted from the close of the signal candle to the close six candles later. IQ Option’s binary expiry list offers fixed clock times (one-minute steps for the first ten minutes, then quarter-hour marks, as seen on 5 October 2026), so an exact 30 minutes exists only when you enter on a quarter-hour mark.
The test does not use a trend filter, because the crossing itself marks the turn. Our script library’s Vortex and MACD script uses a simpler test: it marks a Vortex crossing when the MACD line is on the matching side of its signal line at that moment, with no window of candles. The tested box below reports both readings.
Opening positions for price increases
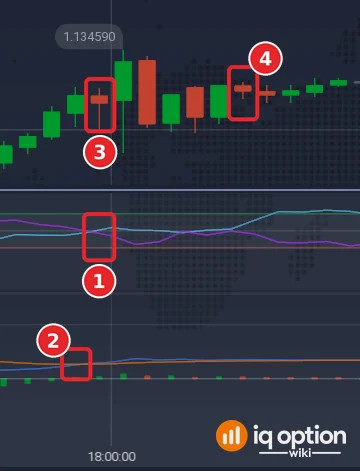
Open a Higher option once VI+ has crossed above VI- and the MACD line has crossed above its signal line, no more than four candles apart, as soon as the later crossing’s candle has closed. This is the first Higher signal of the replay in time order, on EUR/USD 5-minute candles: the MACD line crossed above its signal line on the candle that opened at 20:50 UTC on Tuesday 29 September 2026 (17:50 on the platform clock) (2), and VI+ crossed above VI- (1) on the next candle, which opened at 20:55 UTC (17:55) (3), one candle later and so inside the four-candle window. The later crossing’s candle closed at 1.1342, where the order would open. Six candles after that close, at 21:30 UTC (4), the price was 1.13429, so the Higher order won by less than one pip.
Opening positions for price decreases
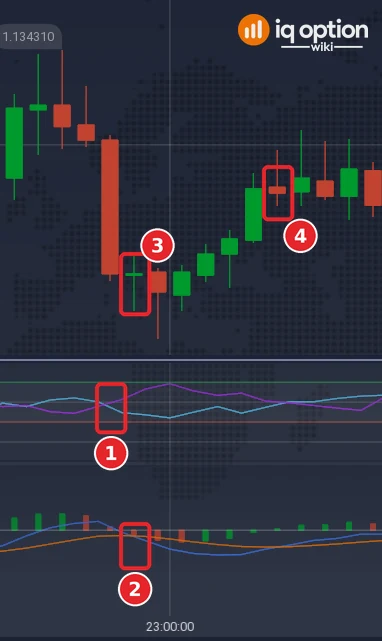
Open a Lower option once VI+ has crossed below VI- and the MACD line has crossed below its signal line, no more than four candles apart, as soon as the later crossing’s candle has closed. This is the first Lower signal of the replay: VI+ crossed below VI- on the candle that opened at 01:45 UTC on 30 September (22:45 on the platform clock on 29 September) (1), and the MACD line crossed below its signal line on the next candle, which opened at 01:50 UTC (22:50) (2), the signal candle (3). It closed at 1.133575, where the order would open. At 02:25 UTC (4) the price was 1.13384, higher, so this Lower order lost. We show it because it is the first one in time order, not because of its result.
Tested on IQ Option: a replay run on 8 October 2026
| Asset and candles | EUR/USD binary (regular, not OTC), 1,334 five-minute candles recorded from IQ Option’s Practice traderoom in two stretches: 29 September 2026, 01:55 UTC, to 2 October 2026, 20:55 UTC (1,093 candles), and 4 October 2026, 21:00 UTC, to 5 October 2026, 17:00 UTC (241 candles). The replay places no orders; it scores each reading on closed candles, at an 85% payout. Reading 2 signals start 100 candles into each stretch, so that the averages have settled. |
|---|---|
| Rules tested | Reading 1, our script library’s: on five-minute candles, a Higher option opens on the candle where VI+ (period 21) crosses above VI- while the MACD (12, 26, 9) line is above its signal line, and a Lower option on the mirror, with no window of candles. Reading 2, with a window of four candles: VI+ crosses above VI-, and the MACD line crosses above its signal line on the same candle or within four candles of it, in either order. A Higher option opens when the later crossing’s candle closes. The mirror opens a Lower option. Expiry: six candles (30 minutes), counted from the close of the signal candle to the close six candles later. IQ Option’s binary expiry list offers fixed clock times (one-minute steps for the first ten minutes, then quarter-hour marks, as seen on 5 October 2026), so an exact 30 minutes exists only when you enter on a quarter-hour mark. The replay does not model that. |
| Signals | Reading 1: 67 (37 Higher, 30 Lower). Reading 2: 36 (19 Higher, 17 Lower). |
| Outcomes | Reading 1: 39 won, 27 lost, 1 refunded (equal price); 59.1% of the 66 decided trades won; net +$0.09 per $1 staked at an 85% payout (Higher 22 of 37 won, Lower 17 of 30). Reading 2: 22 won, 14 lost, none refunded; 61.1% of 36; net +$0.13 per $1 (Higher 12 of 19 won, Lower 10 of 17). |
| Break-even | At an 85% payout a trade needs to win more than 54% of the time to break even (1 ÷ 1.85); at 87%, 53.5%. Both readings ended above that rate on these candles, but with 66 and 36 decided trades a win rate anywhere from roughly 47% to 70% (Reading 1) or 45% to 75% (Reading 2) would fit the result (95% intervals), so the break-even rate and rates below it cannot be ruled out. |
The replay applies the rule to candles that were already on the chart, recorded from IQ Option’s Practice traderoom on the dates above, and it placed no real orders. It shows what the rule did on those candles and nothing more. The two readings can differ because the window of four candles changes which crossings count, and the trades in each reading overlap in time, so they are not independent samples. A short test proves nothing about the future, and no profit and no win rate is promised here.
Pros and Cons of the Vortex Indicator
| Pros | Cons |
|---|---|
| Two lines and one crossing to read; IQ Option’s blog says the indicator can be applied to all assets and time frames. | The lines cross back and forth when price moves sideways, so crossings alone give many false marks. |
| The period and the support levels can be changed to suit a trading style. | It is not a standalone tool: IQ Option’s blog says not every signal should become an open position. |
| The MACD adds a second view, built from closing prices, to filter the crossings. | The entry needs two panels open and a count of the candles between two crossings; the replay gave 67 signals for Reading 1 (39 won, 27 lost, 1 refunded) and 36 for Reading 2 (22 won, 14 lost), too few to tell a rule that works from luck. |
Conclusion
The Vortex indicator measures upward and downward movement with two lines, and this strategy trades their crossing only when the MACD crosses its signal line in the same direction within four candles. In the replay on recorded candles it gave 67 signals (Reading 1) with 59.1% of decided trades won and 36 signals (Reading 2) with 61.1% won, both above the 54.1% break-even rate at an 85% payout, but on about a week of one pair and with intervals wide enough to include break-even and losing rates. That is a look at the past, not a forecast: a short test proves nothing about the future, and no result here promises a profit or a win rate. Practise on the Practice balance, keep the rule fixed, count your own results over a few hundred trades and compare your win rate with the break-even rate before you risk money.
Common mistakes
- Acting on a Vortex crossing alone. IQ Option’s blog calls a crossing a prompt to look at the market, not an order.
- Counting the MACD line crossing the signal line and the histogram crossing zero as two confirmations. They are one event.
- Mixing directions, for example VI+ crossing up while the MACD line crosses down.
- Taking crossings in a sideways market, where the lines cross back and forth.
- Entering before the candle closes. Both crossings can appear and disappear while a candle is still forming.
- Looking for a stop loss. IQ Option’s blog suggests stop-loss and take-profit levels when trading with the Vortex, but that tip can only be followed on margin trades; a binary option has neither and closes at the expiry time.
Related guides
- MACD indicator on IQ Option
- Trade entry signals on IQ Option
- ADX and EMA strategy on IQ Option, since IQ Option’s blog names the ADX as another filter for the Vortex
- Chart time frames, chart types and expiry times
- IQ Option chart templates
- IQ Option scripts library, with a Vortex and MACD script that marks the crossing on your chart
- All indicator guides and all strategy guides
Frequently Asked Questions
Q: What do VI+ and VI- show?
A: VI+ measures upward movement and VI- downward movement over the chosen number of candles, each divided by the true range. The line that is on top points to the prevailing trend, and the distance between them reflects its strength.
Q: What are the default settings of the Vortex indicator?
A: A period of 14, with the overbought line at 1.1 and the oversold line at 0.9. This strategy changes the period to 21.
Q: Which time frame does the strategy use?
A: Five-minute candles. The MACD keeps its defaults of 12, 26 and 9.
Q: When do I open a Higher option?
A: When VI+ has crossed above VI- and the MACD line has crossed above its signal line, on the same candle or no more than four candles apart. Open the option when the later crossing’s candle closes. For a Lower option, use the mirror.
Q: How long should the trade last?
A: The rule holds each trade for about 30 minutes on a five-minute chart, which is six candles. The replay used six candles (30 minutes), counted from the close of the signal candle to the close six candles later. IQ Option’s binary expiry list offers fixed clock times (one-minute steps for the first ten minutes, then quarter-hour marks, as seen on 5 October 2026), so an exact 30 minutes exists only when you enter on a quarter-hour mark. Check which expiries the platform offers for the asset you trade.
Q: Can the Vortex indicator be used on its own?
A: IQ Option’s blog says it can be applied to all assets and time frames, but that not every signal should become an open position. It suggests complementing the Vortex with the MACD or the ADX to help avoid false entry signals.
Q: How did the rule do in your test?
A: On 1,334 recorded five-minute EUR/USD candles with a six-candle expiry, Reading 1 gave 67 signals and 39 of 66 decided trades won (59.1%), and Reading 2 gave 36 signals and 22 won (61.1%). Both are above the 54.1% break-even rate at an 85% payout, but 66 and 36 trades are too few to separate this from chance. A test on recorded candles shows what the rule did on those candles and says nothing about what it will do next.
Q: Is there a script that marks this rule on the chart?
A: Yes. The script library has a Vortex and MACD script that draws a marker when VI+ crosses VI- while the MACD line is on the matching side of its signal line. Import it as shown in our scripts guide.
Q: How can I practise it without real money?
A: Use the Practice balance, which was $10,000 when we looked and has a Refill to $10,000 button. See how to start on IQ Option.

