
Last updated: 8 October 2026. Every screenshot below was recorded on 8 October 2026 on an IQ Option Practice account registered in Brazil, on EUR/USD 1-minute candles; the Chart analysis picture in Step 1 was recorded on 5 October 2026. We placed no real-money trade. The tested box shows what the rule, a close beyond a confirmed fractal followed by a 3-minute option, did on EUR/USD candles recorded between 29 September and 5 October 2026; it says nothing about what will happen next.
The Fractal indicator marks the turning points of the price with arrows. A fractal is a pattern of five candles: the middle candle has the highest high (or the lowest low) of the five, with two lower highs (or two higher lows) on each side, and an arrow is drawn above or below it. The pattern is complete, and the arrow is a signal, only after the two candles that follow it. The platform’s default period is 5. Because fractals appear often, not every one should be traded; one way is to wait for a close above a fractal high or below a fractal low and then open a 3-minute option. On 1-minute EUR/USD candles recorded between 29 September and 5 October 2026 that rule gave 125 signals, and the 3-minute trades won 67 and lost 57, 54.0% of the decided trades, level with the 54.1% needed to break even at an 85% payout.
Quick answer
- What it plots: arrows over the price chart, above a fractal high and below a fractal low, on the middle candle of a five-candle pattern.
- Pattern: a fractal high is a candle whose high is higher than the highs of the two candles before it and the two after it; a fractal low is the mirror. It is confirmed two candles later.
- Settings on the platform: the Period (5) and the Color (two colour boxes, green and red).
- How often: in our recording one fractal appeared about every 4 candles.
- Rule: a close above the latest fractal high is a 3-minute option for an increase; a close below the latest fractal low, for a decrease.
- Tested: 1-minute candles, 125 signals, 3-minute trades won 54.0% of the decided trades. Break-even is 54.1% at an 85% payout, and a few days of one pair prove nothing.
How do you add the Fractal indicator on IQ Option?
Set the chart
Choose the asset, the chart type and the candle size first: the indicator is calculated from the candles on the chart. The examples in this guide use 1-minute candles on EUR/USD. These steps use the web traderoom on a Practice balance, and the numbers in each screenshot match the numbers in the text. If you do not have an account yet, see how to register.
Step 1: Open Chart analysis
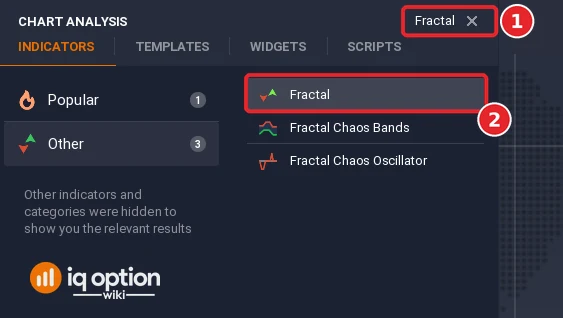
Click the indicators button (1), the wave icon in the chart toolbar at the bottom left of the chart. The Chart analysis panel opens with the tabs Indicators, Templates, Widgets and Scripts. Stay on Indicators.

Step 2: Find the Fractal indicator
Type “Fractal” in the Search for indicators box (1), or open the Other list, and click Fractal (2). Fractal Chaos Bands and Fractal Chaos Oscillator are other indicators: choose the plain Fractal (2).
Step 3: Check the settings and click Apply
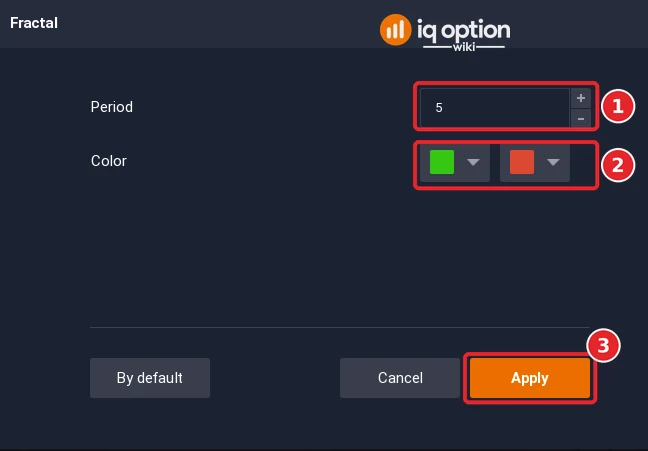
The dialog is a single page: there is no tab for colours. The Period (1) opens at 5, the number of candles of the pattern. The Color (2) has two colour boxes, the first green and the second red by default. Click Apply (3).
Step 4: Read the lines
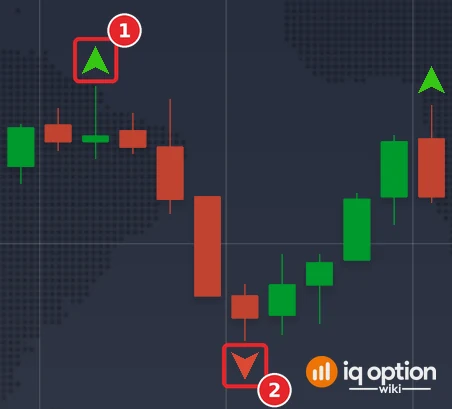
The arrows are drawn over the price chart; there is no panel. The picture shows 15:49 to 16:00 on the platform clock on 2 October. A green arrow above a candle (1) marks a fractal high and a red arrow below a candle (2) a fractal low; each arrow sits on the middle candle of its five-candle pattern, and it is drawn once the two candles after that candle have closed. In the 46 candles of this window the platform drew 4 green and 4 red arrows, on exactly the candles where our replay finds a fractal high or a fractal low.
What is a fractal?
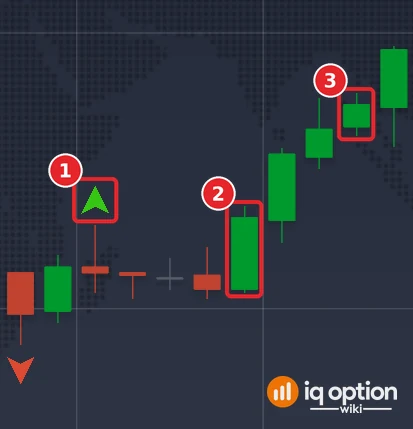
Fractal trading is based on defined price extremes: the peaks and troughs form a sequence and the decisions are made from it. The pattern has five candles. A fractal high has a middle candle with the highest high and two lower highs on each side; a fractal low has a middle candle with the lowest low and two higher lows on each side. The indicator draws an arrow at the middle candle. The pattern makes a U shape in the price bars: a fractal low is the bottom of a U, a fractal high the top of an upside-down U.
The arrow is not an entry. It is drawn on the middle candle, but the pattern exists only when the two candles that follow also stay inside it, so the earliest moment to act is the close of the second candle after the arrow candle. A larger period uses more candles on each side, so only more significant peaks and troughs are marked: on our 1-minute candles one fractal appeared about every 2.4 candles with a period of 3, every 4.3 with the default 5, every 6.3 with 7 and every 7.8 with 9.
In our recording, with the period of 5, the indicator marked 175 fractal highs and 171 fractal lows on 1,505 one-minute candles, one fractal about every 4.3 candles, and 167 and 155 on 1,334 five-minute candles, about every 4.1.
How do you trade a fractal?
There are two ideas. The first is to read the chart with the fractals: they mark horizontal support and resistance levels, help to draw trend lines and make patterns such as head-and-shoulders, double tops and triangles easier to see. The second is a break: enter when the price closes above a fractal high or below a fractal low, and open a 3-minute option. Written so that every condition is checked on closed candles:
| Part | Usual rule | Our rule for the replay |
|---|---|---|
| Fractal | Five candles, an arrow on the middle one | Period 5: the middle candle’s high (low) is higher (lower) than those of the two candles on each side; known two candles later |
| Higher signal | The price closes above a fractal high; open a 3-minute option for an increase | The first candle that closes above the latest confirmed fractal high |
| Lower signal | The price closes below a fractal low; open a 3-minute option for a decrease | The first candle that closes below the latest confirmed fractal low |
| Repeats | Not stated | Each fractal is used once |
| Expiry | 3 minutes | 3 minutes on 1-minute candles; we also scored 5 minutes and the 5-minute chart |
The signals appear frequently, so one should not rely only on them: they are meant to be combined with a trend analysis or pivot points.
Two signals of the recording, step by step
The first Lower signal and the first Higher signal of the break rule on 1-minute candles, in time order, not picked by outcome. All times are the platform clock, which is UTC minus three hours; the date is 2 October 2026.
Lower signal, 15:54
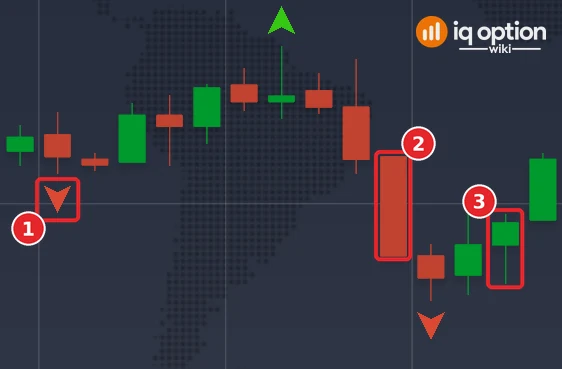
The fractal low of 1.125055 was the low of the candle that opened at 15:45; the red arrow under it (1) was drawn once the candle that opened at 15:47 had closed. The candle (2) that opened at 15:54 fell from 1.125085 to a close of 1.124905 at 15:55, 1.5 pips under that low. The rule says Lower, and the 3-minute trade opens at that close. It ends at 15:58, when the candle (3) that opened at 15:57 closes at 1.124965, 0.6 pip higher: it lost.
Higher signal, 16:09
The fractal high of 1.12515 was the high of the candle that opened at 16:05; the green arrow above it (1) was drawn once the candle that opened at 16:07 had closed. The candle (2) that opened at 16:09 rose from 1.125035 to a close of 1.125165 at 16:10, 0.15 pip over that high. The rule says Higher, and the 3-minute trade opens at that close. It ends at 16:13, when the candle (3) that opened at 16:12 closes at 1.12537, 2.05 pips higher: it won. The next signal, a Higher at 16:21, closed 0.75 pip over the fractal high of 16:15 and won by 3.1 pips.
The fractal break rule, tested
We scored the rule on the 1,505 one-minute candles of our recording, entering at the close of the signal candle and scoring the trade 3 minutes later. The box also shows 5-minute trades, the rule on 5-minute candles and a period of 7.
Tested on IQ Option: the Fractal break rule, EUR/USD candles of 29 September to 5 October 2026
| Asset and candles | EUR/USD binary (regular, not OTC): 1,505 one-minute candles (2026-10-02 18:23 to 2026-10-02 20:59 UTC and 2026-10-04 21:01 to 2026-10-05 19:28 UTC); 1,334 five-minute candles (2026-09-29 01:55 to 2026-10-02 20:55 UTC and 2026-10-04 21:00 to 2026-10-05 17:00 UTC). The candles were recorded from IQ Option’s Practice traderoom. The replay places no orders; it only scores the rule on those closed candles, at an 85% payout. |
|---|---|
| Rule tested | The rule on closed candles, the option opening at the close of the signal candle and lasting 3 minutes: Higher on the first candle that closes above the latest confirmed fractal high, Lower on the first that closes below the latest confirmed fractal low; a fractal (period 5) is confirmed two candles after its middle candle, and each fractal is used once. Fractal as the platform draws it. The box lists 1-minute candles with a 3-minute trade first, then the variants. |
| Signals | Fractal break, 1-minute candles, 3-minute trade: 125 signals (58 Higher, 67 Lower) same, 5-minute trade: 125 signals (58 Higher, 67 Lower) same, 5-minute candles, 5-minute trade: 124 signals (53 Higher, 71 Lower) same, 5-minute candles, 15-minute trade: 123 signals (53 Higher, 70 Lower) Fractal break with period 7, 1-minute candles, 3-minute trade: 92 signals (43 Higher, 49 Lower) |
| Outcomes | Fractal break, 1-minute candles, 3-minute trade: 67 won, 57 lost, 1 tied; 54.0% of the 124 decided trades won; net +$0.00 per $1 staked at 85% (+$0.03 at 91%) same, 5-minute trade: 67 won, 56 lost, 2 tied; 54.5% of the 123 decided trades won; net +$0.01 per $1 staked at 85% (+$0.04 at 91%) same, 5-minute candles, 5-minute trade: 53 won, 70 lost, 1 tied; 43.1% of the 123 decided trades won; net −$0.20 per $1 staked at 85% (−$0.18 at 91%) same, 5-minute candles, 15-minute trade: 61 won, 61 lost, 1 tied; 50.0% of the 122 decided trades won; net −$0.07 per $1 staked at 85% (−$0.04 at 91%) Fractal break with period 7, 1-minute candles, 3-minute trade: 51 won, 41 lost, 0 tied; 55.4% of the 92 decided trades won; net +$0.03 per $1 staked at 85% (+$0.06 at 91%) |
| Break-even | At an 85% payout a trade needs to win more than 54.1% of its decided trades to break even (1 ÷ 1.85); at 91%, more than 52.4% (1 ÷ 1.91). |
A replay is only a look back at candles recorded on the dates above: it placed no real orders, covers about four and a half days of one pair, and counts overlapping trades as if they were independent. A short test proves nothing about the future, and no profit and no win rate is promised here. IQ Option’s own blog on backtesting says that most strategies need dozens, and often hundreds, of trades before a result means anything.
On 1-minute candles the rule gave 125 signals: 67 won, 57 lost and 1 tied with a 3-minute trade (54.0%, with a 95% interval of 45% to 63%), and 67 and 56 with a 5-minute trade (54.5%). On 5-minute candles it won 43.1% with a 5-minute trade (53 of 123) and 50.0% with a 15-minute trade. With a period of 7 the 1-minute rule gave 92 signals and won 55.4% (51 of 92). The 1-minute results are level with the 54.1% needed to break even and well inside the margin of error of it; the 5-minute chart did worse. Nothing here shows an edge.
Pros and Cons of the Fractal indicator
| Pros | Cons |
|---|---|
| Easy to see: an arrow marks every turning point, and a larger period marks fewer, bigger ones. | Fractals appear about every 4 candles, so most of the arrows are not trading signals. |
| Helps to draw support, resistance and trend lines, and to see chart patterns. | The pattern is known only two candles late, after part of the move has gone. |
| A simple break rule with a fixed 3-minute expiry. | On 1-minute candles the rule was level with break-even, and on 5-minute candles below it. |
Common mistakes
- Entering when the arrow appears. The pattern needs the two candles after the arrow candle; the earliest entry is the close of the second one.
- Trading every arrow. They come about every 4 candles; not all of them are signals.
- Going under the period of 5. A period of 3 marks even more arrows, one about every 2.4 candles in our recording.
- Reading the colours as buy and sell. A green arrow above a candle marks a fractal high and a red arrow below a candle a fractal low; the colour says which kind of turning point it is, not which way to trade.
- Using it alone. Add a trend analysis or pivot points.
Related guides
- Fractal Chaos Bands and Support and resistance on IQ Option
- Donchian Channel and Trading with trend lines
- Trading candles on IQ Option
- All indicator guides and all strategy guides
Frequently Asked Questions
Q: What is a fractal?
A: A pattern of five candles in which the middle candle has the highest high (a fractal high) or the lowest low (a fractal low) of the five. The indicator draws an arrow on it.
Q: What are the Fractal settings on IQ Option?
A: Two: the Period (5) and the Color row, which has two colour boxes, green and red by default. The dialog is a single page without a tab for colours.
Q: When can I trade a fractal?
A: After the pattern is confirmed, two candles after the middle one. The break rule enters when the price closes above a fractal high or below a fractal low.
Q: How long should the trade last?
A: The break rule opens a 3-minute option after a close beyond the fractal. In our replay on 1-minute candles 3-minute trades won 54.0% of the decided trades.
Q: Does the Fractal strategy win?
A: Not clearly: level with break-even on 1-minute candles (67 of 124 decided trades) and 43.1% on 5-minute candles with a 5-minute trade.
Q: How is it different from the Fractal Chaos Bands?
A: Both use the same idea of fractals, but the Fractal Chaos Bands join the latest fractal highs and lows into lines over the chart, while the Fractal indicator marks single candles with arrows.

