
Last updated: 8 October 2026. Every screenshot below was recorded on 5 and 8 October 2026 (the Chart analysis pictures in Steps 1 and 4 are from 5 October) on an IQ Option Practice account registered in Brazil, on 5-minute EUR/USD candles; the candles of the two example pictures are from 29 September 2026, scrolled back on the same chart. Nothing was traded with real money. The way the bands are built comes from the Quadcode Script Library, the public source code of the platform’s built-in indicators. The tested box shows what a close through a band did on EUR/USD 5-minute candles recorded from 29 September to 5 October 2026, with and without a 100-period moving average as a filter; it says nothing about what will happen next.
The Fractal Chaos Bands draw two stepped lines over the price chart: the upper line is the level of the last confirmed fractal high and the lower line the level of the last confirmed fractal low, where a fractal is the highest high or lowest low of five consecutive candles. A close above the upper line or below the lower line is the breakout signal described here, with a 100-period simple moving average as an optional filter against false breaks. The indicator has no period setting, only colours, line widths and visibility, and the tested box shows what the signal did on EUR/USD 5-minute candles.
Quick answer
- The bands: the upper band is the level of the last confirmed fractal high and the lower band the level of the last confirmed fractal low. Both move in steps and are flat between steps.
- A fractal: the highest high (or lowest low) of five consecutive candles, with the extreme in the middle. It is confirmed two candles later, so the bands lag by two candles.
- Settings: no period or other number; only the colour, width and visibility of the two lines and the fill. Where it is: indicators button, Chart analysis, Other list.
- Signal described: the first close above the upper band is Higher, the first close below the lower band is Lower. A 100-period SMA is an optional filter: Higher only above it, Lower only below it.
- Stop loss: a CFD (margin) trade can have one; a binary option has none.
- Tested: on EUR/USD 5-minute candles from 29 September to 5 October 2026 with a 1-candle expiry, the bands alone had 128 signals and won 55 of 127 decided trades (43.3%), and with the SMA(100) filter 81 signals and 34 of 80 (42.5%), against a break-even rate of 54.1% at an 85% payout. It is a short replay and says nothing about the future.
Introduction to the Fractal Chaos Bands
In the Quadcode source, a fractal high is a candle whose high is at least as high as the highs of the two candles before it and the two candles after it; a fractal low is the mirror case. The upper band is the level of the last fractal high and the lower band is the level of the last fractal low. Each band holds its level until a newer fractal replaces it, so both lines move in steps and stay flat between steps.
A fractal needs two candles on each side, so it is confirmed two candles after the extreme, and the band steps then, not on the extreme candle. The second of those candles is the one still forming on a live chart, so wait for it to close before you rely on a new step. Flat bands suggest a range, and bands stepping one way suggest a trend; that is a reading of the shape, not a measurement.
The source defines no period or other number to set, and the dialog has none. The five-candle fractal is fixed, and the only settings are the colour, line width and visibility of the lines and the fill.
| Setting | Default in the dialog | What it does |
|---|---|---|
| Fractal size | 5 candles, fixed (source code) | Not a setting: two candles on each side of the extreme |
| High | green line, shown | Colour, line width and visibility of the upper band |
| Low | red line, shown | Colour, line width and visibility of the lower band |
| Fill | grey-blue, shown | The colour between the two bands, and whether it is shown |
Adding the Fractal Chaos Bands to the IQ Option chart
These steps use the web traderoom on a Practice balance. The numbers in each screenshot match the numbers in the text.
Step 1: Open Chart analysis
Click the indicators button (1), the wave icon in the chart toolbar at the bottom left of the chart. The Chart analysis panel opens with the tabs Indicators, Templates, Widgets and Scripts.

Step 2: Find Fractal Chaos Bands
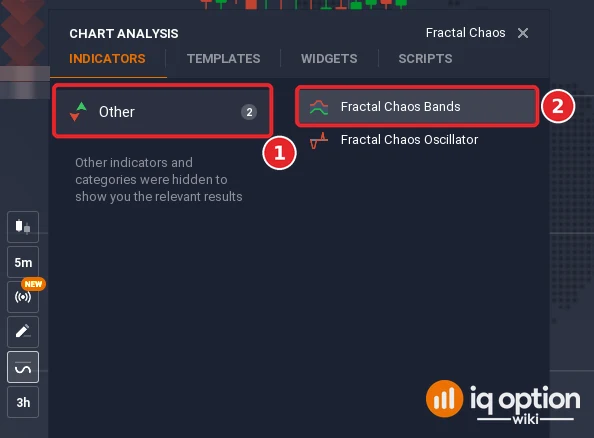
On the Indicators tab, open the Other list (1) and click Fractal Chaos Bands (2). You can also type its name in the search box. Do not confuse it with the Fractal indicator in the Popular list, which marks each fractal with an arrow. The dialog opens with two tabs, Colors and display and Script.
Step 3: Check the colours and apply
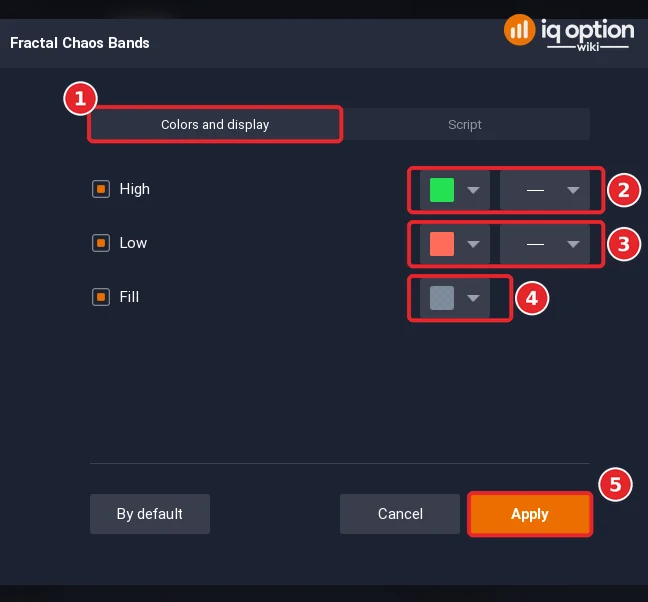
The dialog opens on Colors and display (1), next to a Script tab. It has no period or other number to set. The rows are High, the upper line (2), Low, the lower line (3), and Fill (4): High and Low each have a checkbox, a colour and a line width, and Fill a checkbox and a colour. They open as a green line, a red line and a grey-blue fill. Click Apply (5).
Step 4: Add the 100-period SMA
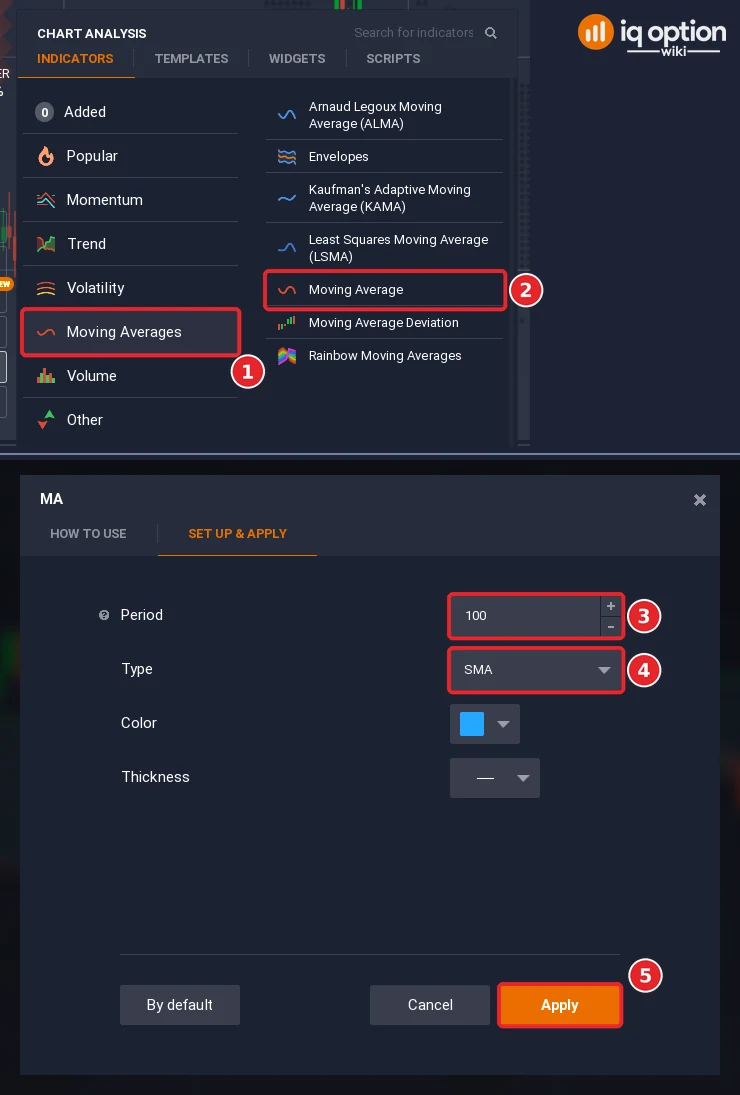
For the filter in the second rule, add a Moving Average. Open the Moving Averages list (1), click Moving Average (2), set Period to 100 (3), leave Type on SMA (4) and click Apply (5). The dialog opens with the period at 14, so the period has to be changed. The line starts red, like the lower band; we changed its colour to blue on the Color row so that the two are easy to tell apart.
Step 5: Read the chart
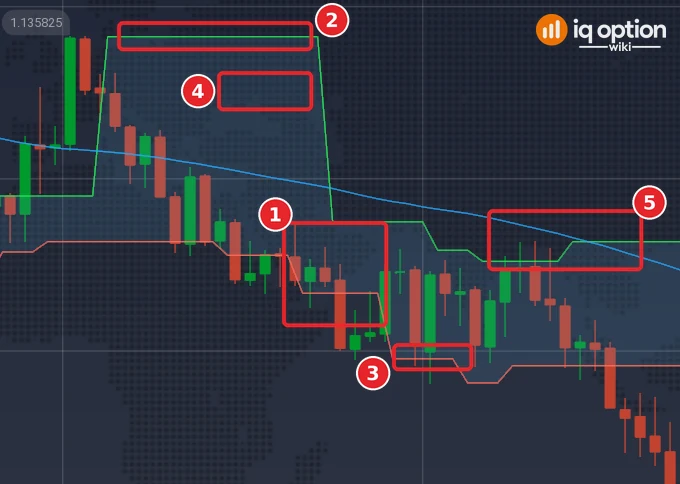
The bands are drawn over the price chart (1) (no separate panel opens). The upper band (2) is the last confirmed fractal high, the lower band (3) is the last confirmed fractal low, and the fill (4) is the channel between them. The SMA(100) (5) is the filter line.
Trading with the Fractal Chaos Bands indicator
The shape of the bands, flat or stepping, and the place where candles close in relation to them are the two things to read.
Signals to open a trading position with fractal bands
A close beyond a band means price has moved past the last confirmed fractal. The signal, written as a rule on closed candles:
- Higher: a candle closes above the upper band after the previous candle closed at or below it.
- Lower: a candle closes below the lower band after the previous candle closed at or above it.
- Expiry: the rule sets none. The test uses 1 candle from the close of the signal candle.
Only the first close beyond a band counts; while price stays beyond the same band, later closes are not new signals. This is also the rule of the IQOW Fractal Chaos Bands Break script in our library, which marks these closes on the chart without the filter below and is listed for 5-minute to 15-minute candles; see the scripts guide for how to import a script.
On a CFD (margin) trade you can place a stop loss. A binary option has no stop loss and no take profit; it pays or loses at expiry.
Avoiding whipsaws
A close through a band in a range can be a false break: price goes beyond the band and then comes back. The filter is a simple moving average with a period of 100 (Step 4). The two rules side by side, on closed candles:
| Rule | Higher | Lower |
|---|---|---|
| Bands alone | Close above the upper band after a close at or below it | Close below the lower band after a close at or above it |
| With the SMA(100) filter | The same, and the close is above the SMA(100) | The same, and the close is below the SMA(100) |
With the filter, a Lower signal is confirmed when price breaks the lower band below the moving average, and a Higher signal when the candle breaks the upper band above it; “below” and “above” mean that the close of the signal candle is on that side of the SMA(100). The filter removes signals; it does not tell you whether the ones that are left will win. On EUR/USD 5-minute candles the filter removed 47 of the 128 signals of the first rule: the 47 removed ones had 21 wins and 26 losses, and the 81 that were kept had 34 wins, 46 losses and 1 refund (one candle expiry, counted from the 100th candle of each stretch).
Opening positions for price increases
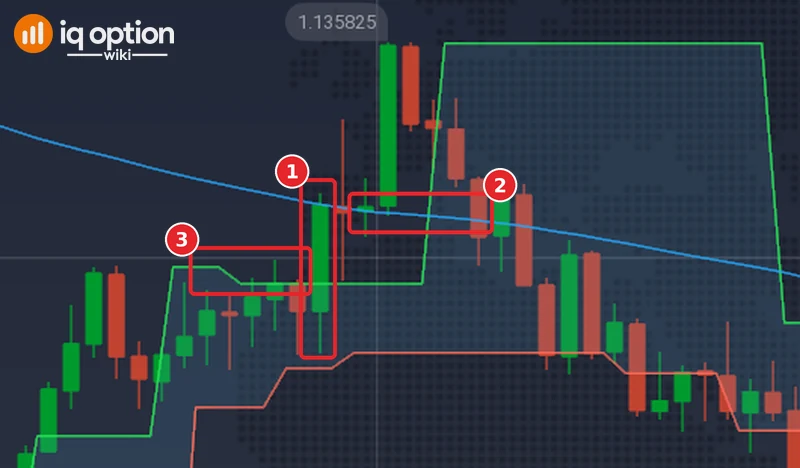
The first Higher signal of the second rule on EUR/USD came on 29 September 2026 at 08:45 on the platform clock (11:45 UTC). The upper band stood at 1.1349 (3), and the previous candle had closed at 1.134795, below it. The signal candle (1) closed at 1.1352, above the band and just above the SMA(100) (2) at 1.135198, so it passed the filter by two hundredths of a pip. A Higher option opened at that close, at 1.1352, and expiring five minutes later ended at 1.135175, a quarter of a pip lower: it lost. The next Higher signal, at 17:45, won (entry 1.13413, exit 1.134255). We placed no order: the entry and exit prices come from the recorded candles.
Opening positions for price decreases
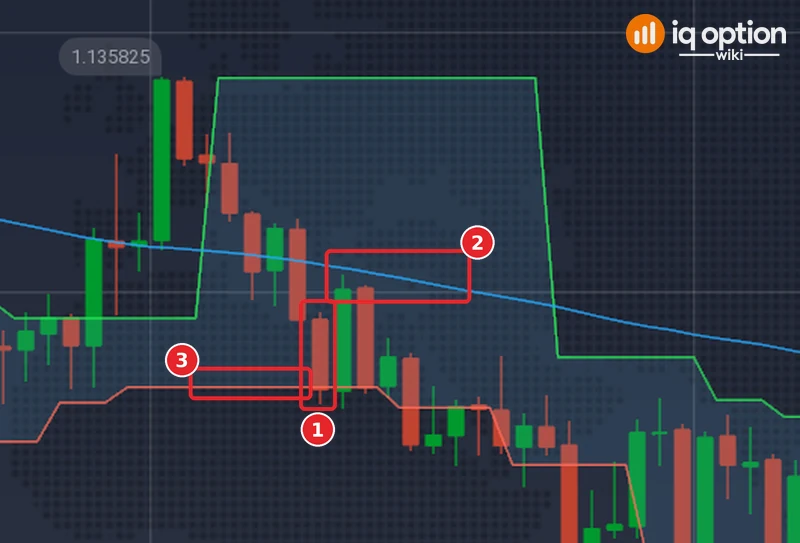
The first Lower signal came 50 minutes later, at 09:35 on the platform clock (12:35 UTC). The lower band stood at 1.134635 (3), and the previous candle had closed at 1.134895, above it. The signal candle (1) closed at 1.134625, a tenth of a pip below the band and below the SMA(100) (2) at 1.1351, so it also passed the filter. A Lower option opened at that close and expiring five minutes later ended at 1.13501, above the entry price: it lost. The next Lower signal, at 09:55, lost as well (entry 1.134415, exit 1.13445), and the one at 10:10 won (entry 1.13455, exit 1.13441). A break of a tenth of a pip counts as a signal under this rule; a reader could ask for a larger margin, and the result could change.
Tested on IQ Option: EUR/USD candles of 29 September to 5 October 2026
| Asset and candles | EUR/USD (binary), 5-minute candles recorded from IQ Option’s Practice traderoom: 1,334 candles in two stretches without gaps, 29 September 01:55 (open of the first candle) to 2 October 21:00 UTC (close of the last candle; 1,093 candles in this stretch) and 4 October 21:00 to 5 October 17:05 UTC (241 candles). Both rules are counted from the 100th candle of each stretch, where the SMA(100) exists, so 1,134 candles were scanned. The replay uses 5-minute candles, which were the ones we had recorded. The replay places no orders and uses the logged prices. |
|---|---|
| Rule 1: bands alone | Fractal Chaos Bands as drawn by the platform’s indicator (five-candle fractals, ties allowed). Higher when a candle closes above the upper band after the previous candle closed at or below it; Lower when it closes below the lower band after the previous candle closed at or above it. Opened at the close of the signal candle, expiring 1 candle later. |
| Rule 2: bands with SMA(100) | The same signals, kept only when the close is above the 100-period simple moving average (Higher) or below it (Lower). Same candles, same expiry. |
| Signals and outcomes, rule 1 | 128 signals: 55 won, 72 lost, 1 refunded. Win rate among decided trades 43.3% (55 of 127); net -$0.20 per $1 staked at an 85% payout. With a 3-candle (15-minute) expiry instead: 65 won, 61 lost, 1 refunded (51.6%; the last signal of a stretch has no candle three candles later, so 127 signals count). |
| Signals and outcomes, rule 2 | 81 signals: 34 won, 46 lost, 1 refunded. Win rate among decided trades 42.5% (34 of 80); net -$0.21 per $1 staked at an 85% payout. With a 3-candle (15-minute) expiry instead: 39 won, 40 lost, 1 refunded (49.4%; 80 signals count for the same reason). |
| Break-even | At an 85% payout a trade needs to win more than 54% of the time to break even (1 ÷ 1.85); at 87%, about 53.5%. |
This test replays candles recorded from IQ Option’s Practice traderoom between 29 September and 5 October 2026. It placed no real orders, and one week of candles proves nothing about how either rule will behave next. The rule sets no expiry, so 1 candle is our choice, and the filter’s reading (the close on the right side of the SMA(100)) is ours too. A first close beyond a band counts however small the margin. No profit or win rate is promised.
Pros and Cons
| Pros | Cons |
|---|---|
| The bands are drawn for you from the last confirmed fractal highs and lows, so everyone using the same candles sees the same levels. | Fractals are confirmed two candles late, so the bands lag the price. |
| Flat and stepping bands give a quick picture of range against trend. | A close beyond a band in a range can be a false break, which is the reason for the SMA(100) filter. |
| Nothing to configure beyond colours and widths. | The five-candle fractal is fixed, so it cannot be tuned to the asset or the candle size. |
Common mistakes
- Acting on a step that is still forming. Wait for the candle that completes the fractal to close.
- Counting every close beyond a band as a signal. Only the first close beyond it counts.
- Confusing it with the Fractal indicator. The Fractal indicator marks fractals with arrows; the Fractal Chaos Bands draw two stepped lines.
- Expecting a stop loss on a binary option. A binary option has none; a CFD trade has a stop loss and a take profit.
- Treating the SMA(100) filter as proof. It removes some signals; test the filtered rule on a Practice balance before you trust it.
Summary
The Fractal Chaos Bands show the levels of the last confirmed fractal high and low as two stepped lines, and a first close beyond either line is the signal described here. The bands lag by two candles, the fractal size cannot be changed, and a 100-period SMA is an optional filter that removes some signals without saying which of the rest will win. At an 85% payout a trade needs to win more than 54% of the time to break even, so count your own results over a few hundred Practice trades before you risk money.
Related guides
- Fractal indicator on IQ Option
- Donchian Channel indicator on IQ Option
- Bollinger Bands strategy on IQ Option
- Simple moving average
- IQ Option scripts: how to import custom indicators
- All indicator guides and all strategy guides
Frequently Asked Questions
Q: What are the Fractal Chaos Bands?
A: An overlay indicator that draws two stepped lines: the level of the last confirmed fractal high and the level of the last confirmed fractal low. A fractal is the highest high or lowest low of five consecutive candles.
Q: How are the bands calculated?
A: A candle is a fractal high if its high is at least as high as the highs of the two candles before and the two after it; a fractal low is the mirror case. Each band keeps the level of the last fractal until a newer one replaces it.
Q: Can I change the settings of the Fractal Chaos Bands?
A: The source defines no period or other number. You can change the colour, width and visibility of the two lines and of the fill. On the platform the dialog shows a checkbox, a colour and a line width for High and Low, and a checkbox and a colour for Fill; there is no number to set.
Q: What is the signal?
A: The first close above the upper band is a Higher signal and the first close below the lower band is a Lower signal. The filter used here is a 100-period simple moving average: Higher only above it, Lower only below it.
Q: How can I reduce false breaks?
A: One filter is a 100-period simple moving average. It removes some signals but does not say which of the remaining ones will win.
Q: Is there a script for it?
A: Yes. IQOW Fractal Chaos Bands Break in our scripts library marks a close through either band, without the SMA filter.
Q: Can I use a stop loss with it on binary options?
A: No. A binary option has no stop loss and no take profit. A CFD trade has both.

