
Last updated: 8 October 2026. Every screenshot below was recorded on 8 October 2026 on an IQ Option Practice account registered in Brazil, on EUR/USD 5-minute candles; the Chart analysis picture in Step 1 was recorded on 5 October 2026. We placed no real-money trade. The settings come from the platform’s dialog and the calculation from the published source code of the platform’s built-in indicators (Quadcode’s script library). This guide has no tested box: there is no entry rule for the line, so it measures the usual claims about it, how close it stays to the price and how often it is crossed, on EUR/USD 5-minute candles recorded between 29 September and 5 October 2026.
The McGinley Dynamic is a moving average that changes its own speed: it moves towards the price by a smaller step when the price is running away from it and by a larger one when the price is close or below it, so that it follows the price more evenly than a fixed-length average. On IQ Option it is drawn over the price chart as one line, with a default period of 14. It is said to avoid whipsaws and to keep the separation from the price to a minimum. On 5-minute EUR/USD candles the platform’s line was on average 5.5 pips from the close, against 3.8 for an EMA of 14 and 4.4 for an SMA of 14; it was crossed by the close 132 times, against 184 and 162.
Quick answer
- What it plots: one line over the price chart, like a moving average.
- Formula: MG = MGprevious + (price − MGprevious) ÷ (n × (price ÷ MGprevious)4). The first value is an EMA of n candles; the default n is 14.
- Settings on the platform: Period 14 and Source (close); the Colors and display tab sets the colour and style of the line.
- Reading: a rising line is an uptrend and a falling line a downtrend; it is also used as a dynamic support or resistance line.
- Where: the Trend list of the Chart analysis panel; search for McGinley.
- Not tested here: there is no entry rule; what we measured is the distance from the price and the number of crossings, against an EMA and an SMA of the same period.
How do you add the McGinley Dynamic on IQ Option?
Set the chart
Choose the asset, the chart type and the candle size first: the indicator is calculated from the candles on the chart. The examples in this guide use 5-minute candles on EUR/USD. These steps use the web traderoom on a Practice balance, and the numbers in each screenshot match the numbers in the text. If you do not have an account yet, see how to register.
Step 1: Open Chart analysis
Click the indicators button (1), the wave icon in the chart toolbar at the bottom left of the chart. The Chart analysis panel opens with the tabs Indicators, Templates, Widgets and Scripts. Stay on Indicators.

Step 2: Find McGinley Dynamic
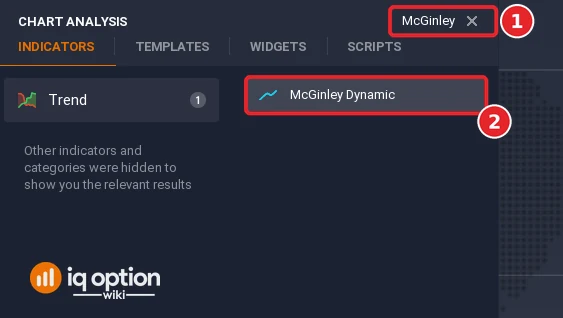
Type “McGinley” in the Search for indicators box (1), or open the Trend list, and click McGinley Dynamic (2).
Step 3: Check the settings
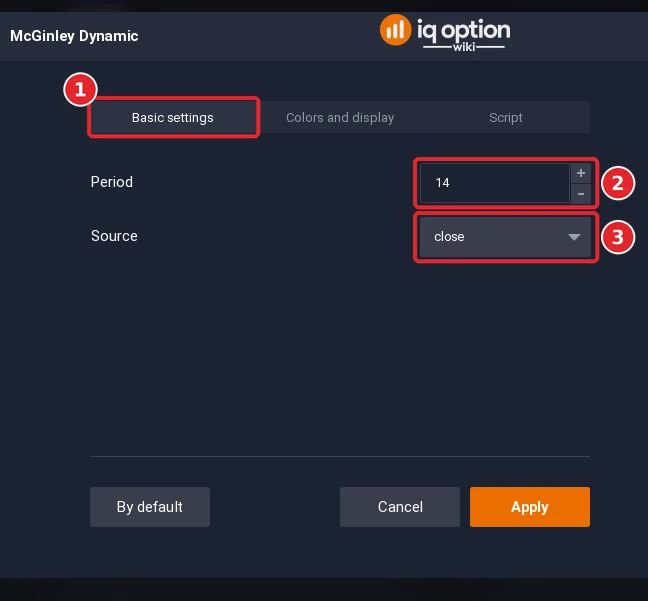
The dialog has the tabs Basic settings (1), Colors and display and Script. The Period (2) opens at 14, the length that sets the basic speed of the line. The Source (3) opens at close, the price the line follows.
Step 4: Check the colours and click Apply
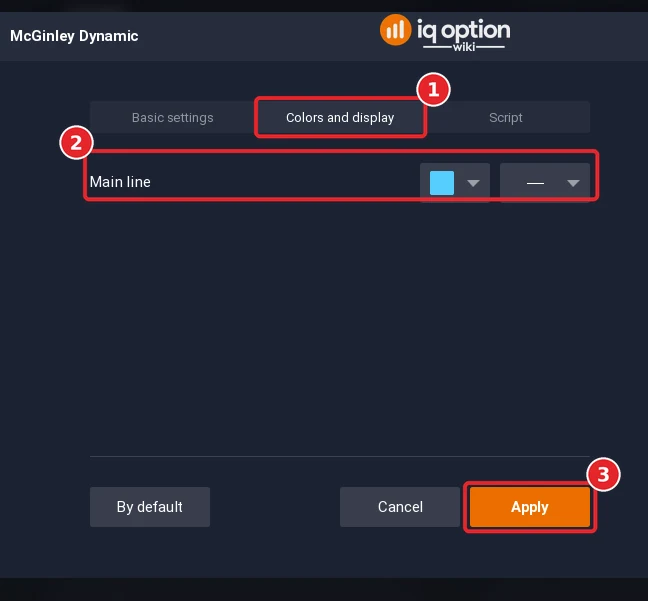
Open the Colors and display tab (1). The tab has one row, Main line (2), with a colour box, light blue by default, and a line-style box. Click Apply (3).
Step 5: Read the lines
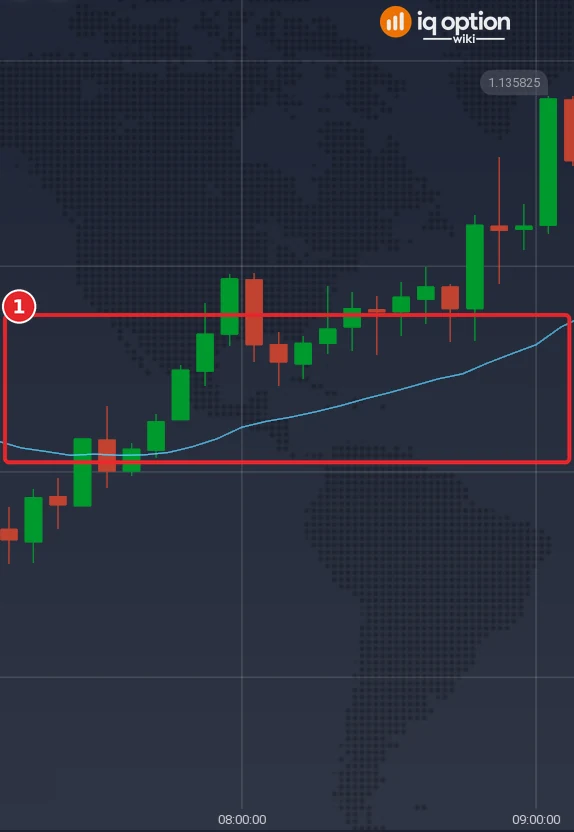
The McGinley Dynamic is drawn over the price chart as one thin light-blue line (1); it has no panel of its own. It runs through the candles more smoothly than the price does and lags behind it when the price moves fast.
How is the McGinley Dynamic calculated?
The Quadcode source starts the line with an exponential moving average of the source over the Period (14), and then, on every candle, moves the line towards the price: MG = MGprevious + (price − MGprevious) ÷ (Period × (price ÷ MGprevious)4). The fourth power of the ratio between the price and the line is the adjustment: when the price is above the line the ratio is larger than 1, the divisor grows and the line moves by a smaller step; when the price is below the line the ratio is smaller than 1, the divisor shrinks and the line moves by a bigger step. For EUR/USD the ratio is always very close to 1, so on a 5-minute chart the correction is small.
| Part | Default | What it does |
|---|---|---|
| Period | 14 | The length that sets the basic speed of the line |
| Source | close | The price the line follows |
The formula usually quoted has a constant k, 60% of the chosen period, in the divisor. The platform’s source has no such constant: the divisor is the period times the fourth power of the ratio. With k at 60% the divisor would be 40% smaller and the line would follow the price faster. The indicator is credited to John R. McGinley, in the 1990s, who wanted a line that adjusts itself to the speed of the market and stays close to the price.
How do you read the McGinley Dynamic?
The McGinley Dynamic looks like a moving average but is said to reduce the separation from the price to the minimum, which avoids whipsaws, and to adjust automatically to market conditions. The line is read as an average: a rising line is an uptrend and a falling line a downtrend, and it can be used as a dynamic support or resistance line, together with other support and resistance levels. Its limits are that the indicator is less widely known than other averages and that it takes practice to interpret.
What did it look like on 5-minute candles?
We replayed the library script on EUR/USD 5-minute candles recorded from the Practice traderoom: 1,093 candles from 29 September 2026 (01:55 UTC) to 2 October (20:55 UTC) and 241 from 4 October (21:00 UTC) to 5 October (17:00 UTC). We compared the McGinley Dynamic with an EMA and an SMA of the same period (14) over 1,306 candles, after the first 14 of each stretch (a crossing is counted between two consecutive candles).
| Line (period 14) | Average distance from the close | Median distance | Crossings by the close |
|---|---|---|---|
| McGinley Dynamic (platform) | 5.5 pips | 3.9 pips | 132 |
| EMA | 3.8 pips | 2.7 pips | 184 |
| SMA | 4.4 pips | 3.2 pips | 162 |
So the usual claim holds in one half only: the line was crossed less often, which is what “fewer whipsaws” means in numbers, but it was not closer to the price: it stayed further from the close than both averages.
Two stills of the platform, window A (its part from 07:09 to 09:08 is the Step 5 picture) and window B (not pictured), agree with the replay: read off the chart at 133 points of the two windows, the line differed from the replay of the script by 0.1 pip on average and by 0.5 pip at most. In window A, 29 September from 06:43 to 12:38 on the platform clock, the line starts at 1.13442, dips to 1.13408 around 07:30, rises to its high of 1.13489 at 09:30 and ends at 1.13396 at 12:35. The highest close, 1.13582 on the candle of 09:00, was 11 pips above the line, and the close crossed the line 8 times, three of them between 07:30 and 07:40. In window B, from 12:03 to 17:52, it starts at 1.13430, falls to 1.13219 at 15:00 and ends at 1.13371; the lowest close, 1.13146 on the candle of 13:55, was 16 pips under the line, and the close crossed it only 3 times, at 15:05, 17:15 and 17:35. (A point is drawn at the close of its candle: the value of the candle that opened at 09:00 sits at the 09:05 mark.)
Pros and Cons of the McGinley Dynamic
| Pros | Cons |
|---|---|
| The line slows down when the price runs away from it, so it is crossed less often than an EMA or an SMA of the same period: 132 crossings against 184 and 162 in our recording. | In our recording it stayed further from the price than both: 5.5 pips on average, against 3.8 and 4.4. |
| One setting, the period, and nothing else to tune. | The constant of 60% of the usual formula is not in the platform’s source, so the line is slower than that formula gives. |
| Can serve as a dynamic support or resistance line. | It gives no entry or exit rule by itself. |
Common mistakes
- Expecting it to hug the price. At the platform’s settings it was further from the close than an EMA of the same period.
- Comparing it with the formula. The platform has no 60% constant in the divisor.
- Reading a cross as a signal. There is no rule for it, and fewer crossings do not mean better ones.
- Using the same period as an EMA and expecting the same speed. The McGinley line is slower at the same period.
Related guides
- Trading with the EMA and simple moving average
- KAMA and ALMA and LSMA
- Support and resistance and leading and lagging indicators
- All indicator guides and all strategy guides
Frequently Asked Questions
Q: What is the McGinley Dynamic?
A: A moving average that adjusts its own speed to the speed of the price, by dividing each step by a power of the ratio between the price and the line. It is credited to John R. McGinley.
Q: What settings does the McGinley Dynamic have on IQ Option?
A: Period 14 and Source set to close. The Colors and display tab has a colour and a line style for the line.
Q: Does it avoid whipsaws?
A: It was crossed by the close less often than an EMA or an SMA of the same period: 132 times against 184 and 162 on our 5-minute EUR/USD candles.
Q: Does it stay closer to the price than a moving average?
A: Not in our recording: 5.5 pips from the close on average, against 3.8 for the EMA and 4.4 for the SMA of 14.
Q: Why is it slower than the usual formula says?
A: The formula has a constant of 60% of the period in the divisor. The platform’s source has none.
Q: Can I use the McGinley Dynamic on binary options?
A: The platform draws it on any chart. There is no entry rule for it, so any rule is something to test on the Practice balance with the expiry you plan to use.

