
Last updated: 8 October 2026. Every screenshot below was recorded on 8 October 2026 on an IQ Option Practice account registered in Brazil, on one-minute EUR/USD candles. We placed no real-money trade. The tested box reports ten one-dollar Practice orders from 2 October 2026 and a replay of the rule on recorded candles. It shows what the rule did on those days and says nothing about what it will do next.
The Donchian Channel and RSI strategy waits for a candle to reach a 20-candle extreme and for the RSI to turn back from it. A touch of the lower band followed by an RSI that closes back above 30 opens a Higher option; the mirror case at the upper band and 70 opens a Lower option, each with a five-minute expiry on one-minute candles. This guide shows how to set up both indicators on IQ Option’s current platform, how the entry works and what the rule did in our tests: 3 of 10 Practice orders won.
Quick answer
- Indicators: Donchian Channels, period 20, and RSI, period 14 with levels 30 and 70, on one-minute candles.
- Higher: a candle touches the bottom Donchian line while the RSI is at or below 30; the first candle that closes with the RSI back above 30 is the entry.
- Lower: the mirror: a candle touches the top line while the RSI is at or above 70; the first candle that closes with the RSI back below 70 is the entry.
- Expiry: five minutes, which is five one-minute candles. A binary option has no stop loss and no take profit.
- Our Practice test, 2 October 2026: 10 one-dollar orders, 3 won and 7 lost, a net loss of $4.45. At an 85% payout a trade needs to win more than 54% of the time to break even.
- Replay on recorded candles: on EUR/USD one-minute candles, 42 signals with the RSI smoothing of the Quadcode source (25 Higher, 17 Lower): 19 won, 22 lost, 1 refunded, 46.3% of decided trades. The RSI on the chart matched an exponential smoothing better, and that reading gave 86 signals: 37 won, 47 lost, 2 refunded, 44.0%. Both are below the 54.1% break-even rate at an 85% payout. With 84 trades the win rate has a margin of error of about ±5 points (one standard error), so 44.0% cannot be told from break-even.
How to use Donchian Channel
The Donchian Channel is named after the trader Richard Donchian. It draws a channel around price from two numbers: the highest high and the lowest low of the last n candles. IQ Option lists it as Donchian Channels, and its default period is 20 candles. The platform’s version also draws a third line halfway between the other two, so the chart shows a top line, a bottom line and a middle line.
Donchian Channel formula
With n as the period, the three lines are calculated like this:
| Line | Formula |
|---|---|
| Top line | The highest high of the last n candles |
| Bottom line | The lowest low of the last n candles |
| Middle line | (Top line + bottom line) ÷ 2 |
The count includes the candle that is still being drawn, and it counts candles of whatever size the chart uses, not days: on a one-minute chart, 20 candles are the last 20 minutes. Because the current candle is part of the window, a candle can reach a line but cannot go beyond it. When a candle makes a new 20-candle high, the top line moves up to that high, and a new 20-candle low pulls the bottom line down to it. A candle that touches the top line is therefore the highest of the last 20 candles, and a candle that touches the bottom line is the lowest. The strategy does not use the middle line.
How to prepare the chart to trade Donchian Channel / RSI strategy
These steps use the web traderoom on a Practice balance. The numbers in each screenshot match the numbers in the text. The strategy reads two things. The Donchian Channels show when a candle sits at a 20-candle extreme. The RSI is a momentum indicator that moves between 0 and 100: readings below 30 are called oversold and readings above 70 overbought. IQ Option’s blog notes that these levels describe what price has been doing and do not predict the next candle.
| Setting | Value in this guide |
|---|---|
| Candles | One-minute Japanese candles |
| Donchian Channels | Period 20 |
| RSI | Period 14, Overbought 70, Oversold 30 |
| Expiry | Five minutes, which is five candles |
Step 1: Open Chart analysis
Click the indicators button, the wave icon in the toolbar at the bottom left of the chart (1). The Chart analysis panel opens with the tabs Indicators, Templates, Widgets and Scripts. Its search box, “Search for indicators” (2), finds an indicator by name.

Step 2: Add the Relative Strength Index
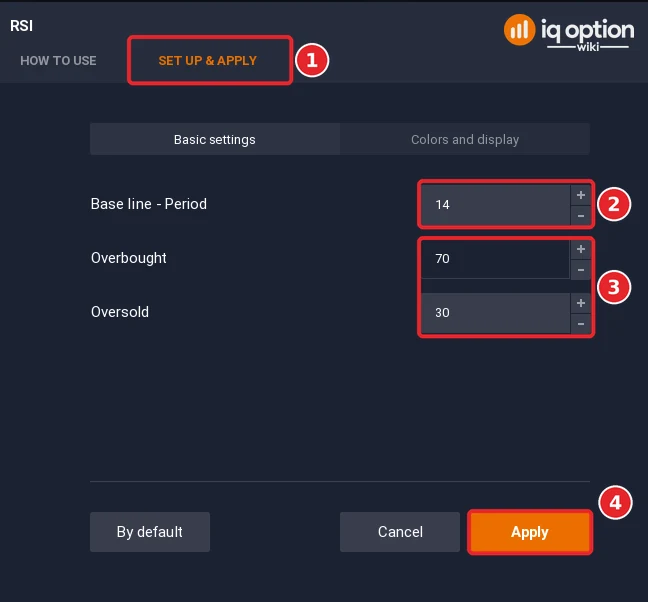
Type RSI in the search box and click Relative Strength Index (RSI) in the results. In the dialog that opens, switch from How to use to the Set up & apply tab (1). On Basic settings, check that Period (the field is labelled Base line – Period) is 14 (2) and that the support lines are Overbought 70 and Oversold 30 (3), then click Apply (4). The dialog has no other settings. The RSI line appears in a panel under the price chart. On the Colors and display tab you can change how the lines look; we left it unchanged.
Step 3: Add the Donchian Channels
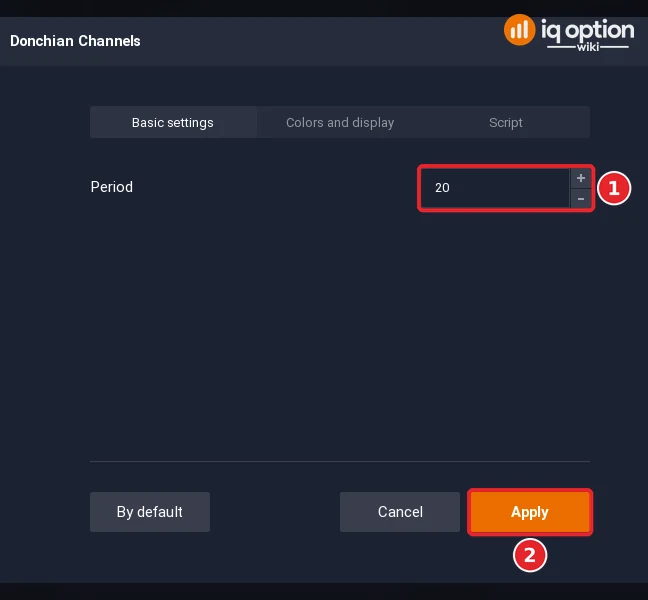
Click the indicators button again, type Donchian in the search box and click Donchian Channels; it is also in the Volatility list. The dialog opens on Basic settings, next to the Colors and display and Script tabs. Check that Period is 20 (1) and click Apply (2). Three lines appear on the price chart: a blue top line and bottom line with a shaded area between them, and an orange middle line. The Colors and display tab changes the colour and width of each line.
Step 4: Use one-minute candles
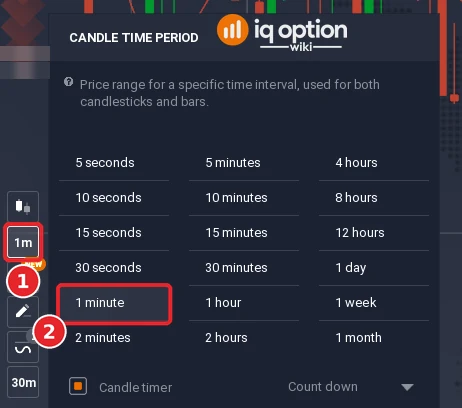
Click the candle time period button in the toolbar at the bottom left (1) and choose 1 minute (2). The chart should show Japanese candles; if it shows a line or bars, change it with the chart type button in the same toolbar (see chart types on IQ Option). Both periods count candles, so the 20-candle channel on this chart covers the last 20 minutes.
Step 5: Check the finished chart
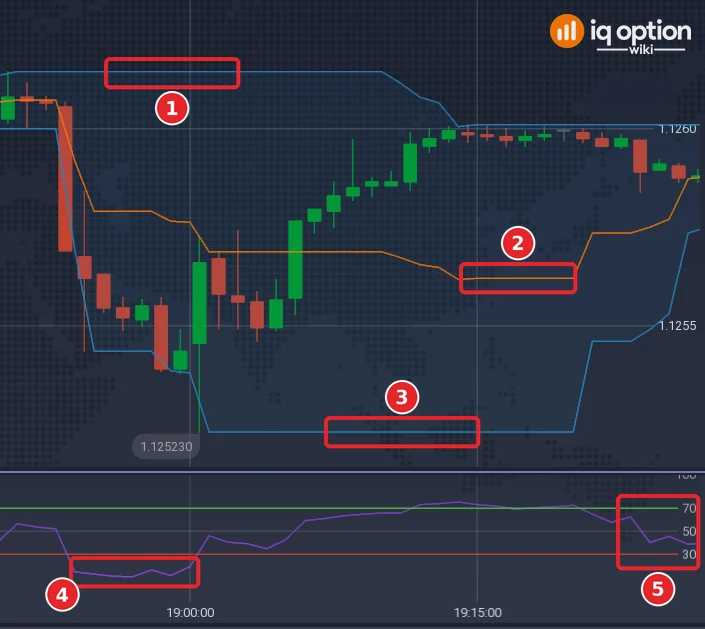
The price chart now shows the top line (1), the middle line (2) and the bottom line (3) of the Donchian Channels around the candles. The RSI panel under it shows the RSI line (4) and the support lines at 70 (green) and 30 (red) (5).
Step 6: Save the template
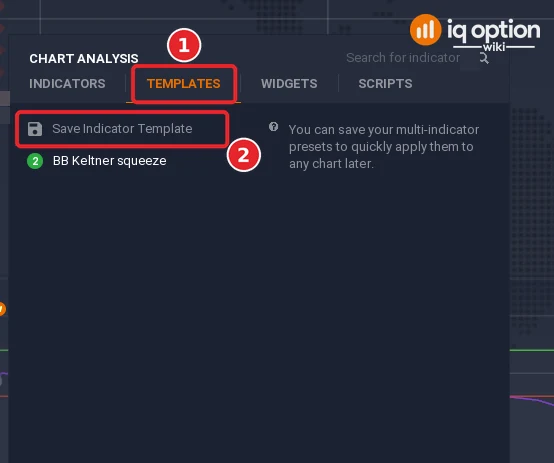
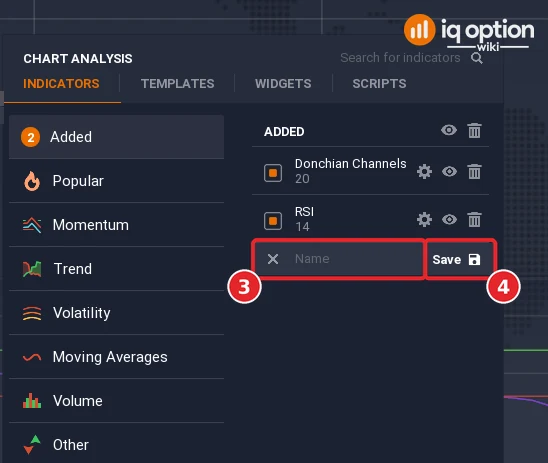
To keep the two indicators together, click the indicators button again, open the Templates tab (1) and click Save Indicator Template (2). The Indicators tab then opens on the Added list, which shows Donchian Channels 20 and RSI 14 and an empty Name field (3) with a Save button (4). Type a name, for example Donchian RSI, and click Save. We stopped at the empty Name field and did not save a template, so we did not test loading one back; the Templates tab says you can save multi-indicator presets to apply them to any chart later. For chart templates in general, see IQ Option chart templates.
Binary options strategy with the RSI and the Donchian Channel indicators
The strategy is a reversal reading. A candle that touches a Donchian line is the highest or lowest of the last 20 candles, and the RSI then shows whether momentum is turning back. The test below reads the rule like this:
| Part of the rule | Higher | Lower |
|---|---|---|
| Price | A candle touches the bottom line, so it is the lowest of the last 20 candles | A candle touches the top line, so it is the highest of the last 20 candles |
| RSI (14) | At or below 30 when the candle touches the line | At or above 70 when the candle touches the line |
| Trigger | The first candle that closes with the RSI back above 30 | The first candle that closes with the RSI back below 70 |
| Order | Higher option, five-minute expiry, opened when the trigger candle closes | Lower option, five-minute expiry, opened when the trigger candle closes |
Read the RSI on the closed candle. While a candle is still forming, the RSI moves with every price tick and can cross 30 or 70 and come back. A binary option has no stop loss and no take profit: it closes at the expiry time, and you choose only the direction, the expiry and the stake.
How to open a long binary option with the strategy that combines the RSI and the Donchian Channel
First watch the price chart for a candle that touches the bottom line of the channel. Then look at the RSI panel: it should be at or below 30 at that moment. Wait for the first candle that closes with the RSI back above 30. When that candle closes, open a Higher option with a five-minute expiry.
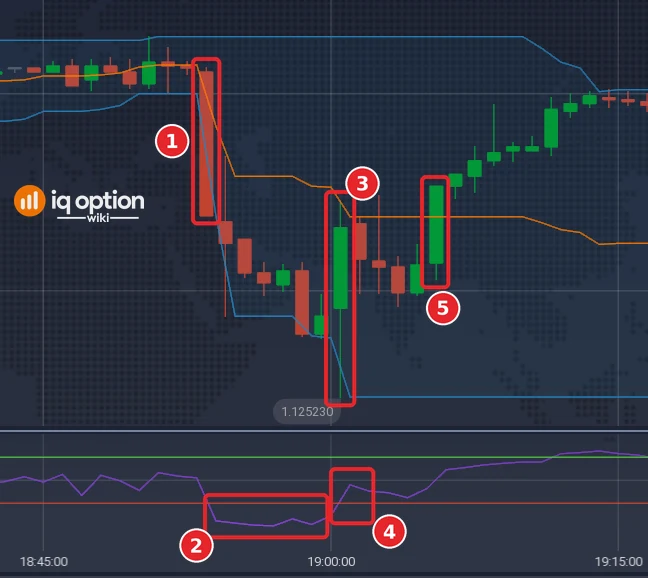
Example from our recording (platform clock UTC-3; times in UTC in brackets): on Sunday 4 October 2026 the candle at 18:53 (21:53 UTC) falls from 1.126055 to 1.12569 and the bottom line runs through its low (1). From that candle until 18:59 (21:59 UTC) the RSI line stays under the red 30 line (2). The candle at 19:00 (22:00 UTC) is the first to close with the RSI back above 30 (4), so it is the signal candle (3); its long lower wick also reaches a new 20-candle low at 1.12523. It closes at 1.12566, where the Higher option opens. The candle opening at 19:05 (22:05 UTC) closes at 1.125765 (5), and the option, which expires at 19:06 (22:06 UTC), ended above the entry, so it won.
How to open a short binary option with the strategy that combines the RSI and the Donchian Channel
The situation is the opposite. Watch for a candle that touches the top line of the channel while the RSI is at or above 70. Then wait for the first candle that closes with the RSI back below 70, and open a Lower option with a five-minute expiry when it closes.
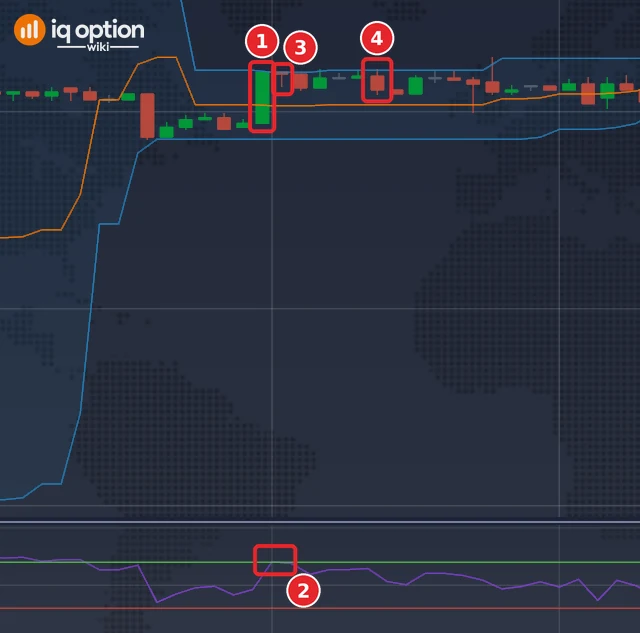
Example from our recording (platform clock UTC-3; times in UTC in brackets): on Sunday 4 October 2026 the candle at 18:29 (21:29 UTC) has its high of 1.1261 on the top line (1) and the RSI panel line touches the 70 line (2). The next candle (3), at 18:30 (21:30 UTC), is the first to close with the RSI back below 70, so it is the signal candle. It opens at 1.1261 and closes at 1.126095, and the Lower option opens at that price. Five candles later the candle opening at 18:35 (21:35 UTC) closes at 1.126055 (4), and the option, which expires at 18:36 (21:36 UTC), ended there: below the entry, so it won. The replay’s figures for the touch and signal candles are 70.4 and 69.1 (RSI smoothed exponentially) against 68.1 and 67.4 (the smoothing of the Quadcode source); on the screenshot we can only see that the line sits at the 70 line on the touch candle and just under it on the next, not read the value to a tenth.
What the examples do not show, and what we checked on the chart
Both examples above won, but the replay in the tested box lost more often than it won. The first Lower signal of the replay, on Friday 2 October at 19:31 UTC, entered at 1.125925 and exited at 1.12601, a loss; we did not record that chart, so it has no figure. We read the RSI line off our recorded chart (platform clock 18:10 to 19:25 on 4 October) for 49 candles and compared it with the RSI computed from the same candles. With exponential smoothing (alpha 2 ÷ (n + 1)) the two differed by 1.8 points on average; with Wilder-type smoothing (alpha 1 ÷ n, the smoothing in the Quadcode source) by 6.0 points. A screenshot cannot give better than about one point, but the chart’s RSI behaves like the exponential reading, and the RSI dialog has no setting to change the smoothing. That is why the tested box gives both replays, with the Quadcode smoothing and with the exponential smoothing. We did not compare every crossing of the replay with the live chart.
Tested on IQ Option: 2 October 2026 (Practice orders) and 8 October 2026 (replay)
| Asset and candles | Practice orders: ten one-dollar orders on a Practice balance, one at a time, on six regular currency pairs (GBP/JPY twice, EUR/GBP twice, USD/JPY twice, AUD/USD twice, EUR/JPY and EUR/USD). One-minute candles. The search for each order’s signal started between 10:01 and 11:25 UTC on Friday 2 October 2026. Replay: EUR/USD (binary, regular market), one-minute candles recorded from IQ Option’s Practice traderoom: 1,505 candles in two unbroken runs, Friday 2 October 2026 18:23 to 21:00 UTC and Sunday 4 October 21:01 to Monday 5 October 19:29 UTC. The replay uses recorded candles and placed no real orders. |
|---|---|
| Rule tested | On one-minute candles, a candle touches the bottom Donchian Channels line (period 20) while the RSI (period 14) is at or below 30, and the first candle that then closes with the RSI back above 30 opens a Higher option. The mirror case, a touch of the top line while the RSI is at or above 70 and a first close with the RSI back below 70, opens a Lower option. Each option has a five-minute expiry and opens when the trigger candle closes. |
| Signals | Practice orders: 10, of which 5 Higher and 5 Lower. Replay, RSI smoothed as in the Quadcode source: 42 (25 Higher, 17 Lower), each opened at the close of the trigger candle. Replay, RSI smoothed exponentially (the reading that matched our chart): 86 (46 Higher, 40 Lower). A signal whose expiry fell after the last recorded candle is not counted. |
| Outcomes | Practice orders: 3 won, 7 lost, none refunded; a net loss of $4.45 on $10 staked. Higher: 3 of 5 won. Lower: none of 5 won. The three winning orders paid 85%. Replay, Quadcode smoothing: 19 won, 22 lost, 1 refunded (equal price): 46.3% of the 41 decided trades. Higher: 10 of 24 decided won; Lower: 9 of 17. At an 85% payout that is a net loss of $5.85 on $42 staked, one dollar per signal. The library script IQOW Donchian RSI Reversal gave the same 42 signals on the same candles. Replay, exponential smoothing: 37 won, 47 lost, 2 refunded: 44.0% of the 84 decided trades. Higher: 20 of 44 decided won; Lower: 17 of 40. At an 85% payout that is a net loss of $15.55 on $86 staked. We read the RSI line off a recorded chart for 49 candles: it differed from the exponential reading by 1.8 points on average and from the Quadcode reading by 6.0 points. |
| Break-even | At an 85% payout a trade needs to win more than 54% of the time to break even (1 ÷ 1.85); at 87%, 53.5%. Three wins in ten orders is 30%. |
Ten orders placed over about an hour and a half of one Friday morning (UTC) say nothing about how the rule will behave in other hours, on other pairs or in other weeks. IQ Option’s own blog says most strategies need dozens, and often hundreds, of trades before the results mean anything. The replay is a look back at candles recorded from IQ Option’s Practice traderoom on 2 and 4 to 5 October 2026; it placed no real orders and is not a forecast. A short test proves nothing about the future, and no profit and no win rate is promised here.
How to use the strategy that combines the RSI and the Donchian Channel indicators on IQ Option
None of the points below makes the rule win more often. They are checks that keep your own test honest.
- Look at what the market is doing. The rule bets that a stretched price turns back. IQ Option’s RSI article says that in strong trends the RSI can stay in the oversold or overbought zone for quite a long time, and its Highest High and Lowest Low article says that when price reaches the outer line it either continues or rebounds, and that it is not always easy to tell which. Our script library’s note on this rule adds that a return across 30 or 70 can be followed by a fresh push in the direction of the trend.
- Check the payout. It changes by asset and over time; we saw 82% to 91% on options between 2 and 4 October 2026. At an 85% payout a trade needs to win more than 54% of the time to break even.
- Keep the news in view. IQ Option’s Help says to keep an eye on market news, which could affect the movement of your chosen asset. Our guide to reading the economic calendar covers one way to do it.
- Choose the pair with care. Our Practice test used six regular currency pairs and singled none out. See choosing a currency pair for how pairs differ.
- Use one expiry. The rule uses five minutes on a one-minute chart, which is five candles; see expiry times on IQ Option for how to choose it.
- Count every result. IQ Option’s blog on backtesting says the rules must stay fixed during a test and that most strategies need dozens, and often hundreds, of trades before the results mean anything. Write down each order, including the losing ones.
Pros and Cons
| Pros | Cons |
|---|---|
| Both conditions can be seen on the chart: a touch of a line and an RSI level. | A strong trend can keep price on a line and the RSI in its zone, so the turn never comes. |
| The rule can be written down and run on a Practice balance at no cost. | Our ten Practice orders on 2 October 2026 won 3; the replay gave 42 signals (19 won, 22 lost, 1 refunded) with the Quadcode smoothing and 86 (37 won, 47 lost, 2 refunded) with the exponential smoothing the chart matched. |
| The same chart serves Higher and Lower entries. | It needs the chart open all the time, because the entry is valid only when the trigger candle closes. |
Summary
The Donchian Channel and RSI strategy marks a candle that reaches a 20-candle extreme and then waits for the RSI to leave the oversold or overbought zone. On IQ Option it takes two indicators on a one-minute chart, a rule that fits in a few lines and a five-minute expiry. Ten Practice orders on 2 October 2026 produced 3 wins and 7 losses, and the replay on recorded candles produced 19 wins, 22 losses and 1 refund from 42 signals, or 37 wins, 47 losses and 2 refunds from 86 signals with the RSI smoothing that the chart’s RSI matched. Both are looks at the past, not forecasts. Practise on the Practice balance, keep the rule fixed, count your own results over a few hundred trades and compare your win rate with the break-even rate before you risk money. Our guide to money management covers how much to stake.
Common mistakes
- Entering while the trigger candle is still open. The RSI can cross 30 or 70 and come back before the candle closes.
- Entering on any RSI cross. The rule needs a touch of the matching line first, with the RSI in its zone when that candle touches.
- Waiting for price to cross its own band. The channel includes the candle being drawn, so the most a candle can do is touch a line.
- Trading it in a strong trend, where price can stay on a line and the RSI can stay below 30 or above 70 for a long time.
- Treating the option like a margin trade. A binary option has no stop loss and no take profit; it closes at the expiry time.
Related guides
- Donchian Channel indicator on IQ Option
- RSI indicator trading on IQ Option
- RSI and support and resistance strategy
- Combining Bollinger Bands and RSI
- The Turtle trading story, the article behind the library’s Donchian breakout script
- Chart time frames on IQ Option
- IQ Option scripts library, with a Donchian and RSI reversal script that marks this rule on your chart
- All indicator guides and all strategy guides
Frequently Asked Questions
Q: What does the Donchian Channel show?
A: The highest high and the lowest low of the last n candles, with a middle line halfway between them. At the default period of 20, the top line on a one-minute chart is the highest high of the last 20 minutes.
Q: Which settings does this strategy use?
A: Donchian Channels with period 20, RSI with period 14 and levels 70 and 30, one-minute candles and a five-minute expiry.
Q: When do I open a Higher option?
A: When a candle has touched the bottom line while the RSI was at or below 30, and the RSI then closes back above 30. Open the option when that candle closes. For a Lower option, use the top line and the 70 level.
Q: How did the rule do in your test?
A: In a Practice test on 2 October 2026, 3 of 10 one-dollar orders won and 7 lost, a net loss of $4.45. The replay on recorded candles gave 42 signals: 19 won, 22 lost and 1 was refunded, which is 46.3% of the decided trades against 54.1% needed to break even at an 85% payout; with the exponential RSI smoothing that matched the chart it gave 86 signals, 37 won, 47 lost and 2 refunded, 44.0%. Ten orders are too few to say anything about the rule, and so is a replay on a few days of candles.
Q: Can I use it on a five-minute chart?
A: The strategy was tested on one-minute candles only, so a five-minute chart is not covered here.
Q: Can I set a stop loss or take profit?
A: No. A binary option closes at its expiry time and has neither.
Q: Is there a script that marks this rule on the chart?
A: Yes. The script library has a Donchian and RSI reversal script that draws a marker on the entry candle. Import it as shown in our scripts guide.
Q: Can I practise it without real money?
A: Yes. The Practice balance was $10,000 when we looked, and it has a Refill to $10,000 button. See how to start on IQ Option.

