
Last updated: 8 October 2026. Every screenshot below was recorded on 5 and 8 October 2026 on an IQ Option Practice account registered in Brazil. We placed no real-money trade. This guide explains the indicator and tests no trading rule: the formula comes from the published source code of the platform’s built-in RSI (the Quadcode Script library), the default settings from the platform’s RSI dialog, the readings come from IQ Option’s own blog, which we read on 5 October 2026, and nothing here is a promise of profit.
The Relative Strength Index (RSI) compares the strength of recent price gains with recent losses and plots the result on a scale from 0 to 100; IQ Option’s RSI dialog opens at a period of 14 with levels at 70 and 30. IQ Option’s own blog says these levels describe what price has been doing, that they do not predict the next candle, and that a reversal idea needs evidence from price, such as a rejection at a known level or a failed breakout. This guide shows how to add RSI to the chart, how it is calculated and what each reading can and cannot tell you.
Quick answer
- Formula: RSI = 100 − 100 ÷ (1 + RS), where RS is the average gain divided by the average loss over the RSI period.
- Defaults in IQ Option’s published source: Period 14, Overbought 70, Oversold 30, and an Average setting that starts on SSMA, a smoothed moving average.
- 70 and 30: they describe what price has been doing and do not predict the next candle, says IQ Option’s blog. In a strong trend RSI can stay above 70 or below 30 for a long time.
- 80 and 20: fewer readings, not a setting shown to be better. IQ Option’s blog calls 14, 70 and 30 a common reference and changes a setting only after testing a fixed rule on unseen data.
- What to add: a price event, such as a rejection at a known level, a failed breakout or a break of a swing low, and a level that proves the idea wrong. A binary option has no stop loss, so check that level before you buy.
- Tested: this guide tests no trading rule.
Understanding the best RSI indicator
RSI is a momentum oscillator developed by J. Welles Wilder Jr. Despite the name, it does not compare one asset with another: it measures the momentum inside one price series. It rises when gains dominate the chosen period and falls when losses dominate. It is calculated from the candles on your chart, so the same setting of 14 means 14 one-minute candles on a one-minute chart and 14 daily candles on a daily chart.
| Reading | What it means | What it does not mean |
|---|---|---|
| Above 70 | Recent gains have been much stronger than recent losses. Traders call this overbought. | That the top is in. In an uptrend RSI can cross 70, ease toward 60 and rise above 70 again. |
| Around 50 | Recent gains and losses are closer to balance. | One cross of 50 is not an entry. It matters more when it agrees with the price structure. |
| Below 30 | Recent losses have been much stronger than recent gains. Traders call this oversold. | That the asset is cheap or that buyers must arrive on the next candle. |
IQ Option’s blog adds that RSI describes the move already on the chart. It does not choose the trade.
What is the best RSI setting for day trading?
IQ Option’s blog says there is no one setting that suits every market. RSI(14) is a practical reference, and the overbought and oversold lines are usually 70 and 30, which are also the defaults in the platform’s dialog. A shorter period reacts faster and produces more extreme readings, which also means it reacts to more noise; a longer period is smoother. Raising the overbought line to 80 and lowering the oversold line to 20 gives fewer readings, because the line has to travel further to reach them. Another IQ Option blog article names a period of 21 with 80 and 20 as a conservative preset.
Whether the wider levels give better readings is not something the sources show. The blog says it starts with 14, 70 and 30 because they provide “a common reference”, that they are not optimised settings, and that it changes a setting only when it can test a fixed entry, exit and invalidation rule on unseen data.
Can RSI be used as a filter?
Yes, as a second opinion on a price event, not as the event itself. IQ Option’s blog gives a range example. A market has held between a support and a resistance, price trades above the resistance and RSI rises above 70, but the candle closes back inside the range and RSI turns down through 70. Before entering, the blog defines three things: the context (price rejected a tested range boundary), the confirmation (RSI turned down and crossed back below 70) and the invalidation (price closes back above the rejection high). If price closes above the resistance and holds there, the range idea is over, and RSI does not overrule the breakout.
The same blog warns that during a breakdown or a news-driven move RSI can stay below 30 while price keeps falling, so a low reading at a support line is not enough on its own to expect a rebound. For marking the levels in the first place, see support and resistance on IQ Option and the RSI and support and resistance strategy.
On what markets should I use RSI?
An IQ Option blog article calls RSI a universal indicator that can be used on any asset and any time frame, and the calculation is the same everywhere because it only needs a series of prices. That does not make the readings equally useful everywhere. The same article warns that during strong trends RSI can stay in the overbought or oversold zone for a long time, and that no indicator gives accurate readings every time.
How the RSI is calculated
IQ Option calculates the Relative Strength Index for you, but the formula explains what its readings mean. The published source of the platform’s built-in RSI takes four steps. It uses the candle price its Source input selects, and the dialog does not show that box:
- For each candle, take the change from the previous candle’s price. A rise counts as a gain and a fall counts as a loss.
- Average the gains and, separately, the losses over the RSI period, 14 candles by default.
- RS = average gain ÷ average loss.
- RSI = 100 − 100 ÷ (1 + RS).
- Worked numbers. If the average gain is three times the average loss, RS is 3 and RSI is 75. Equal average gains and losses give an RSI of 50. If the average loss shrinks toward zero, RS grows without limit and the formula approaches 100; if the average gain is zero, RS is 0 and RSI is 0.
- The averaging method. In the published source the averaging starts on SSMA, a smoothed simple moving average, and the source has an Average input. The platform’s RSI dialog shows no such box, only the period and the two levels, so you cannot change the averaging there. The source calls a built-in function for the smoothing and does not show how it is built, so this guide does not print a smoothing formula. IQ Option’s blog says only that Wilder used a simple average to start the first value and then smoothed the later gains and losses, and that a 14-period RSI needs 14 price changes before its first value appears.
- Values differ between platforms. IQ Option’s blog lists price feeds, candle boundaries, available history and initialisation as reasons. A one-point gap is not a trading signal.
- The default levels are 70 and 30. They are two more settings of the same indicator, and the published source accepts any value from 1 to 100 for each. Moving them to 80 and 20 gives fewer readings, not a result shown to be better.
Setting up RSI on your IQ Option account
These steps use the web traderoom on a Practice balance. The numbers in each screenshot match the numbers in the text. The formula comes from the Quadcode Script library, which publishes the source code of the platform’s built-in indicators.
Step 1: Open Chart analysis
Click the indicators button (1), the wave icon in the chart toolbar at the bottom left of the chart. It opens the Chart analysis panel, which has the tabs Indicators, Templates, Widgets and Scripts and the lists Added, Popular, Momentum, Trend, Volatility, Moving Averages, Volume and Other.

Step 2: Find RSI
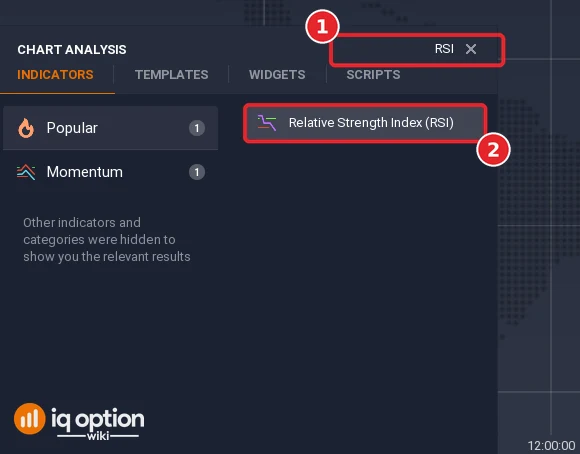
Type RSI in the Search for indicators box (1) and click the result named Relative Strength Index (RSI) (2). The search finds it under both Popular and Momentum, so you can also open either list.
Step 3: Check the settings and apply
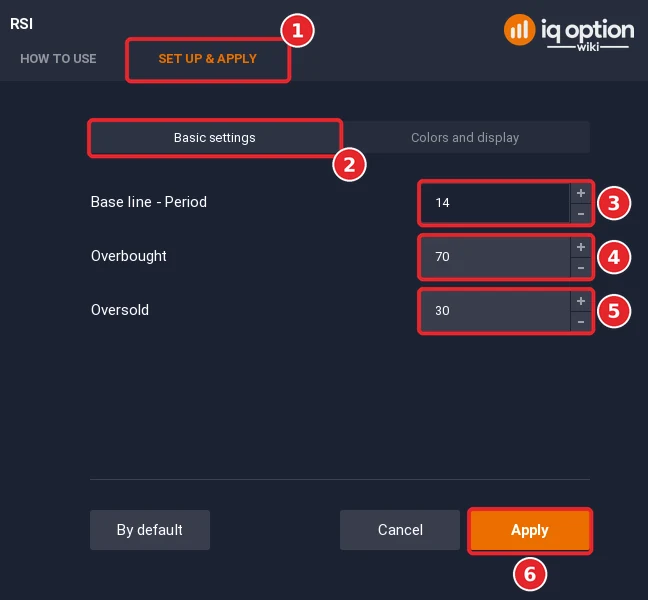
The dialog has two tabs, How to use and Set up & apply. Open Set up & apply (1). It has two sub-tabs, Basic settings (2) and Colors and display, and Basic settings holds three boxes: Base line – Period (3), Overbought (4) and Oversold (5). They open at 14, 70 and 30. Click Apply (6) to keep them. The Colors and display tab holds the line colours. The By default button at the left is named for restoring the opening values.
Step 4: Read the RSI panel
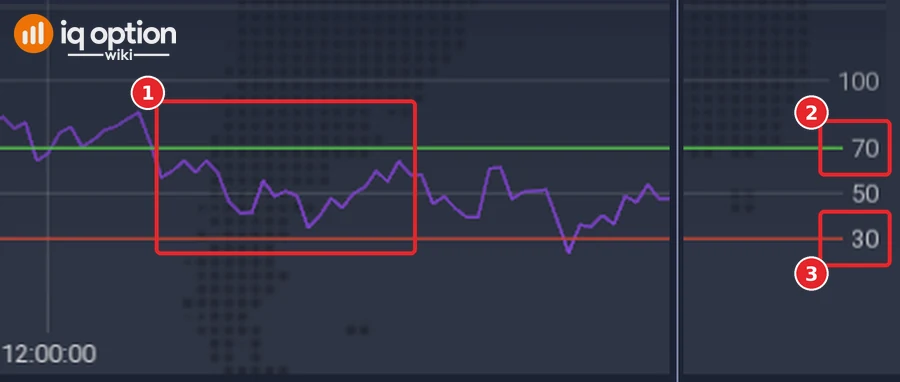
RSI opens in its own panel under the price chart. The panel header reads RSI (14) with a settings icon, a hide icon and a close icon. It draws the RSI line (1) in purple, a green line at the overbought level (2) and a red line at the oversold level (3); the scale beside it is marked 100, 70, 50 and 30.
Using RSI to trade on IQ Option
No RSI reading makes a trade profitable by itself. IQ Option’s own blog says the levels describe what price has been doing and do not predict the next candle. What follows is how the blog reads each level. It tells you when to look closer at price. It is not a trading rule we tested, and it is not a promise of profit.
When RSI crosses the 70 mark
RSI above 70 means upward momentum has been strong, and the blog checks whether price is trending or rejecting a known level. In a trend a move above 70 is normal. The blog’s example is a daily uptrend: price breaks above a previous high, RSI(14) moves above 70 and reaches 80, eases toward 60 during a mild pullback, then moves above 70 again as price makes a new high. Its conclusion is that overbought does not mean the top is in. It would not buy simply because RSI crossed 70; it uses the reading to avoid an unsupported short against the trend.
A reversal idea needs a reason from price: a rejection at resistance, a failed breakout, a close back inside a range or a break of a recent swing low.
When RSI crosses the 30 mark
RSI below 30 means downward momentum has been strong. It does not mean the asset is cheap or that buyers must arrive on the next candle. During a breakdown or a news-driven move RSI can remain below 30 while price continues falling, so the blog wants to see price stop making lower lows before it treats the reading as part of a reversal setup. Asked whether RSI below 30 is a buy signal, the blog answers: not by itself. It says to look for stabilisation and a defined invalidation level instead of assuming oversold means cheap.
The 50 line
The blog reads the centreline as a rough momentum filter. RSI holding above 50 supports positive momentum, RSI holding below 50 supports negative momentum, and repeated crossings around 50 suggest mixed conditions. One cross is not an entry, and the line matters more when it agrees with the price structure.
Pros and Cons of RSI Indicator
| What it gives you | Where it falls short |
|---|---|
| One line on a fixed scale from 0 to 100, with common reference levels at 30, 50 and 70. | It describes the move already on the chart. It does not choose the trade or predict the next candle. |
| Three readings to look at: an extreme, a cross of the 50 line, and divergence. | In a strong trend it can stay above 70 or below 30 for a long time, so an extreme is not a reversal signal. |
| Three settings you can change: the period and the two levels. | A shorter period reacts faster but also reacts to more noise, and a divergence can fail. |
| It is calculated from the candles on your chart, so it follows whichever candle size you use. | Values can differ slightly between platforms, because of price feeds, candle boundaries, available history and initialisation. |
Best RSI Practices
IQ Option’s blog gives this check before using an RSI signal. The answers come from price and from your own rules, not from the indicator.
| Check | What to ask |
|---|---|
| Market condition | Is the market trending, ranging or unclear? |
| Indicator reading | Is it an extreme, a cross of the 50 line or a divergence? |
| Price evidence | Is there a rejection, a breakout, a break of a swing level, or nothing? |
| Time frame | Does RSI use the same candles as the trade decision? On a daily chart RSI uses daily changes; on a 15-minute chart it uses changes between 15-minute closes. |
| Invalidation | Which price proves the idea wrong? |
| Costs and size | Does the trade still make sense after spread and risk limits? |
Two notes for binary options. A binary option has no stop loss and no take profit, so the invalidation question is something you answer before you buy, not an order you can place. It pays a fixed percentage, so the break-even rate is set by the payout: at an 85% payout a trade has to win more than 54% of the time (1 ÷ 1.85).
Understanding RSI divergence for better trading on IQ Option
Divergence compares the swings of price with the swings of RSI.
| Type | Price | RSI |
|---|---|---|
| Bearish divergence | Makes a higher high | Makes a lower high |
| Bullish divergence | Makes a lower low | Makes a higher low |
IQ Option’s blog gives a bearish example: price rises from 100 to 111, RSI reaches 81 at the first high but only 69 at the second, higher high. The divergence warns that the second rise had weaker momentum. It does not identify an entry by itself. The blog waits for price to confirm, for example with a close below the most recent pullback low, and treats the idea as failed if price closes above the latest high. A proper test has to count the failed signals as well as the clean ones.
The blog’s FAQ says divergence can expose weakening momentum, that it cannot tell you exactly when price will reverse and that some divergences fail, so it treats a divergence as a warning that needs a price trigger. No source we read gives a success rate for RSI divergence. For more on the pattern, see our divergence guide.
Common mistakes
- Selling because RSI crossed 70, or buying because it crossed 30. Both are momentum readings, and in a trend they can last.
- Moving the levels to 80 and 20 and expecting better results. The levels only change how many readings you get.
- Comparing RSI on different candle sizes as if the setting of 14 meant the same window.
- Treating a one-point difference between platforms as a signal.
- Using RSI on its own. An IQ Option blog article says RSI is rarely used alone and names Bollinger Bands and the Alligator as partners.
Related guides
- RSI with support and resistance
- Combining Bollinger Bands and RSI
- RSI, Stochastic and EMA 200 strategy
- 5-minute strategy with RSI, EMA and an engulfing candle
- Donchian Channel and RSI strategy
- RSI law strategy
- Overbought and oversold markets
- Momentum indicator on IQ Option
- MACD indicator on IQ Option
- All indicator guides and all strategy guides
Frequently Asked Questions
Q: What are the default RSI settings on IQ Option?
A: The dialog opens with a period of 14, an overbought level of 70 and an oversold level of 30 (checked on 5 October 2026). The published source also starts its smoothing on SSMA.
Q: How is the RSI calculated?
A: RS is the average gain divided by the average loss over the period, and RSI = 100 − 100 ÷ (1 + RS). If the average gain is three times the average loss, RSI is 75. The steps are in the calculation section above.
Q: Is RSI above 70 a sell signal?
A: Not by itself, according to IQ Option’s blog. It shows strong recent upward momentum. A reversal idea needs evidence from price, such as a rejection, a failed breakout or a broken swing structure.
Q: Can RSI be used in isolation for trading decisions?
A: IQ Option’s blog says RSI describes the move already on the chart and does not choose the trade, and another IQ Option blog article says it is rarely used on its own.
Q: How can I avoid false signals generated by the RSI indicator?
A: You cannot remove them. Wider levels (80 and 20) give fewer readings, and the blog asks for a price trigger and a defined invalidation level before a reading becomes a setup. Test any change on the market and candle size you trade.
Q: What RSI trading strategies are there on this site?
A: The related guides above combine RSI with support and resistance, Stochastic, EMA, engulfing candles, Donchian channels and Bollinger Bands. Each one states its own rule.
Q: Is RSI applicable to all types of assets?
A: An IQ Option blog article calls it usable on any asset and time frame. In strong trends RSI can stay in the overbought or oversold zone for a long time, so a reading on one asset says little about another.
Q: How can I customize the RSI settings?
A: Open the indicator’s dialog from Chart analysis, go to Set up & apply and change the Base line – Period or the two levels. The blog’s advice is to test any change on the market and candle size you trade before you rely on it.
Q: Does an RSI strategy work?
A: IQ Option’s blog says the indicator calculates past momentum correctly and that profitability depends on the rules built around it. It cites a large study of 6,406 technical rules across 41 equity markets, including 600 RSI variations, in which the rules that looked strongest in the original sample generally did not keep that advantage on unseen data. That study covers equities, not binary options, and we have not checked it ourselves. You can register an account (see how to register), use the Practice balance and count your own results against the break-even rate first.

