
Last updated: 8 October 2026. Every screenshot below was recorded on 8 October 2026 on an IQ Option Practice account registered in Brazil, on EUR/USD 5-minute candles; the Chart analysis picture in Step 1 was recorded on 5 October 2026. We placed no real-money trade. The settings come from the platform’s dialog and the calculation from the published source code of the platform’s built-in indicators (Quadcode’s script library). The tested box shows what the breakout method and the overbought and oversold method did with the platform’s default Offset and with the usual multiple of 1.5, on EUR/USD 5-minute candles recorded between 29 September and 5 October 2026; it says nothing about what will happen next.
The Keltner Channels draw three lines over the price chart: an exponential moving average of the typical price, (high + low + close) ÷ 3, with an upper and a lower band at a multiple of the average true range (ATR) above and below it. On IQ Option the dialog calls the multiple Offset and the period is 20 by default. There are two ways to trade it: a close beyond a band is a breakout, and a close back inside the channel after a break is an overbought or oversold signal. The platform opens at an Offset of 5, which makes a channel about 35 pips wide on 5-minute EUR/USD, so the price closed beyond a band on only 14 of 1,296 candles; with the usual 1.5, it did so on 432.
Quick answer
- What it plots: three lines over the price chart: the middle line, an EMA of the typical price, and an upper and a lower band; the area between the bands is filled.
- Formula: middle = EMA((high + low + close) ÷ 3, Period); bands = middle ± Offset × ATR(Period), where the ATR is a Wilder average of the true range.
- Settings on the platform: Period 20, Offset 5 and Moving Average EMA.
- Reading: a close beyond a band is a breakout; the return of the price inside the channel after a break is also traded.
- Where: the Volatility list of the Chart analysis panel; search for Keltner.
- Tested: with the platform’s Offset of 5 the two methods gave only 4 signals each; with 1.5 they gave 102 each, and the 5-minute trades won between 48.5% and 53.9% of the decided trades. Break-even is 54.1% at an 85% payout, and a few days of one pair prove nothing.
How do you add the Keltner Channels on IQ Option?
Set the chart
Choose the asset, the chart type and the candle size first: the indicator is calculated from the candles on the chart. The examples in this guide use 5-minute candles on EUR/USD. These steps use the web traderoom on a Practice balance, and the numbers in each screenshot match the numbers in the text. If you do not have an account yet, see how to register.
Step 1: Open Chart analysis
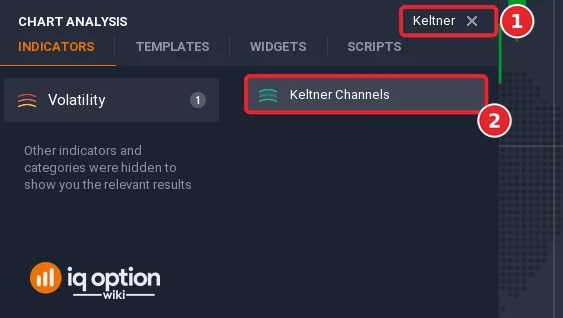
Click the indicators button (1), the wave icon in the chart toolbar at the bottom left of the chart. The Chart analysis panel opens with the tabs Indicators, Templates, Widgets and Scripts. Stay on Indicators.

Step 2: Find Keltner Channels
Type “Keltner” in the Search for indicators box (1), or open the Volatility list, and click Keltner Channels (2).
Step 3: Check the settings
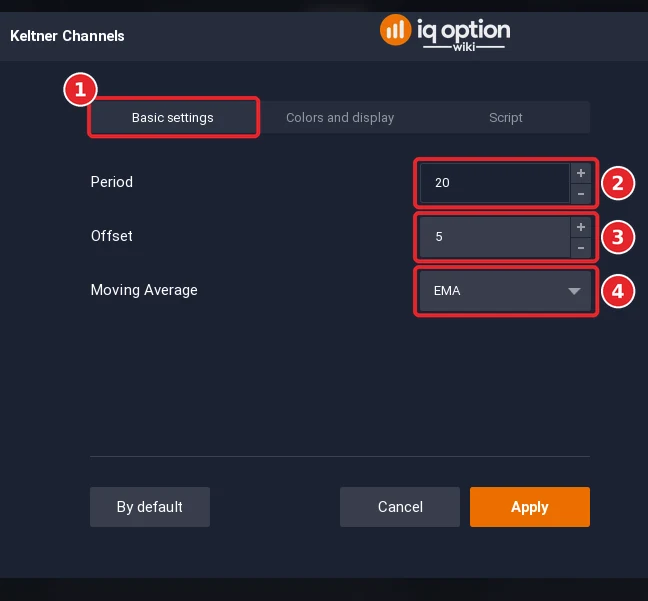
The dialog has the tabs Basic settings (1), Colors and display and Script. The Period (2) opens at 20, the length of the moving average and of the ATR. The Offset (3) opens at 5, the multiple of the ATR between the middle line and each band. The Moving Average (4) opens at EMA, the kind of average of the middle line.
Step 4: Check the colours and click Apply
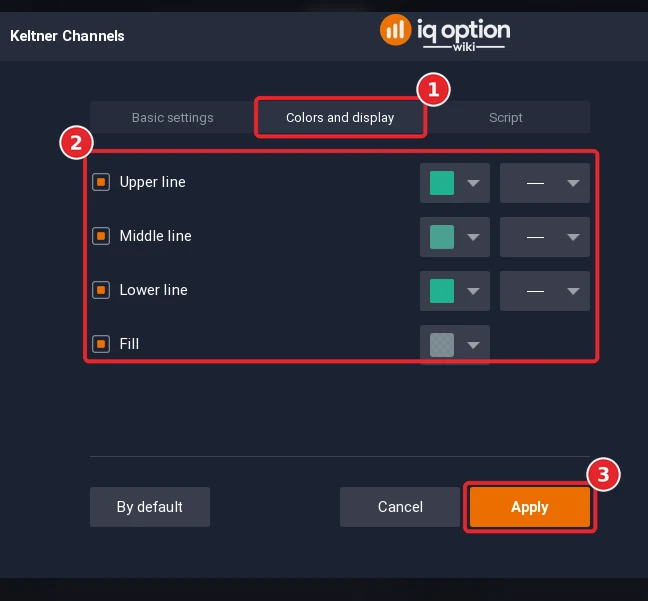
Open the Colors and display tab (1). The tab has four rows: Upper line, Middle line and Lower line, each with a checkbox, a colour box and a line-style box, and Fill, the colour of the area between the bands. All are teal by default. Click Apply (3).
Step 5: Read the lines
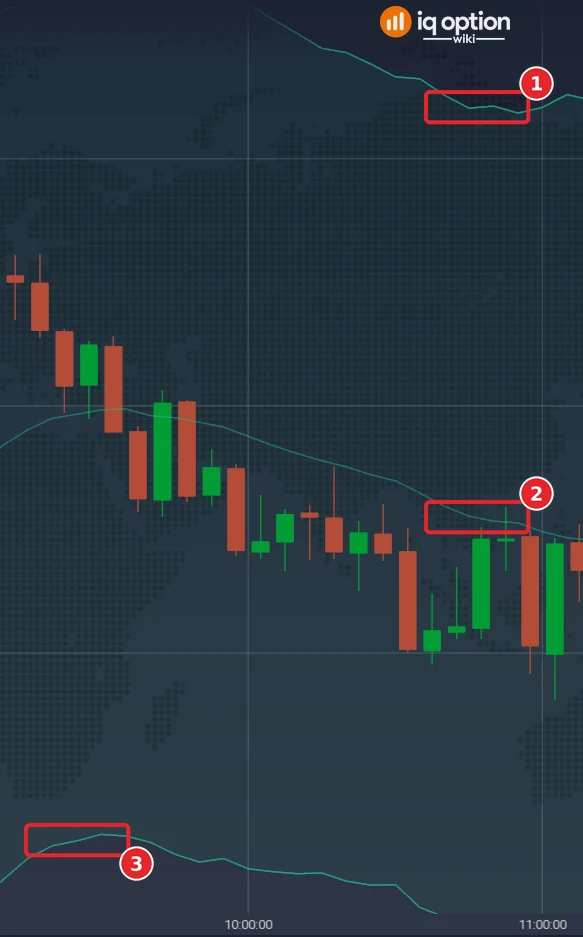
Three teal lines are drawn over the candles: the upper band (1), the middle line (2) and the lower band (3), with the area between the bands lightly filled. With the default Offset of 5 the channel is about 35 pips wide, wider than the range of prices on the screen, so the three lines are never all visible in one column.
How are the Keltner Channels calculated?
The Quadcode source computes the middle line as a moving average of the typical price over the Period (20); the Average setting chooses the kind of average and opens on the exponential one. It then computes the average true range over the same period (a Wilder smoothing of the true range) and multiplies it by the Offset. The upper band is the middle line plus that distance and the lower band is the middle line minus it. The usual description is the same: a moving average of the typical price over 10 or 20 candles and the ATR times a multiple, most often 1.5; the platform calls the multiple the Offset.
| Part | Default | What it does |
|---|---|---|
| Period | 20 | Length of the moving average and of the ATR |
| Offset | 5 | The multiple of the ATR between the middle line and each band |
| Moving Average | EMA | The kind of moving average of the middle line |
The Offset is the setting that decides how often the price reaches a band. With the platform’s default of 5 the channel is wide: on our 5-minute EUR/USD candles the median distance between the bands was 35 pips. With an Offset of 1.5 it was 11 pips.
How do you read the Keltner Channels?
It has three uses: identifying the trend, catching price breakouts and recognising overbought and oversold zones. Breakout: when the price closes above the upper band an uptrend is expected, a signal to buy; when it closes below the lower band a downtrend is likely, a signal to sell. Overbought and oversold: this works best in a ranging market; after the price breaks the lower band and then closes again within the channel, a trader can enter an up trade, and after a break of the upper band and a close within it, a down trade; waiting for the close inside helps to avoid being trapped by a trend that continues. Settings: the default settings are usually kept; for scalping one may shorten the period to 10 to 15 but should leave the Offset unchanged, because a smaller one makes the channel too narrow to give signals.
What did it look like on 5-minute candles?
We replayed the library script on EUR/USD 5-minute candles recorded from the Practice traderoom: 1,093 candles from 29 September 2026 (01:55 UTC) to 2 October (20:55 UTC) and 241 from 4 October (21:00 UTC) to 5 October (17:00 UTC). With the default period the bands have a value from the 21st candle of each stretch, 1,296 values in all.
- Offset 5 (platform default): a close above the upper band on 1 candle and below the lower band on 13; the channel was 12 to 89 pips wide, median 35.
- Offset 1.5 (the usual multiple): a close above the upper band on 150 candles and below the lower band on 282; the channel was 4 to 27 pips wide, median 11.
Two stills of the platform, window A (its part from 09:09 to 11:08 is the Step 5 picture) and window B (not pictured), agree with the replay. With the default Offset of 5, in window A, 29 September from 05:56 to 11:45 on the platform clock, the channel is 31 to 37 pips wide (median 34) and in window B, from 12:03 to 17:52, 30 to 45 pips (median 36). At 09:00 the replay puts the middle line at 1.13467, the upper band at 1.13635 and the lower band at 1.13299: on the still the middle line is where 1.13467 lies on the price scale, the upper band is in the top part of the chart and leaves the screen a candle later, and the lower band is at the bottom edge. No candle closes beyond a band in either window. (The platform draws the value of a candle at the time the candle closes: the candle that opened at 08:00 sits at the 08:05 mark.)
The two methods, tested
We wrote the two methods as rules on closed candles, with the option opened at the close of the signal candle. Breakout: Higher on the candle that closes above the upper band after a candle that closed at or below it; Lower below the lower band. Return inside: Higher on the candle that closes back inside the channel after the previous candle closed below the lower band; Lower on the candle that closes back inside after a close above the upper band. Each was run with the platform’s Offset of 5 and with 1.5. No expiry is given, so the box shows five minutes and, for the 1.5 version, fifteen minutes.
Tested on IQ Option: six readings of the Keltner Channel rules, EUR/USD 5-minute candles of 29 September to 5 October 2026
| Asset and candles | EUR/USD binary (regular, not OTC): 1,334 five-minute candles (2026-09-29 01:55 to 2026-10-02 20:55 UTC and 2026-10-04 21:00 to 2026-10-05 17:00 UTC). The candles were recorded from IQ Option’s Practice traderoom. The replay places no orders; it only scores the rule on those closed candles, at an 85% payout. |
|---|---|
| Rule tested | The two methods on closed candles, the option opening at the close of the signal candle. Breakout: Higher on the candle that closes above the upper band after a candle that closed at or below it; Lower below the lower band. Return inside: Higher on the candle that closes back inside the channel after the previous candle closed below the lower band; Lower on the candle that closes back inside after a close above the upper band. Each with the platform’s Offset of 5 and with the usual 1.5; no expiry is given, so the box shows 5 minutes and, for 1.5, 15 minutes. |
| Signals | Platform default offset 5: breakout, 5-minute, 1 candle: 4 signals (1 Higher, 3 Lower) Platform default offset 5: return inside, 5-minute, 1 candle: 4 signals (3 Higher, 1 Lower) Offset 1.5 (the usual formula): breakout, 5-minute, 1 candle: 102 signals (48 Higher, 54 Lower) Offset 1.5: return inside, 5-minute, 1 candle: 102 signals (54 Higher, 48 Lower) Offset 1.5: breakout, 5-minute, 3 candles: 102 signals (48 Higher, 54 Lower) Offset 1.5: return inside, 5-minute, 3 candles: 102 signals (54 Higher, 48 Lower) |
| Outcomes | Platform default offset 5: breakout, 5-minute, 1 candle: 1 won, 3 lost, 0 tied; 25.0% of the 4 decided trades won; net −$0.54 per $1 staked at 85% (−$0.52 at 91%) Platform default offset 5: return inside, 5-minute, 1 candle: 1 won, 3 lost, 0 tied; 25.0% of the 4 decided trades won; net −$0.54 per $1 staked at 85% (−$0.52 at 91%) Offset 1.5 (the usual formula): breakout, 5-minute, 1 candle: 48 won, 51 lost, 3 tied; 48.5% of the 99 decided trades won; net −$0.10 per $1 staked at 85% (−$0.07 at 91%) Offset 1.5: return inside, 5-minute, 1 candle: 55 won, 47 lost, 0 tied; 53.9% of the 102 decided trades won; net −$0.00 per $1 staked at 85% (+$0.03 at 91%) Offset 1.5: breakout, 5-minute, 3 candles: 51 won, 51 lost, 0 tied; 50.0% of the 102 decided trades won; net −$0.07 per $1 staked at 85% (−$0.04 at 91%) Offset 1.5: return inside, 5-minute, 3 candles: 52 won, 50 lost, 0 tied; 51.0% of the 102 decided trades won; net −$0.06 per $1 staked at 85% (−$0.03 at 91%) |
| Break-even | At an 85% payout a trade needs to win more than 54.1% of its decided trades to break even (1 ÷ 1.85); at 91%, more than 52.4% (1 ÷ 1.91). |
A replay is only a look back at candles recorded on the dates above: it placed no real orders, covers about four and a half days of one pair, and counts overlapping trades as if they were independent. A short test proves nothing about the future, and no profit and no win rate is promised here. IQ Option’s own blog on backtesting says that most strategies need dozens, and often hundreds, of trades before a result means anything.
With the platform’s Offset of 5 each method gave only 4 signals in 4.5 days (1 won of 4 for the breakout and 1 won of 4 for the return), which is nothing to judge by. With an Offset of 1.5 each gave 102 signals. The breakout won 48 of 99 decided trades with a 5-minute trade (48.5%) and 51 of 102 with a 15-minute trade (50.0%); the return inside the channel won 55 of 102 (53.9%) and 52 of 102 (51.0%). With about 100 trades one standard error is 5 points, so all four results are within the margin of error of the break-even rate of 54.1%.
Pros and Cons of the Keltner Channels
| Pros | Cons |
|---|---|
| Bands that follow the volatility: they widen when the candles get larger and narrow when they shrink. | The default Offset of 5 is so wide that the price rarely touches a band on a 5-minute chart. |
| Three lines and one fill, with only three settings. | The usual multiple of 1.5 and the platform’s 5 are very different; check the Offset before you read the bands. |
| Works for both a breakout and a return rule. | In our test neither method clearly beat the break-even rate at an offset of 1.5. |
Common mistakes
- Waiting for a close beyond a band at the default Offset. At 5 it happened on 14 of 1,296 candles.
- Reading the usual multiple as the platform’s default. The usual formula uses 1.5; the dialog opens at 5.
- Trading breakouts in a range. The return method works best in ranging markets.
- Narrowing the channel without a test. A smaller Offset gives many more signals and more noise.
Related guides
- Bollinger Bands on IQ Option and Donchian Channel
- STARC Bands strategy and Chande Kroll Stop
- Identifying breakouts and trading a ranging market
- All indicator guides and all strategy guides
Frequently Asked Questions
Q: What are the Keltner Channels?
A: A moving average of the typical price with an upper and a lower band at a multiple of the average true range above and below it.
Q: What settings do the Keltner Channels have on IQ Option?
A: Period 20, Offset 5 and Moving Average EMA. The Colors and display tab has a colour and a line style for each of the three lines and a colour for the fill.
Q: Why is the platform’s Offset so large?
A: The platform opens at 5. On 5-minute EUR/USD that made a channel about 35 pips wide. The formula uses a multiple of 1.5, which you can type into the Offset box.
Q: How do I trade a breakout of the channel?
A: The usual rule buys when the price closes above the upper band and sells when it closes below the lower band. The results are in the tested box.
Q: What is the overbought and oversold method?
A: After a break of a band, wait for the close to return inside the channel and trade in that direction: up after a break of the lower band, down after a break of the upper band.
Q: Can I use the Keltner Channels on binary options?
A: The platform draws them on any chart. Whether a rule works is something to test on the Practice balance with the expiry you plan to use.

