
Last updated: 8 October 2026. Every screenshot below was recorded on 8 October 2026 on an IQ Option Practice account registered in Brazil, on EUR/USD 5-minute candles; the Chart analysis picture in Step 1 was recorded on 5 October 2026. We placed no real-money trade. The settings come from the platform’s dialog and the calculation from the published source code of the platform’s built-in indicators (Quadcode’s script library). This guide has no tested box: there are readings, not entry rules, and the zero line of a running total depends on where the sum starts; it shows what the line did on recorded candles.
The Accumulative Swing Index (ASI) gives each candle a swing value, which says how much the candle moved in one direction compared with the previous candle, and adds the values into a running total. On IQ Option it opens in its own panel under the price chart as one line, with one setting, the Limit Move Value (0.5). Because it is a running total, its level and its zero line depend on the first candle the platform loaded, so only the slope of the line and its turns carry information. On 5-minute EUR/USD candles the line followed the price: the sign of its 12-candle change matched the sign of the price’s change on 96% of the candles.
Quick answer
- What it plots: one line in a panel under the price chart.
- Formula: ASI = the previous ASI + 50 × (the candle’s swing ratio) × K ÷ Limit Move Value, where the swing ratio compares the close with the previous close, the open and the previous open, and K is the largest move of the high or the low from the previous close.
- Settings on the platform: one, the Limit Move Value, 0.5 by default.
- Reading: a rising line follows a rising price and a falling line a falling price; positive values are read as an uptrend, negative values as a downtrend and values near zero as a range.
- Where: the Other list of the Chart analysis panel; search for Accumulative Swing.
- Not tested here: there is no entry rule, and the zero line of a running total depends on where the sum starts.
How do you add the Accumulative Swing Index on IQ Option?
Set the chart
Choose the asset, the chart type and the candle size first: the indicator is calculated from the candles on the chart. The examples in this guide use 5-minute candles on EUR/USD. These steps use the web traderoom on a Practice balance, and the numbers in each screenshot match the numbers in the text. If you do not have an account yet, see how to register.
Step 1: Open Chart analysis
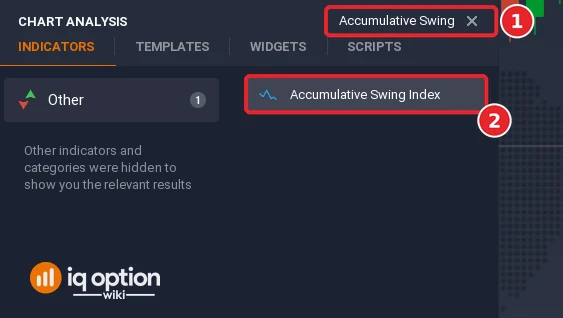
Click the indicators button (1), the wave icon in the chart toolbar at the bottom left of the chart. The Chart analysis panel opens with the tabs Indicators, Templates, Widgets and Scripts. Stay on Indicators.

Step 2: Find Accumulative Swing Index
Type “Accumulative Swing” in the Search for indicators box (1), or open the Other list, and click Accumulative Swing Index (2).
Step 3: Check the settings
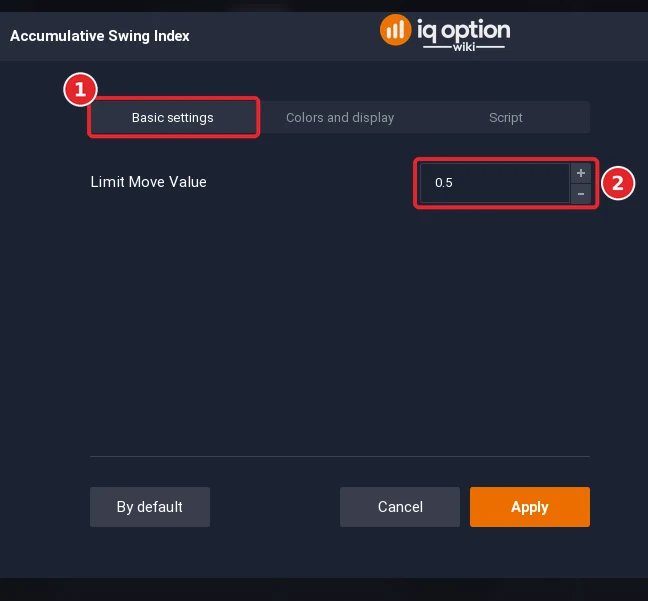
The dialog has the tabs Basic settings (1) and Colors and display. The Limit Move Value (2) opens at 0.5, the divisor of each candle’s swing value: a smaller value makes the line larger.
Step 4: Check the colours and click Apply
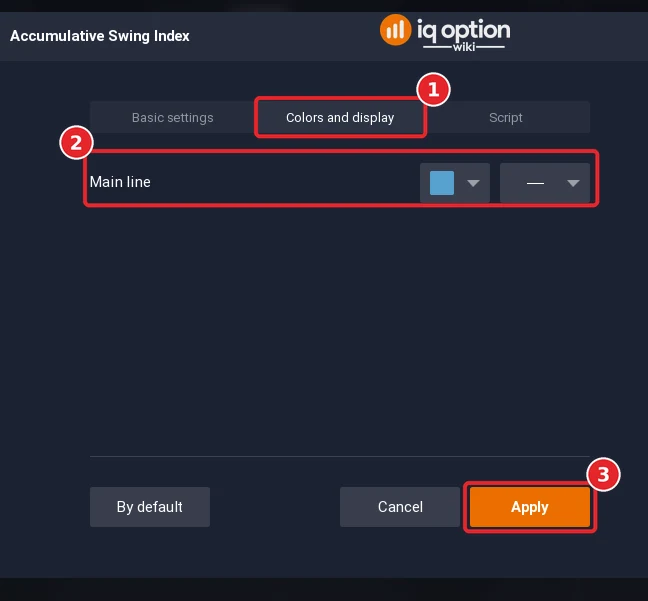
Open the Colors and display tab (1). The tab has one row, Main line, blue by default, with a colour box and a line-style box. Click Apply (3).
Step 5: Read the panel
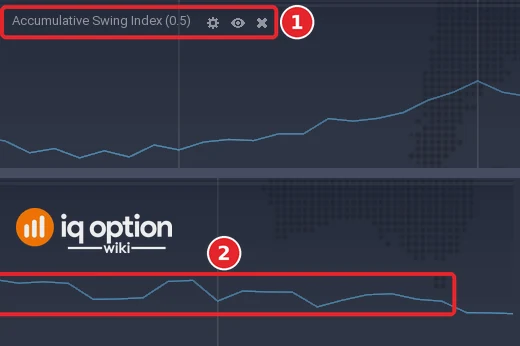
The line is drawn in its own panel under the price chart. The title bar of the panel reads Accumulative Swing Index (0.5), the name and the Limit Move Value, followed by the settings, eye and close icons (1). The line is blue (2). The platform draws no numbers on the scale of this panel, so read the shape of the line: its slope and its turns.
How is the Accumulative Swing Index calculated?
The Quadcode source works in three steps for each candle. First it compares the high, the low, the close and the open of the candle with the close and the open of the candle before, and builds a reference move R from the largest of three distances: the high from the previous close, the low from the previous close, or the high from the low. When the largest is the high’s or the low’s distance from the previous close, R is that distance minus half of the other of the two; when it is the high from the low, R is that distance; in every case a quarter of the previous candle’s body (its open to its close) is added. Second, it forms the swing ratio: the close minus the previous close, plus half of this candle’s body and a quarter of the previous candle’s body (each as close minus open, with its sign), divided by R. Third, it multiplies the ratio by 50 and by K, the larger distance of the high or the low from the previous close, divides by the Limit Move Value, and adds the result to the total of all the candles before. The indicator is credited to J. Welles Wilder Jr.
| Part | Default | What it does |
|---|---|---|
| Limit Move Value | 0.5 | The divisor of each candle’s swing: the smaller the value, the larger the line |
The line is a running total, so it starts at zero on the first candle that the platform has loaded and wanders from there. It is used for long-term currency and stock price movements and especially in swing trading.
How do you read the Accumulative Swing Index?
The line is read against zero and against the price. It rises above 0 when the price increases, which means an uptrend, and falls below 0 and stays there when the price drops, which means a downtrend; a ranging market gives readings close to 0. The line follows the price, makes similar swing highs and lows, and so confirms the patterns of the candles; it also helps to confirm divergences and to spot breakouts from the general trend, and trend lines can be drawn on it as on a price chart. The usual advice is to be ready to open a position for a price increase when the line moves up, and to close an up position and sell when the line is in the negative area. The ASI is not a standalone indicator and can give false signals.
One thing to keep in mind: since the line is a running total, “above zero” only says that the candles since the start of the data have added more upward than downward swing. A chart that the platform loads from a different starting point has the same shape with a different zero.
What did it look like on 5-minute candles?
We replayed the library script on EUR/USD 5-minute candles recorded from the Practice traderoom: 1,093 candles from 29 September 2026 (01:55 UTC) to 2 October (20:55 UTC) and 241 from 4 October (21:00 UTC) to 5 October (17:00 UTC). Each stretch starts the sum at zero, so the two have separate scales.
- First stretch: the line went from 0.01 to −1.46, with a low of −2.05 and a high of 0.17, while EUR/USD fell from 1.1367 to 1.1257. It was above zero on only 22 of 1,092 candles.
- Second stretch: from 0.00 to −0.90 with a low of −1.44.
- With the price: the change of the line over 12 candles had the same sign as the change of the price on 1,248 of 1,306 candles (96%).
Two stills of the platform, window A (the Step 5 picture shows its two ends) and window B (not pictured), agree with the replay. The panel has no numbers on its scale, so the check compares shapes: read off the chart at 65 candles of each window, the height of the line fitted the replay, with one scale and one offset per window, to a root mean square of 0.4 pixel in window A and 0.5 pixel in window B (largest error 3 pixels). In window A, 29 September from 06:14 to 11:58 on the platform clock, the line makes a low at 06:40, rises to a first peak at 08:00 and to its high at 09:05, 0.34 above the low, and falls back by 0.27 until 11:55. In window B, from 11:27 to 17:11, it makes a low at 12:30 and a high at 13:00, falls to its lowest point at 14:55, rises by 0.21 in the single candle that closes at 15:05, reaches its high at 16:40 and ends 0.05 under it. (A point is drawn at the close of its candle: the value of the candle that opened at 09:00 sits at the 09:05 mark.) The heights are the replay’s, whose sum starts at 01:55 UTC on 29 September; the platform’s own zero is not on the screen.
Pros and Cons of the Accumulative Swing Index
| Pros | Cons |
|---|---|
| It follows the price closely, so it can confirm a move: 96% of the 12-candle changes had the sign of the price’s. | That is also why it adds little to the price chart on its own. |
| One setting, and a swing value that uses the open, the close, the high and the low of two candles. | The zero line depends on where the sum starts, so “above zero” and “below zero” are not stable signals. |
| Trend lines can be drawn on the line as on a price chart. | It is not a standalone indicator. |
Common mistakes
- Reading the zero line as a trend line. It is the zero of a running total that began at the first loaded candle.
- Comparing the level between two charts. The same candles can give different levels if the chart starts earlier.
- Changing the Limit Move Value to make the line larger or smaller and calling it a signal. It only rescales the line.
- Using it alone. It needs other tools.
Related guides
- Accumulation/Distribution and Volume Oscillator and Net Volume
- Parabolic SAR and trendlines
- Identifying a trend and leading and lagging indicators
- All indicator guides and all strategy guides
Frequently Asked Questions
Q: What is the Accumulative Swing Index?
A: A running total of a swing value computed for each candle from its open, high, low and close and those of the candle before. It is credited to J. Welles Wilder Jr.
Q: What settings does the Accumulative Swing Index have on IQ Option?
A: One: the Limit Move Value, 0.5 by default.
Q: What does the Limit Move Value do?
A: It is the divisor of each candle’s swing value: a smaller value makes the line larger. It does not change when the line turns.
Q: What does a value above zero mean?
A: That the candles since the start of the data have added more upward than downward swing. The zero line moves if the chart starts from a different candle.
Q: Is it useful for swing trading?
A: It is said to be especially beneficial for swing traders and for long-term currency and stock movements; we measured it only on 5-minute candles.
Q: Can I use the ASI on binary options?
A: The platform draws it on any chart. Whether a rule built on it works is something to test on the Practice balance with the expiry you plan to use.

